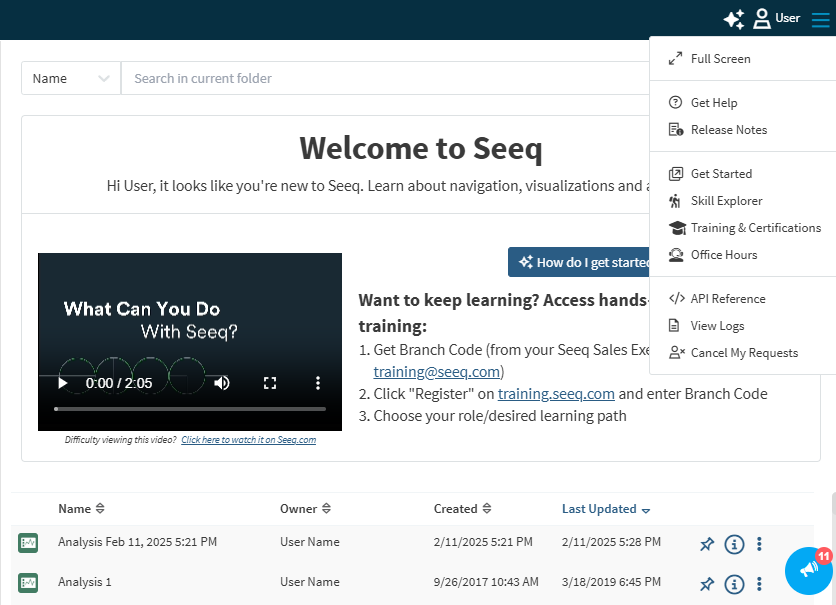
This page documents new features and capabilities as they become available to users. You will also find this information in Seeq from the blue megaphone on the bottom right corner of the home screen.
The announcements in Seeq will always be up to date with the version of Seeq you can access. If you see something on this page that is not yet announced via your megaphone, it is likely because you are on an older version.
You may also have access to Release Notes from the hamburger menu in the upper right corner, along with other helpful links.
October 12, 2026
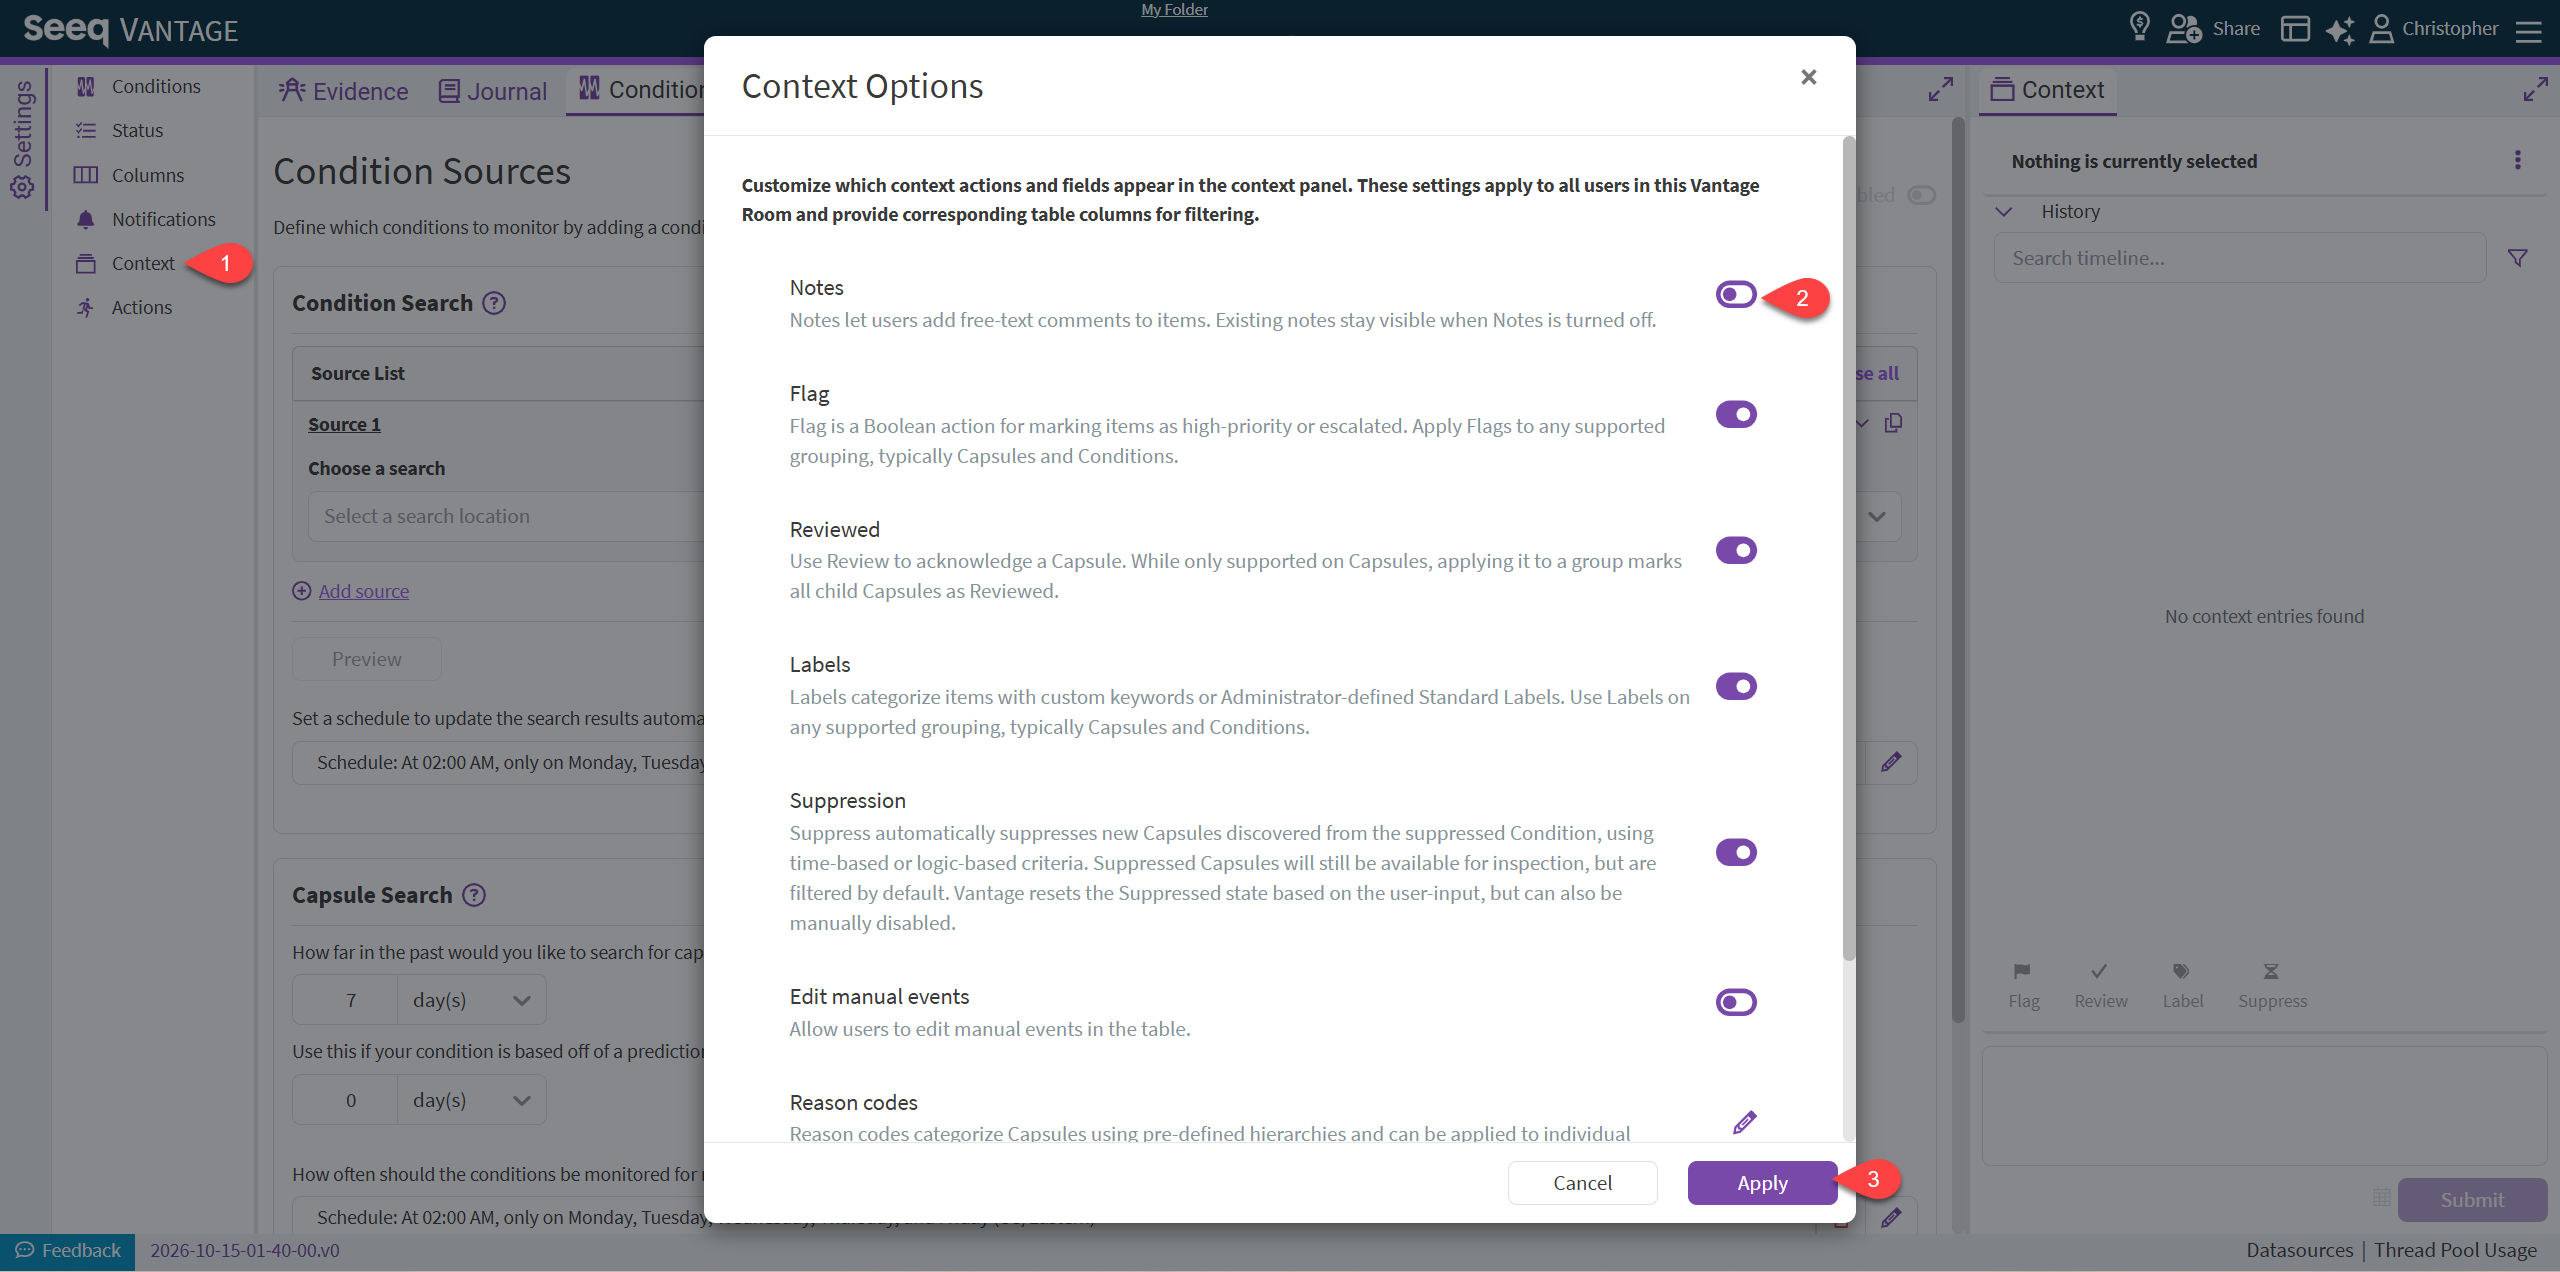
Vantage Configuration to disable Notes
You can know disable the Notes field for a given Vantage Room. This is may be desired if you are leveraging other User-Defined Context to capture free-text entry from users and would prefer not to use the general Notes field.
This requires at least Manage access to the Vantage Room.
October 6, 2026
Duplicate workbook from the Actions menu
Trusted users with Read access can now duplicate Workbench Analyses, Organizer Topics, and Insight Boards directly from the new actions menu located in the toolbar. Copies are saved in the same folder when possible; otherwise, they’re saved in My Folder. The original workbook stays open, and a success message includes Open to open the copy in a new tab.

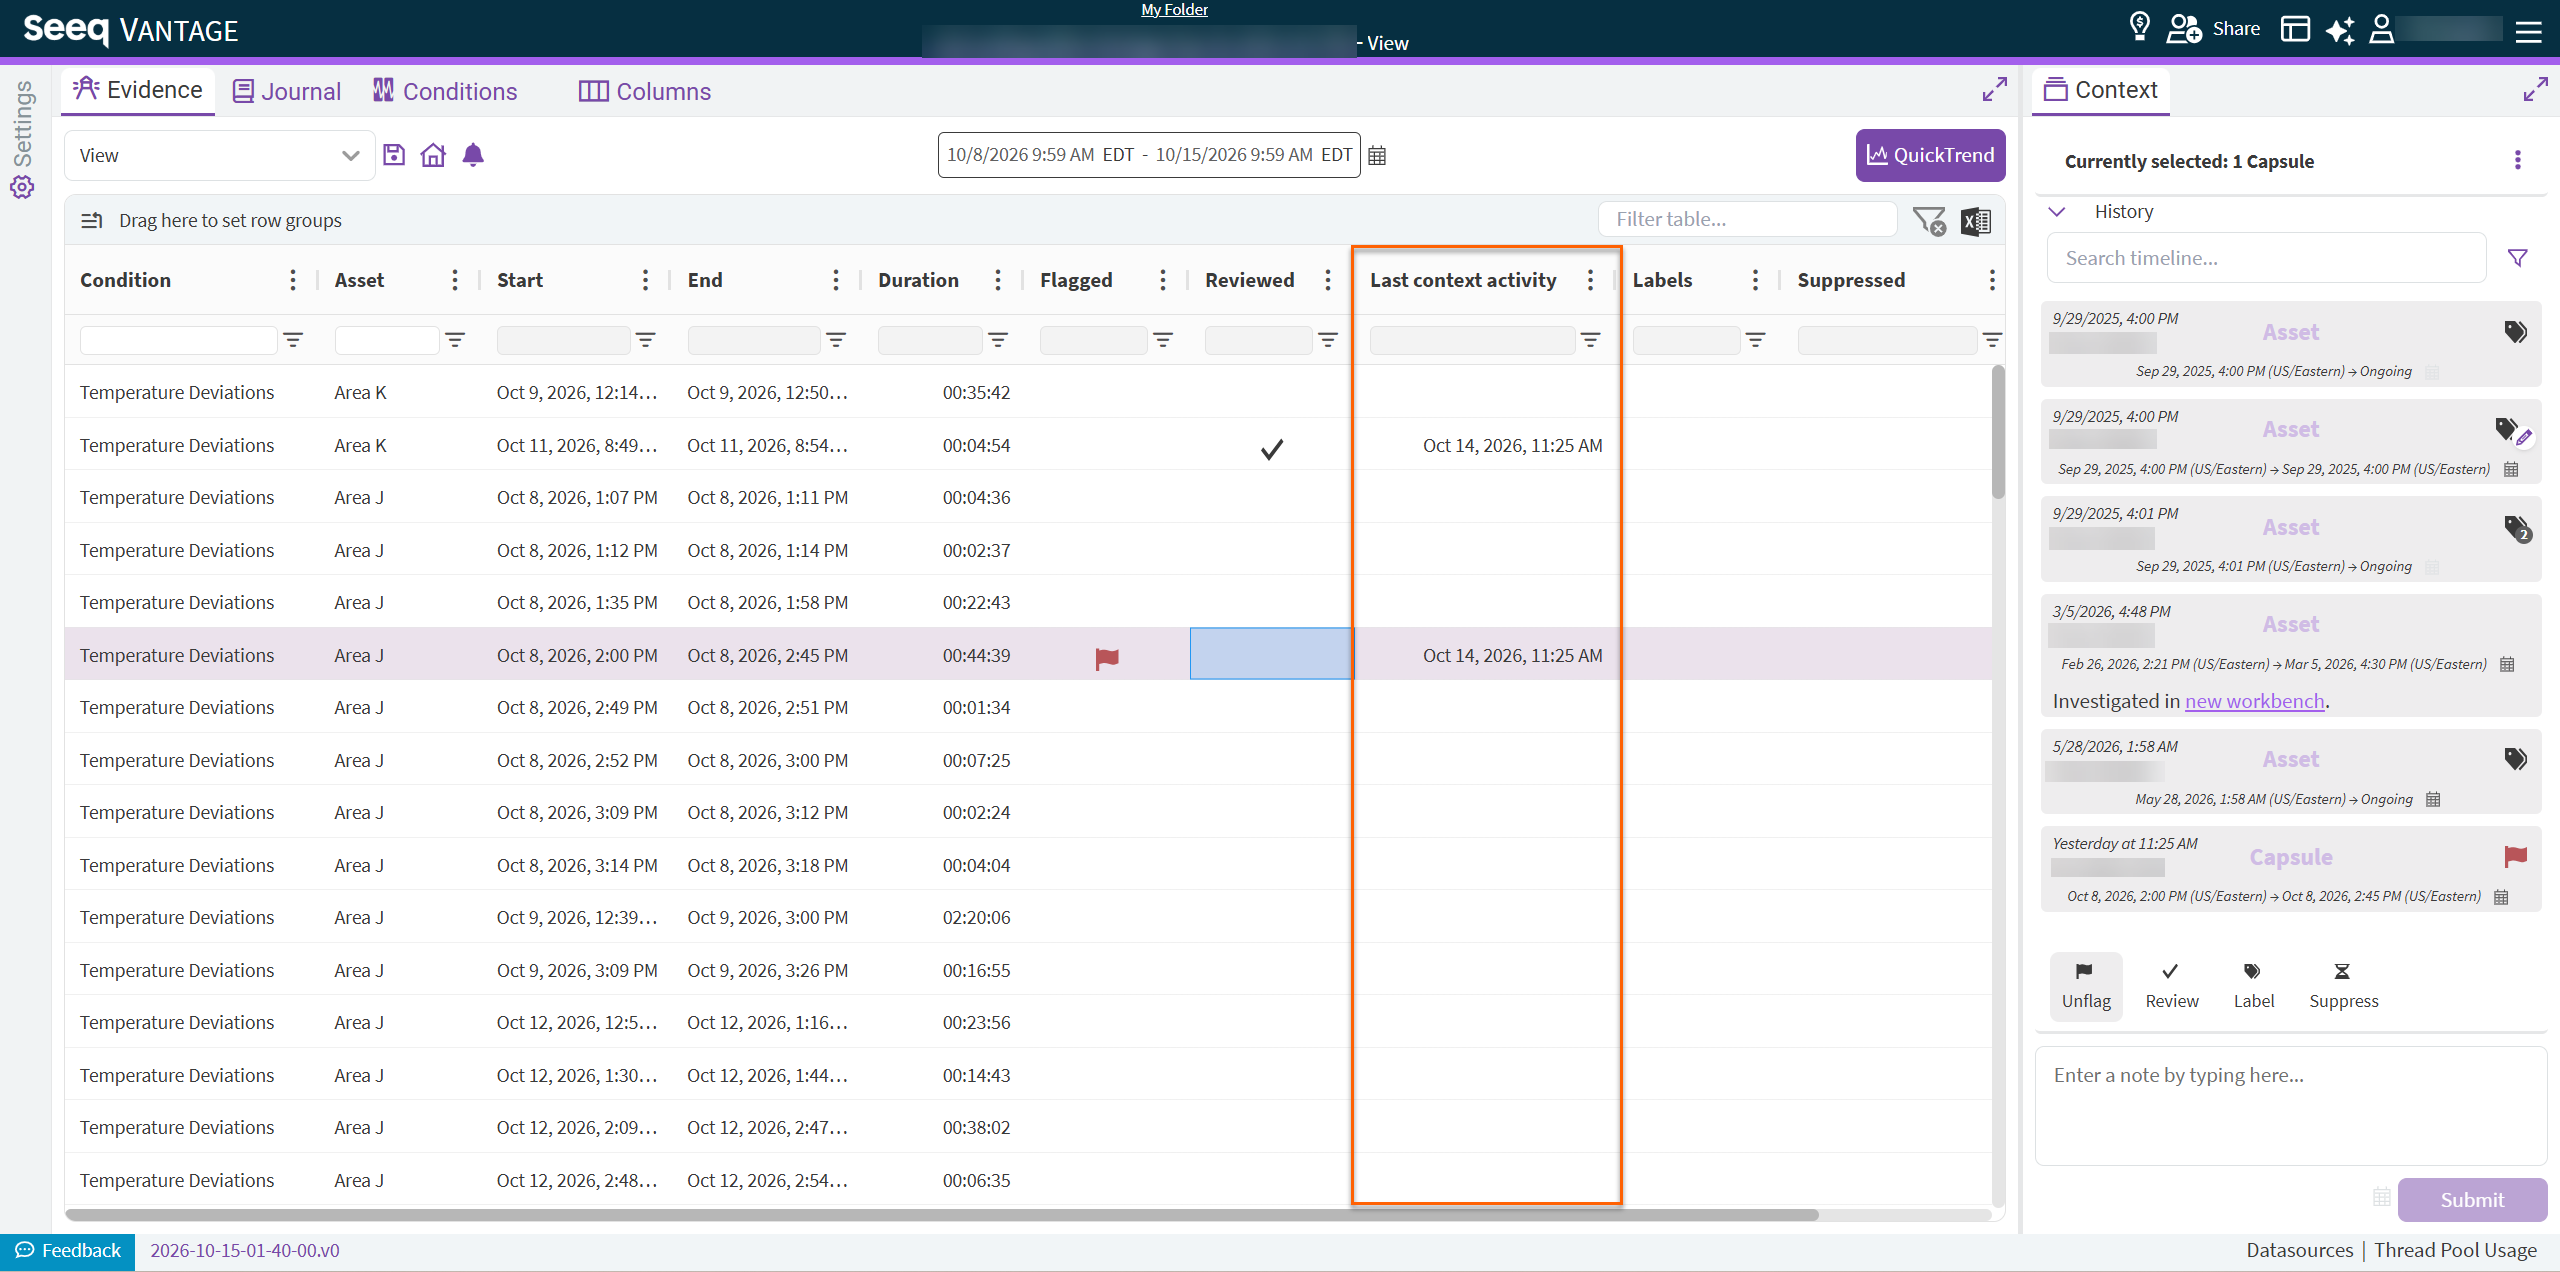
Vantage “Last Context Activity” Column now Available
Vantage now includes another columns: “Last context activity”. This gives you insight, directly in the Evidence table, of when an event was last acted up. This will include notes, labels, flags, reviews and any user-defined context.
September 25, 2026
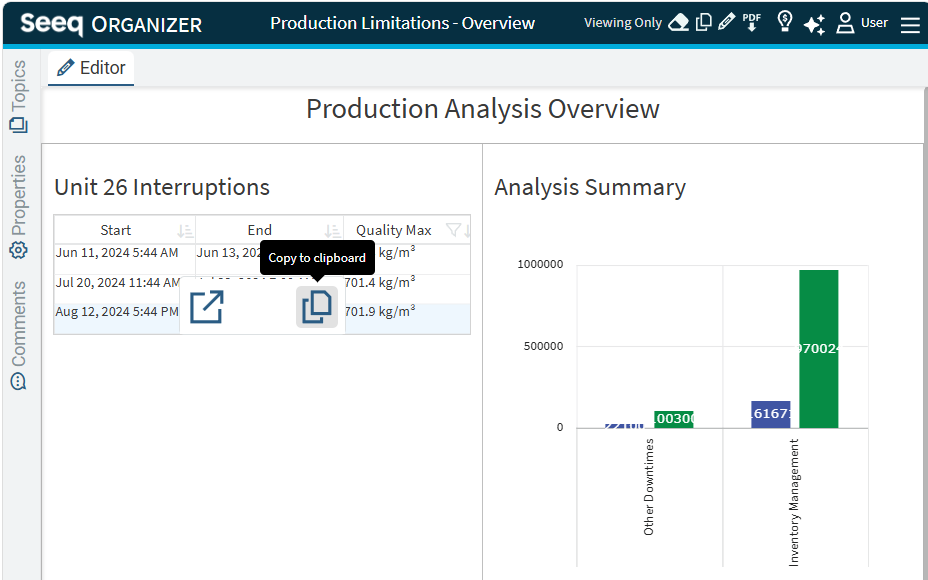
Copy text from Interactive Tables in Organizer
More easily extract information you need with a new copy to clipboard button on all interactive tables in Organizer Topic Documents. This option is available when editing or viewing a Document. Read more on Seeq Organizer | Frequently Asked Questions.
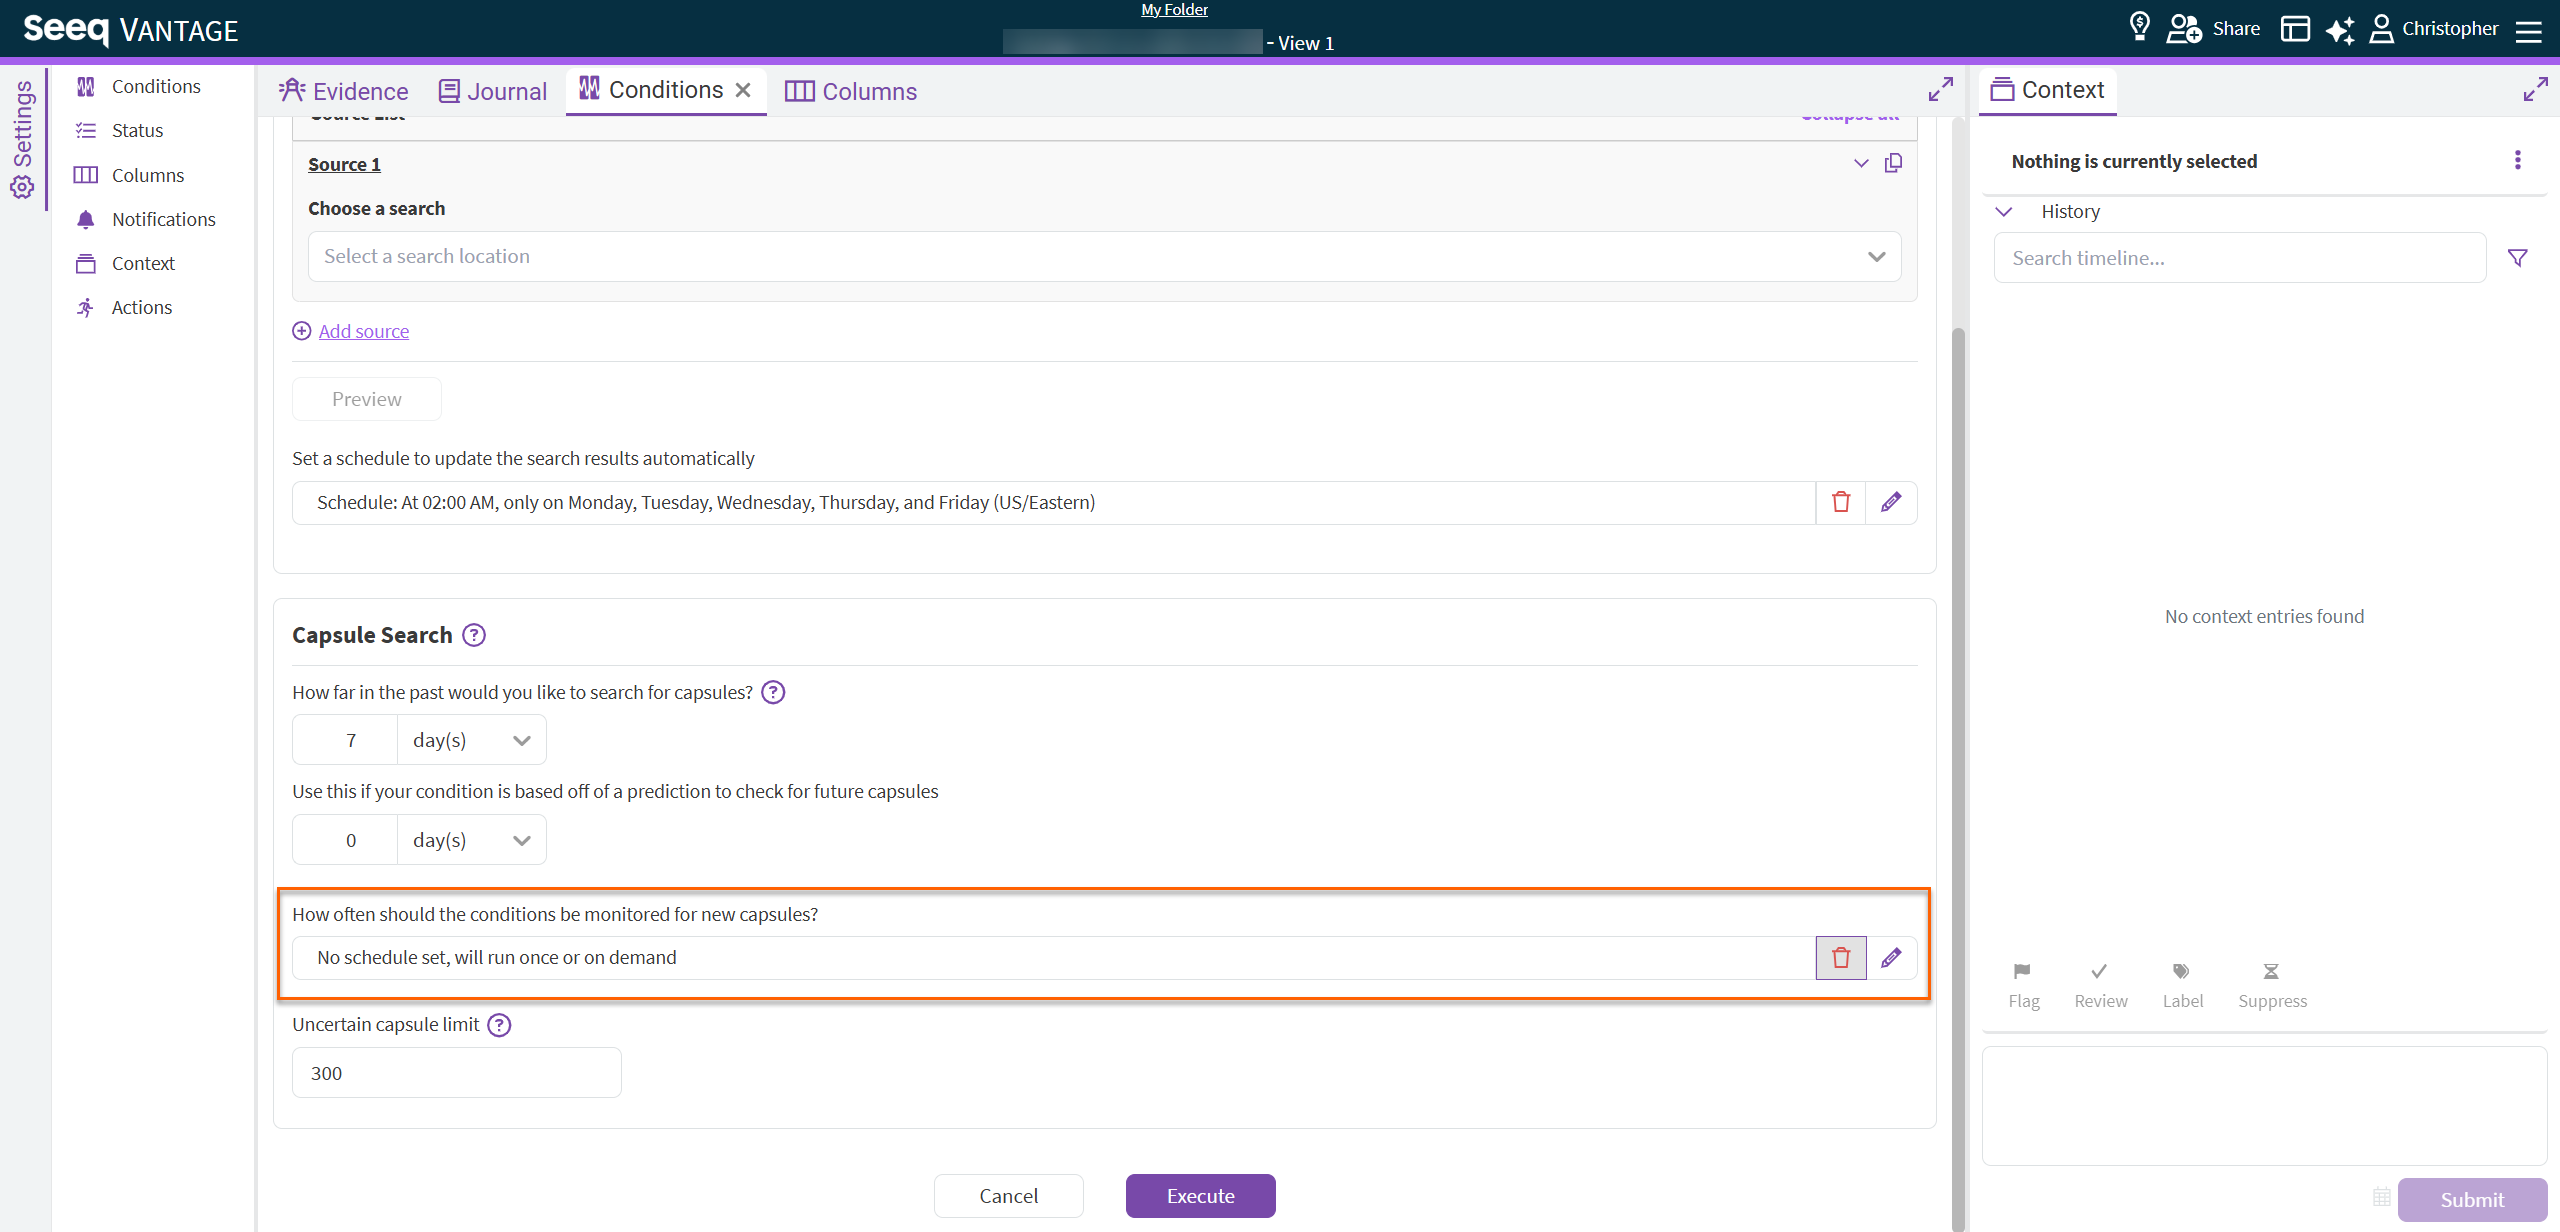
Vantage Execute a Vantage Room search just once, without scheduling
You can know create a Vantage Room, but not set a schedule. This can be leveraged to perform a large search of Capsules for analysis, but not require scheduling a recurring search.
To use, simply click the ‘trash’ icon next to the Capsule Search schedule within the “Conditions” tab in Vantage.
September 22, 2026
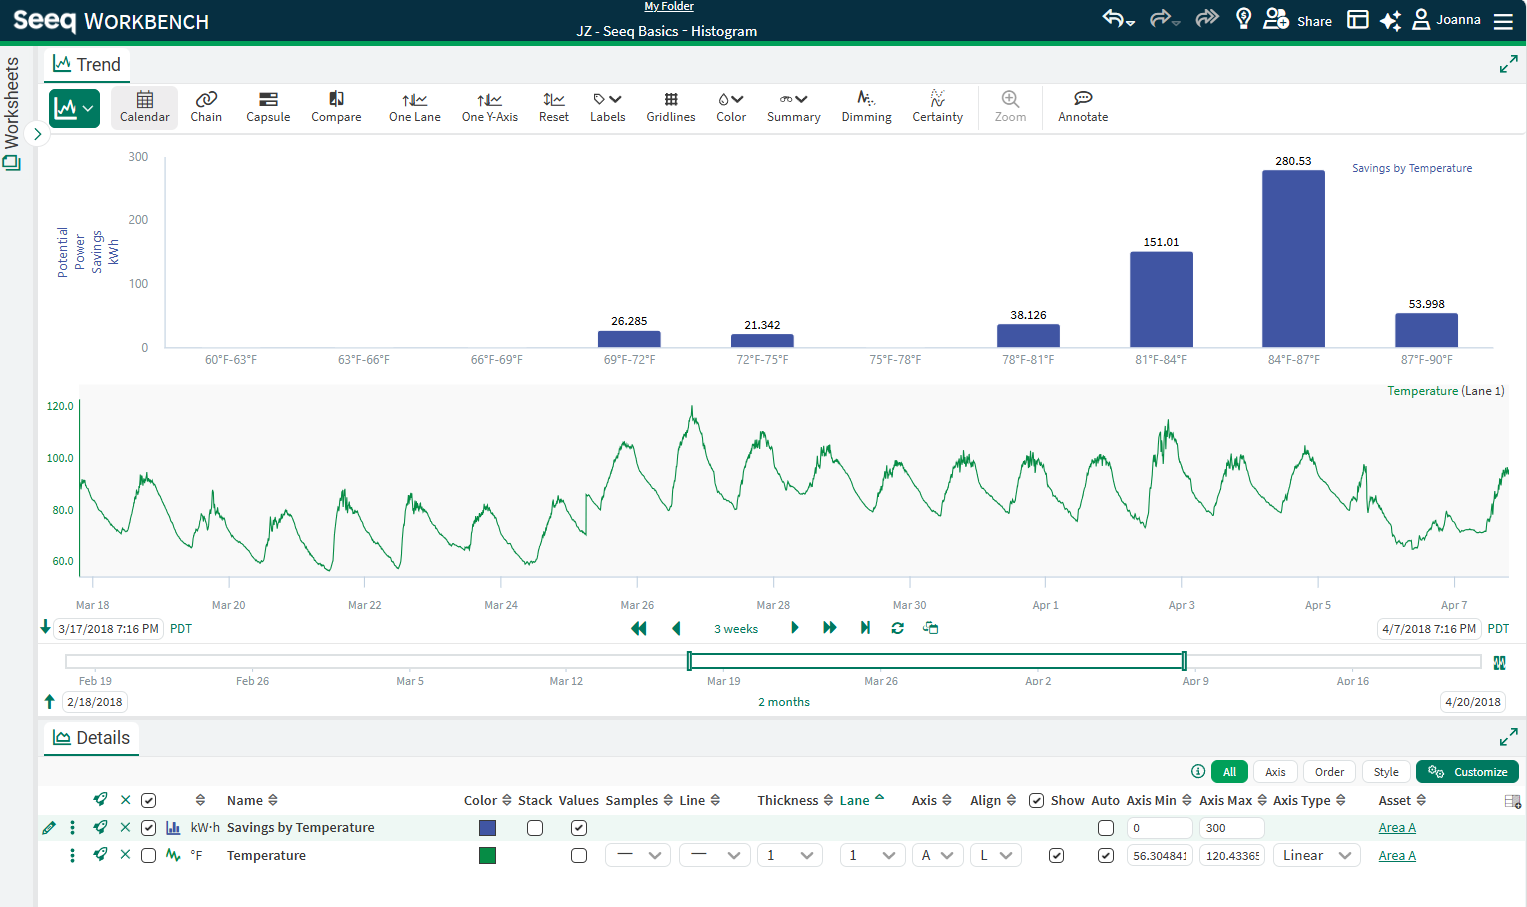
Display values and modify y-axis for Histogram
Visualizations created with the Histogram tool have new configuration in the Details Pane. Open the Customize menu to toggle values on and optionally override the min or max value for the y-axis. Read more inHistogram | Customizations:.
September 21, 2026
Operationalize Statistics: Sustain the gains with Seeq!
The built-in statistics toolset now helps you keep the gains from your improvement projects alive, connected, and actionable.
With this update, you can:
-
Operationalize an established Statistics summary.
-
Apply a Statistics summary to another asset with a similar signal.
-
Automate process capability, equal means, and equal variance calculations at a set frequency.
-
Set up notifications or configure a Vantage room to receive instant alerts when a run rule is violated, signaling that your process may be shifting significantly.
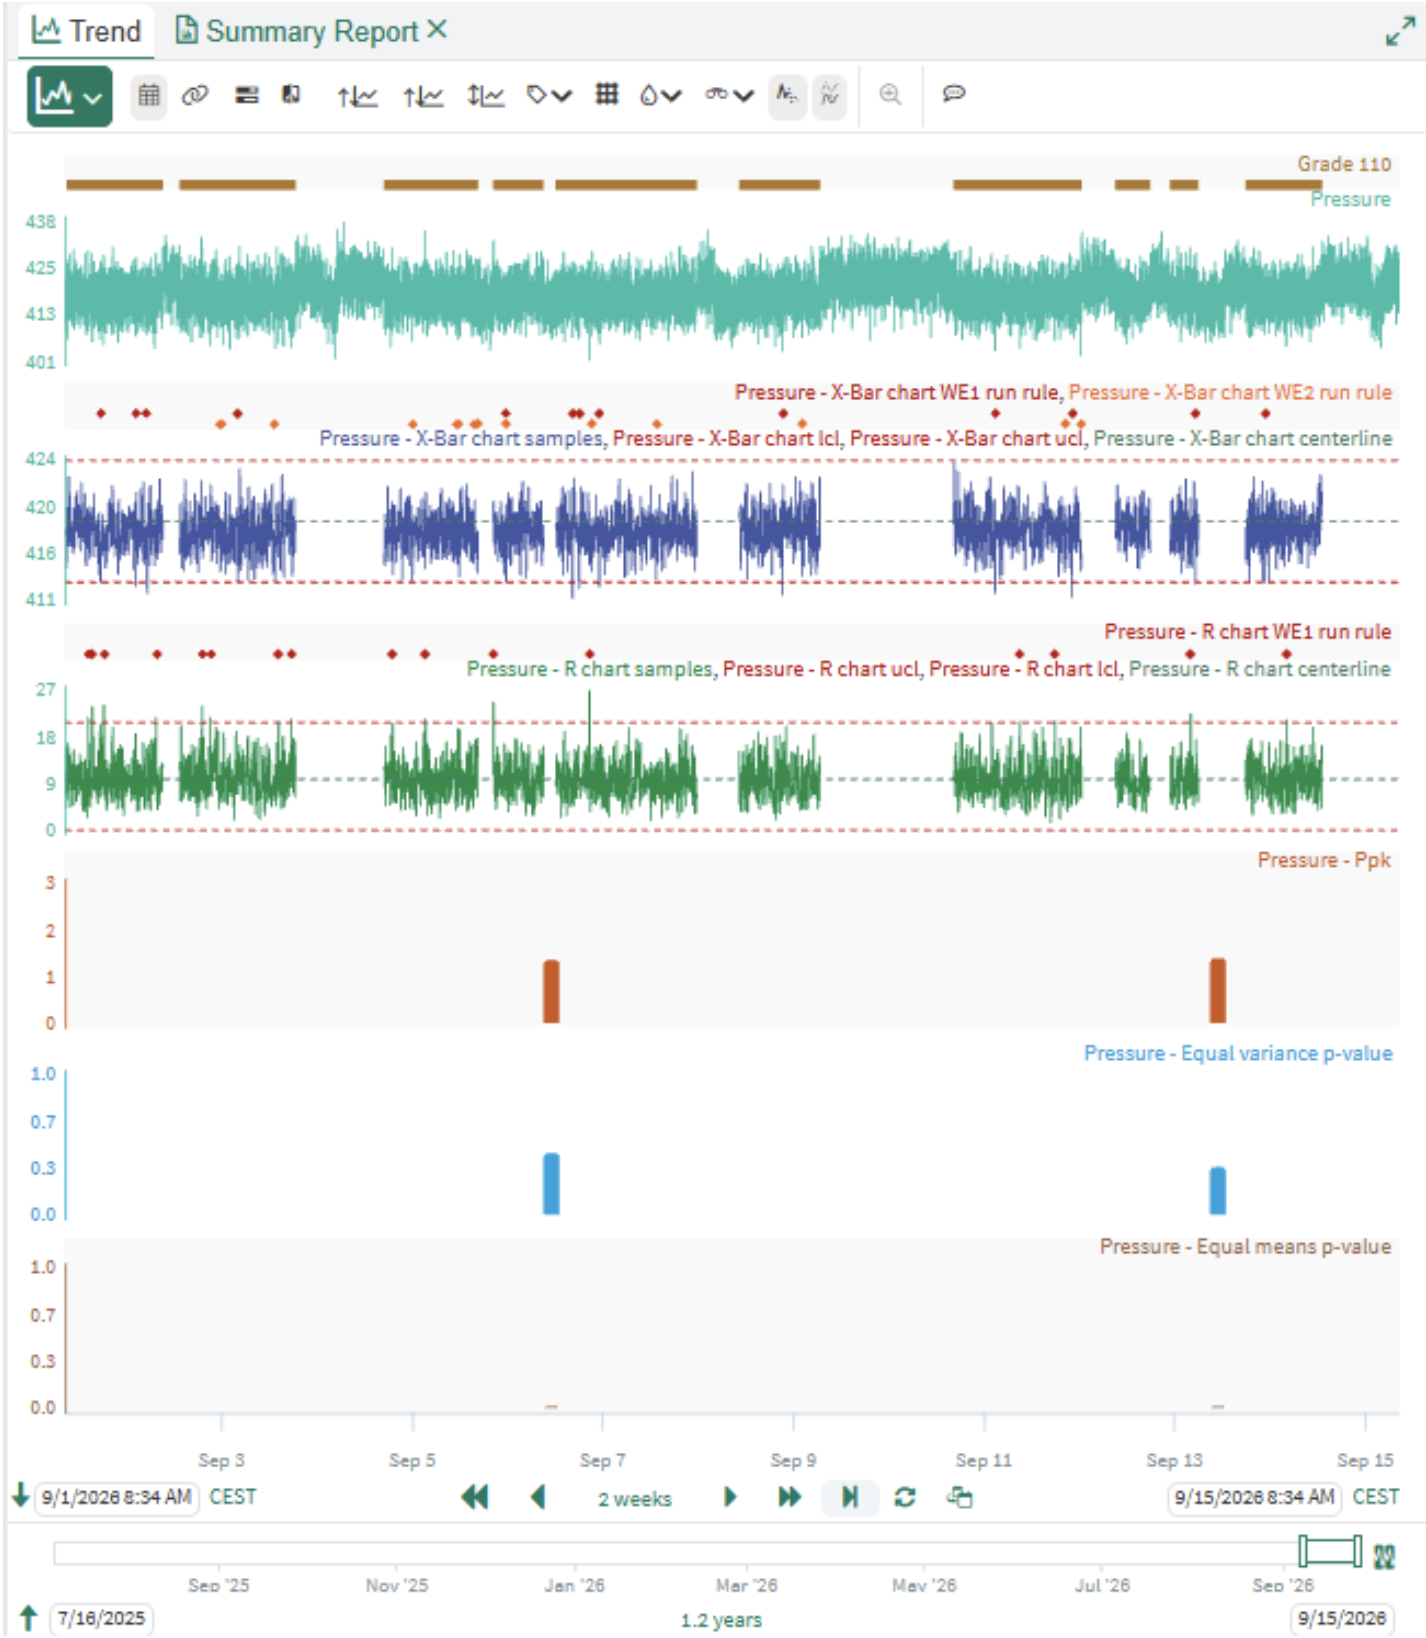
No more manual data exports just to check for issues - you'll get a timely indication when your process capability is at risk.
Want to learn more? Check out the Knowledge Base.
September 11, 2026
Vantage: Notify on new events
Notifications can now be configured directly in Seeq Vantage to send you, or your team, an email when new Capsules that match your View or filters are detected.
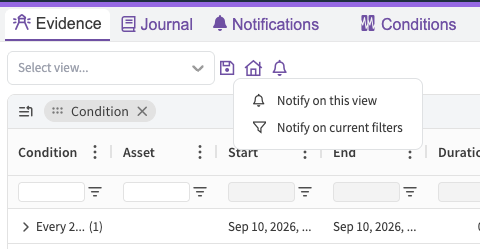
Each notification be reviewed and edited in the Notifications tab. The email will also contain an optional list of events by adding “columns to include in the email”, as well as customized message.
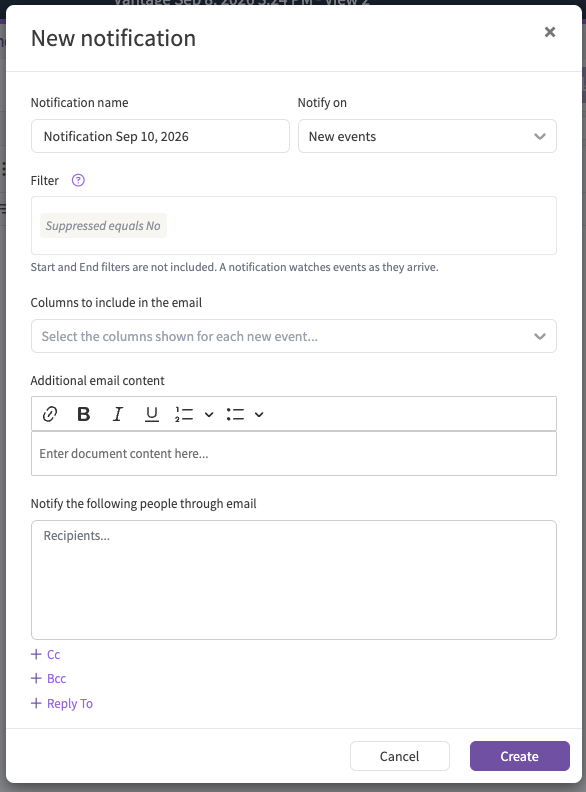
Want to learn more? Check out the Knowledge Base.
August 26, 2026
Vantage: Reason Code Management
Reason codes now have a built-in management experience from within Vantage. Create and edit reason code hierarchies directly from the Vantage Room, assign a hierarchy to the whole Room or to specific conditions, and import an existing hierarchy from a CSV or JSON file. Each assigned hierarchy gets its own button in the Context Pane, and its levels appear as columns in the Evidence Table.
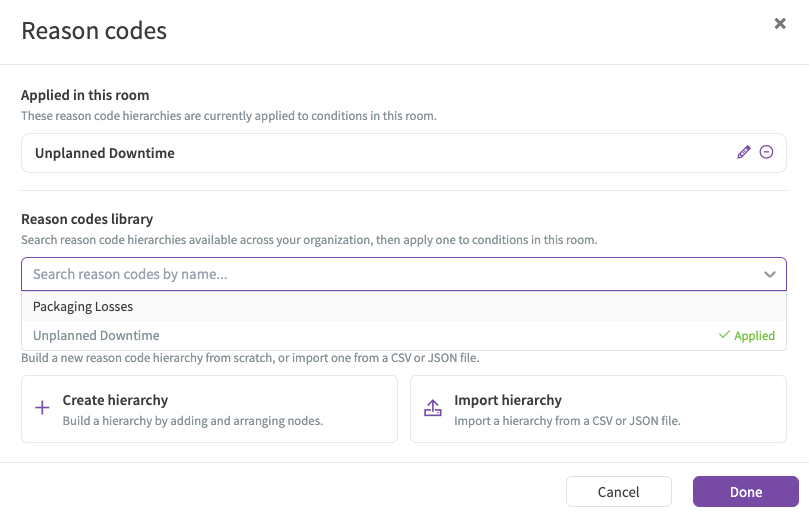
Rooms that set up reason codes through the Data Lab script are migrated automatically: hierarchies are created from the existing trees, and all applied reason codes and history are preserved. The Data Lab script is no longer needed.
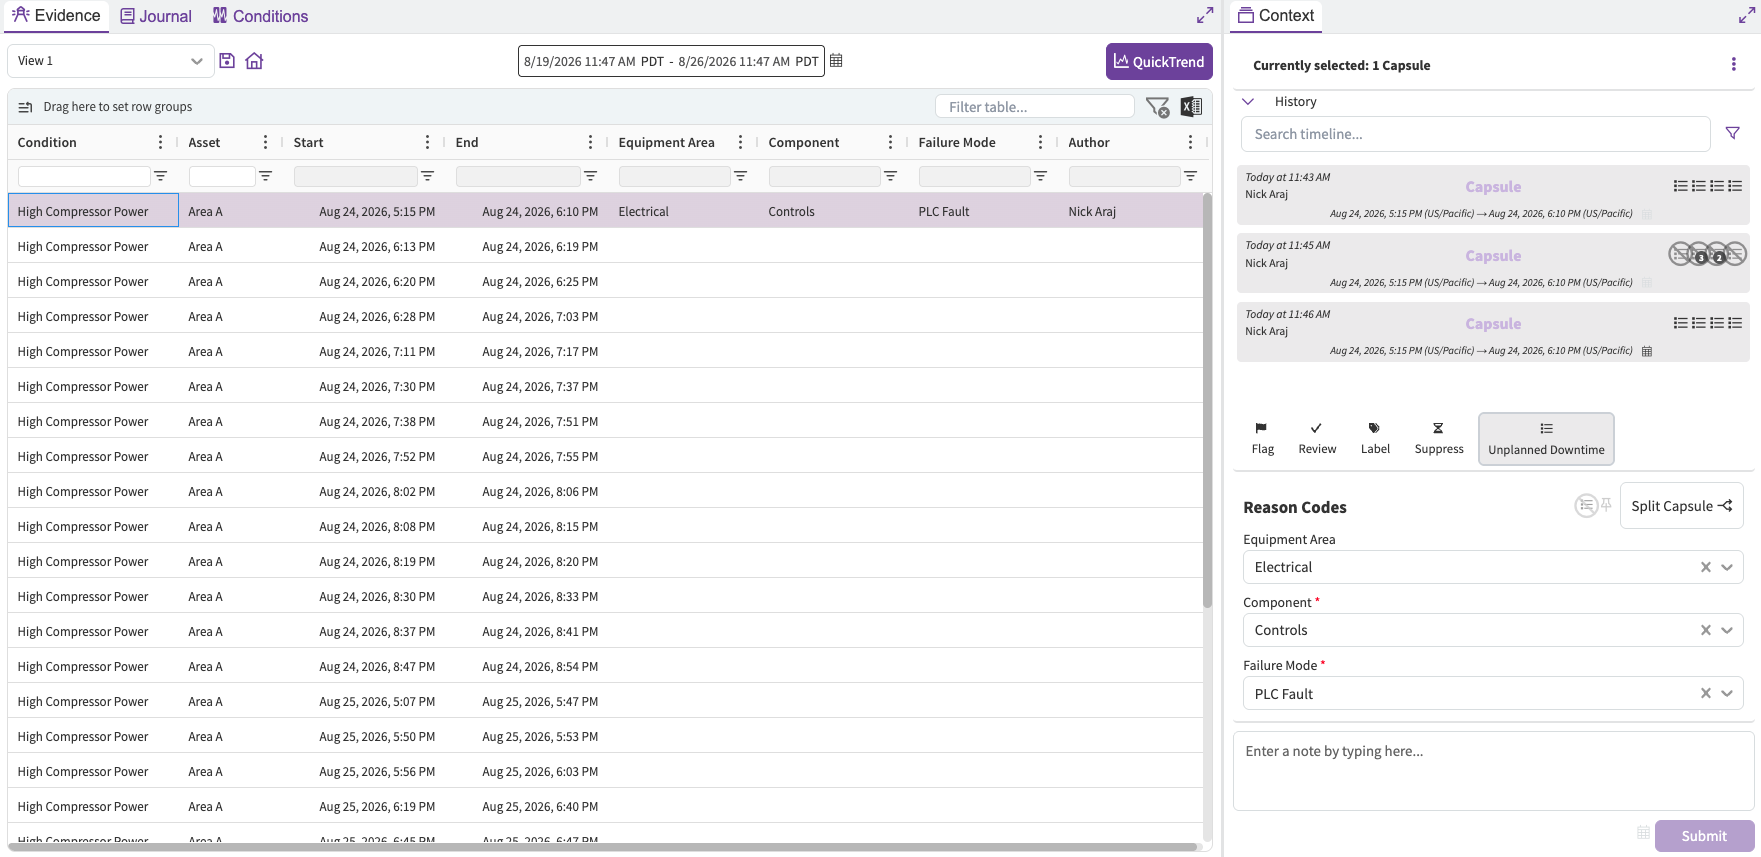
Want to learn more? Check out the Knowledge Base.
August 21, 2026
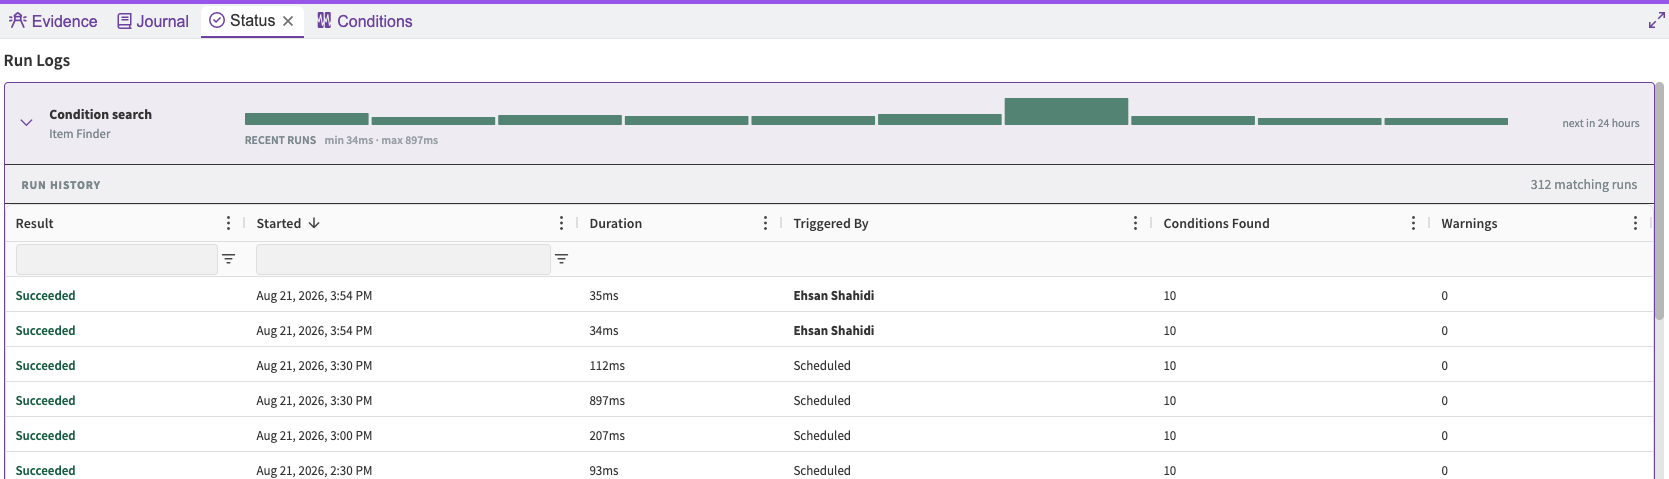
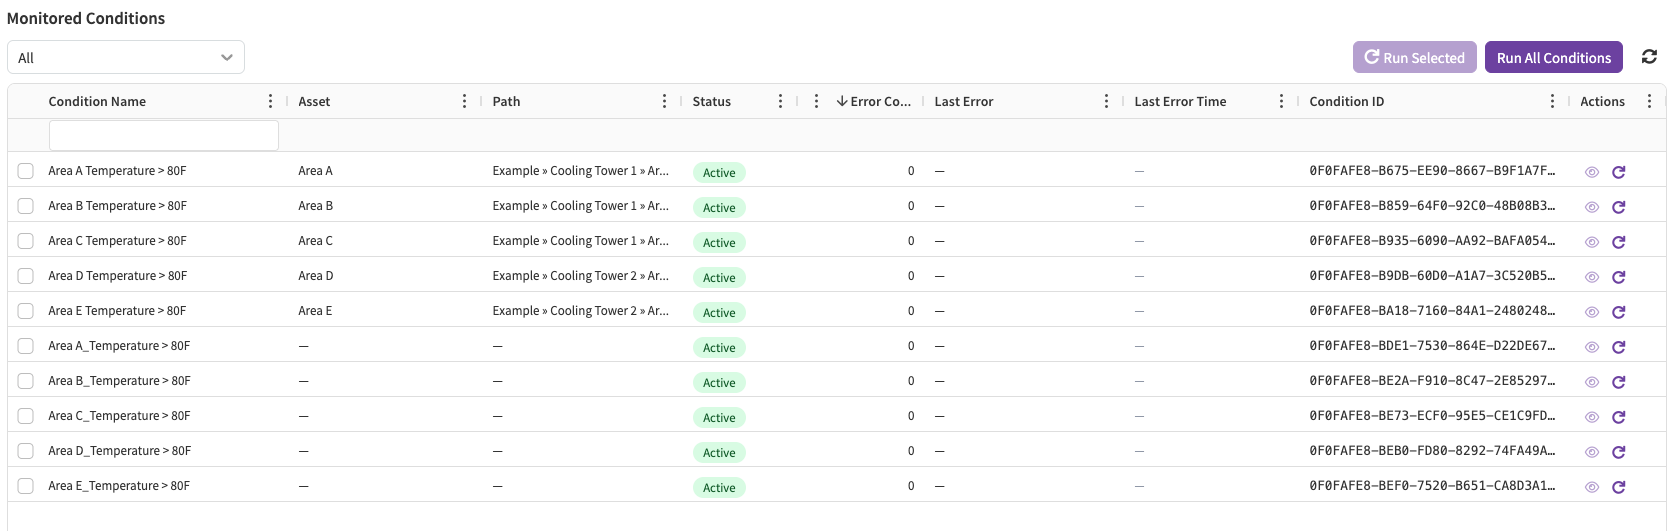
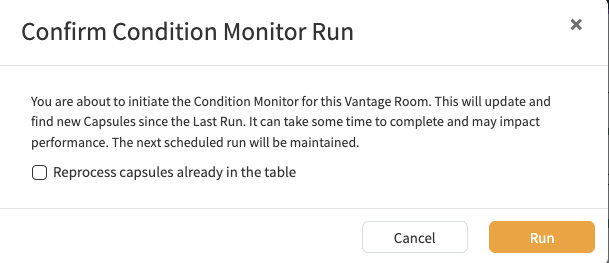
Vantage: Run Logs and Re-runs in the Status Tab
The Status tab shows logs of recent condition search and capsule search runs, along with upcoming scheduled runs. It also lists monitored conditions, which you can re-run manually—individually or all at once. Note: the Vantage Room manual capsule search re-run has moved from the Conditions tab to the Status tab, where you can now run it for specific conditions as well.
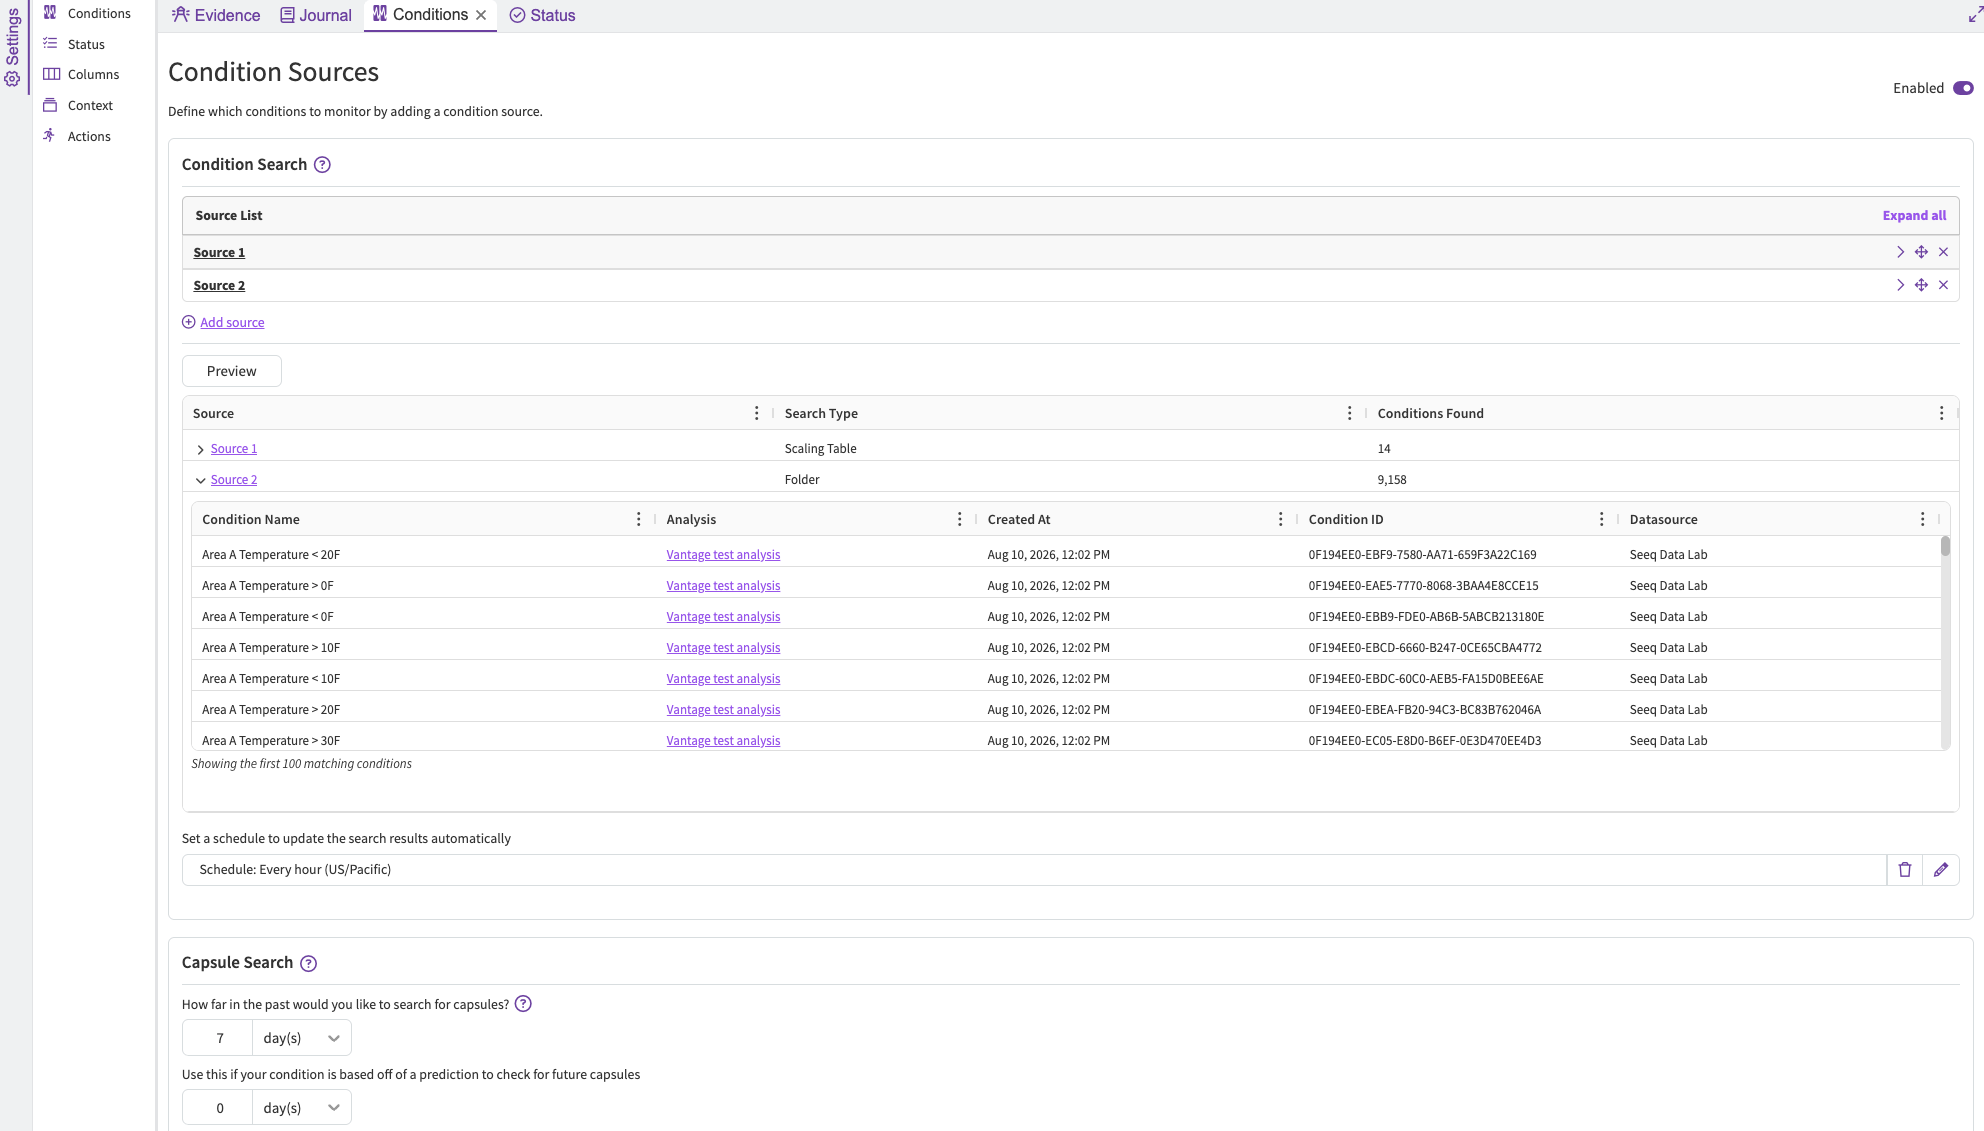
Vantage: Condition Search Preview
Vantage setup now offers an optional additional step to preview the Condition Search results before scheduling the monitoring job. The preview includes the count and a subset of 100 conditions per search.
August 20, 2026
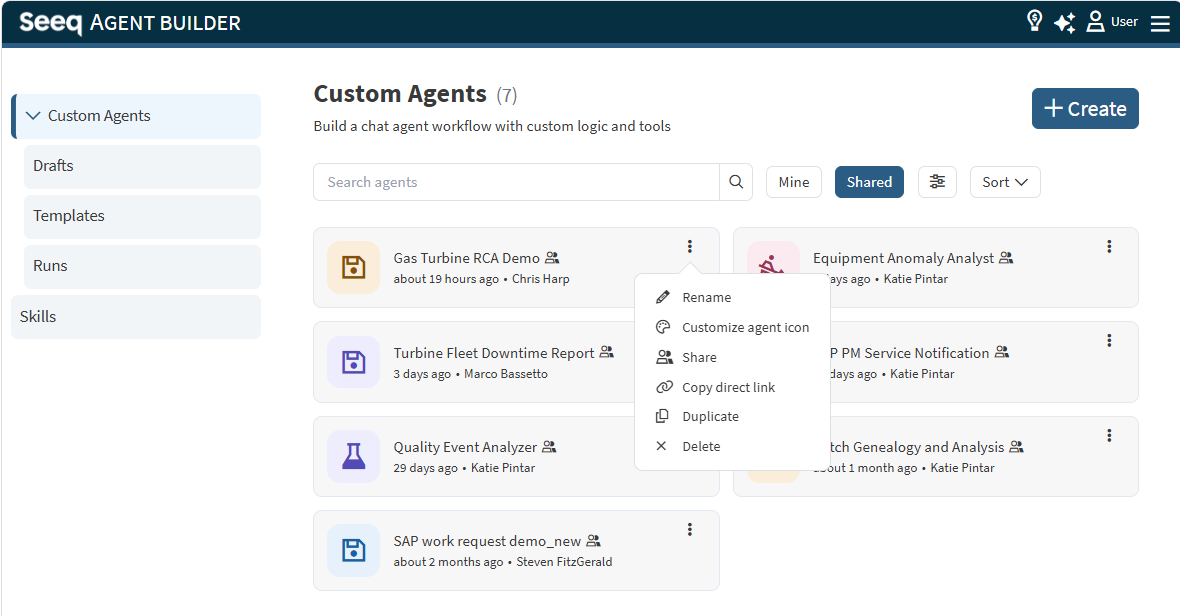
Customize color and icon of Custom Agents
Do you want to differentiate between custom agent more easily? Now you can configure the color and icon of the box next to a custom agent. This can be updated next to the title of any custom agent when making modifications, or from the menu on a custom agent you have write access to on the Agent Builder landing page.
August 19, 2026
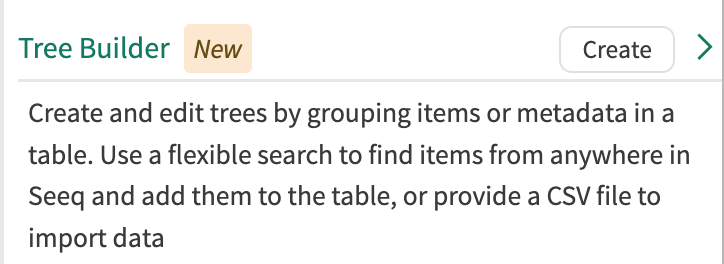
Tree Builder is now Generally Available for Enterprise Customers!
Tree Builder helps teams improve data discovery and scalability of calculations by enabling users to create, manage, and leverage trees in Seeq with a no-code experience.
With Tree Builder, you can:
-
Build multi-level trees from signals, scalars, and conditions
-
Add criticial metadata like asset name, location, equipment type, manufacturer, and friendly names as a few examples through rules, CSV import, or manual entry
-
Organize data with flexible, rule-based logic that accommodates differences in naming and structure
-
Share new trees across your team or organization, including global tables when appropriate
-
Streamline data discovery in Workbench and use those same trees in Scaling Tables to scale analytics
-
Keep your structure current by automatically including new items with scheduled searching
Want to learn more? Check out the Knowledge Base.
August 18, 2026
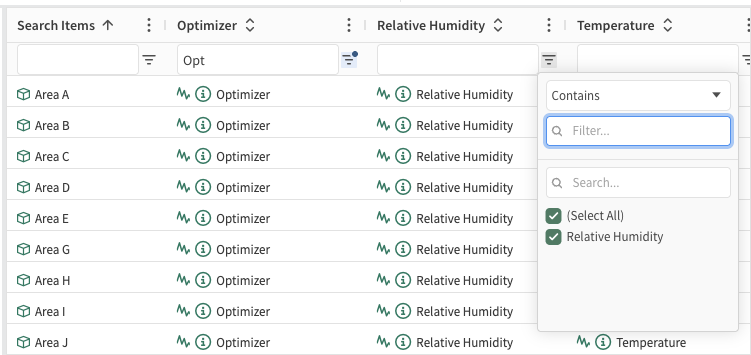
Scaling Table Filters
Columns in a Scaling Table can now be filtered to easily find relevant rows.
July 28, 2026
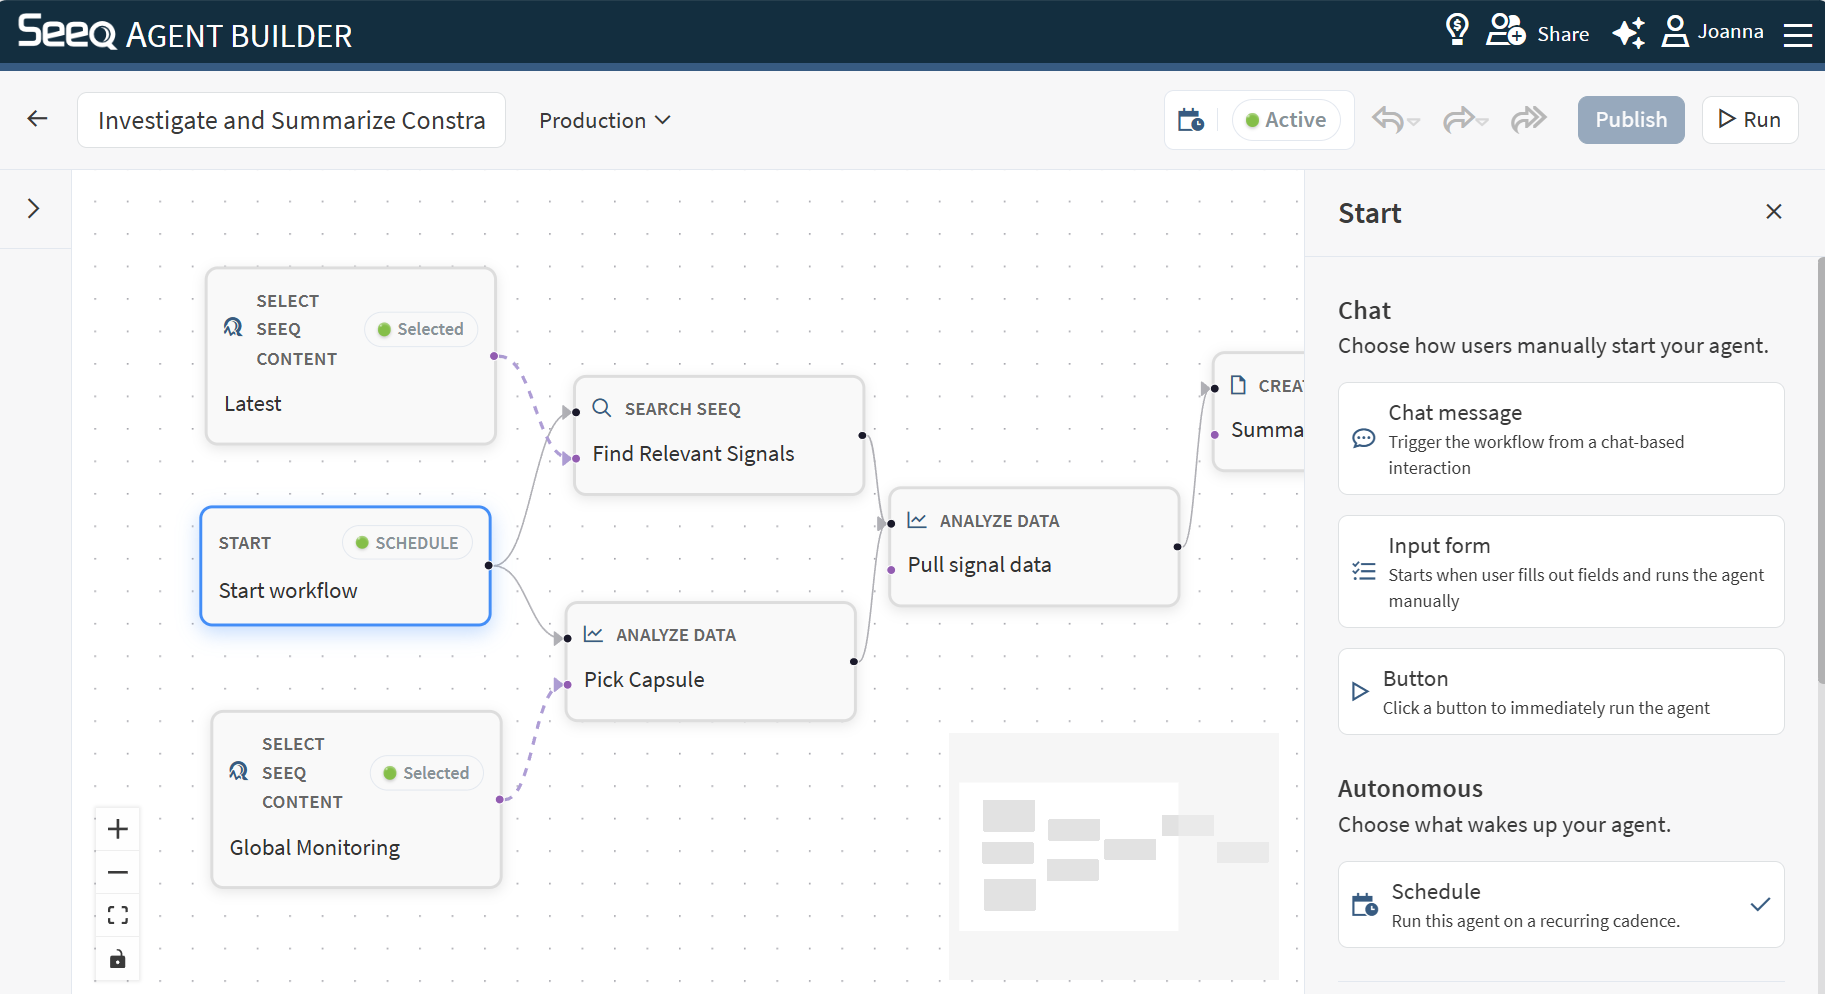
Scheduled Custom Agents
Custom Agents in Agent Builder can run autonomously to update and deliver reports, add context to events in Vantage, or execute any workflow you design. Use the Schedule start trigger to configure automated custom agents. Read more at Start Node .
July 27, 2026
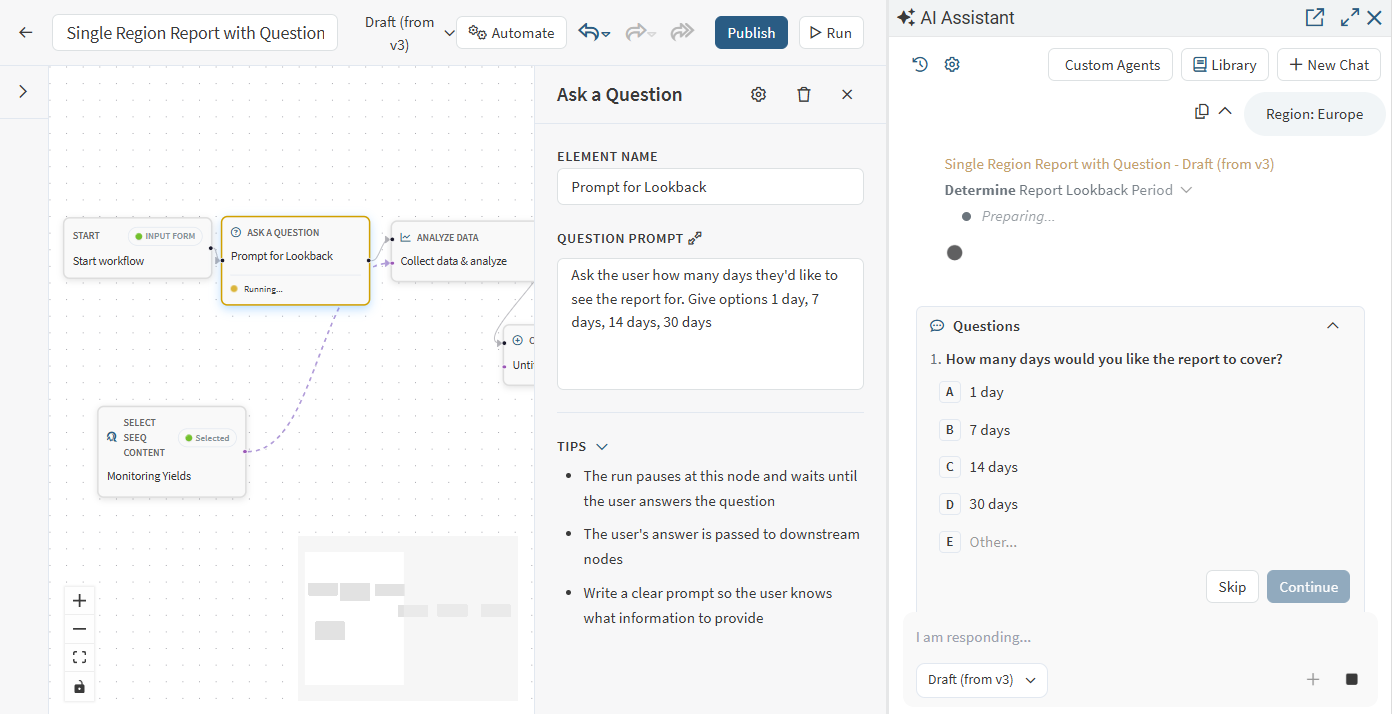
Custom Agents can engage users for input
A Question Node is available in Core nodes in Agent Builder so that interactive workflows that benefit from direct user feedback can specify how that is gathered and what is done with that information. Use this to clarify which or how much data is used for the interaction with the custom agent, select between various summary options, or collect information to store for later review. See Question Node for more information.
July 15, 2026
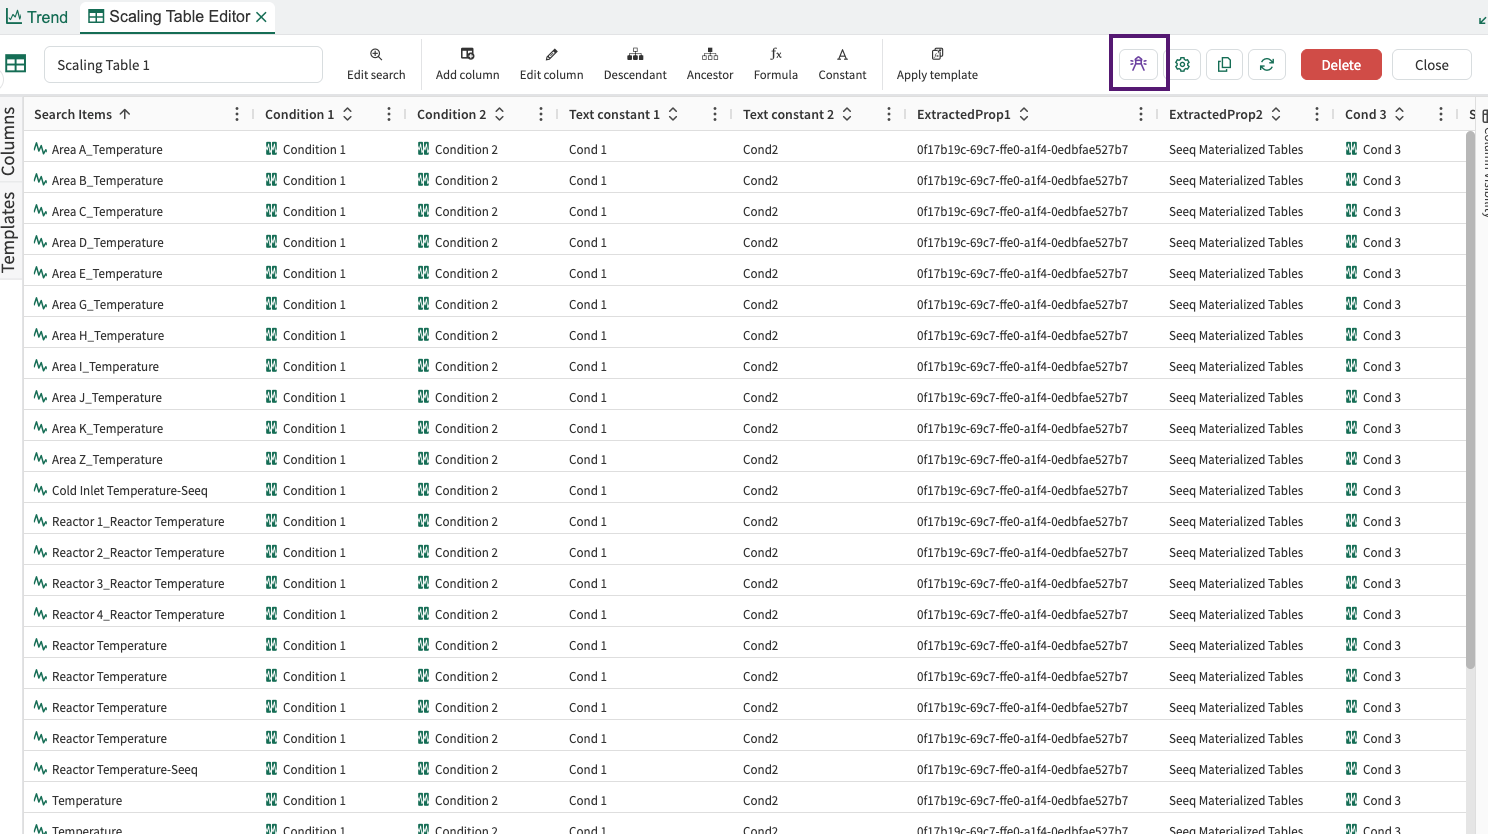
Monitoring a Scaling Table in Vantage
You may select the “Monitor in Vantage” button next to Scaling Table settings buttons:
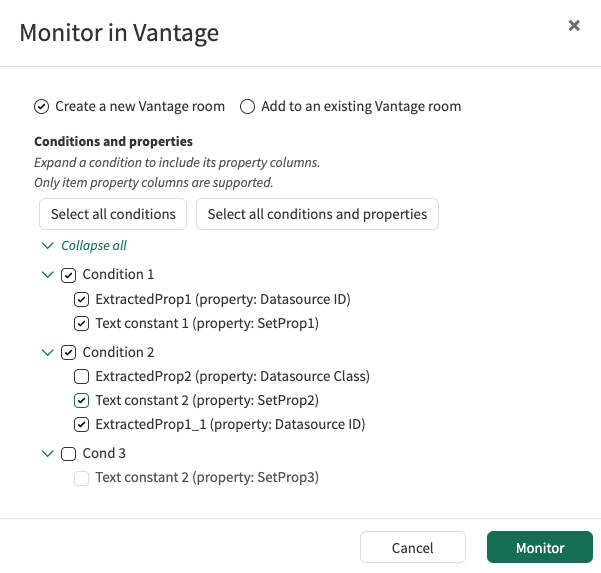
This will open a modal where you will be able to select the condition columns to monitor, and the property columns to add to a new or existing Vantage Room. Clicking Monitor opens Vantage where you can modify and run your desired monitoring job.
June 25, 2026
Enrich Vantage events with Agent Q
Agent Builder’s Add Vantage Context step now allows custom agents to add comments, numeric values, and labels to Vantage events. When a Vantage room is linked directly, available context types are automatically discovered. For more information, see Add Vantage Context.
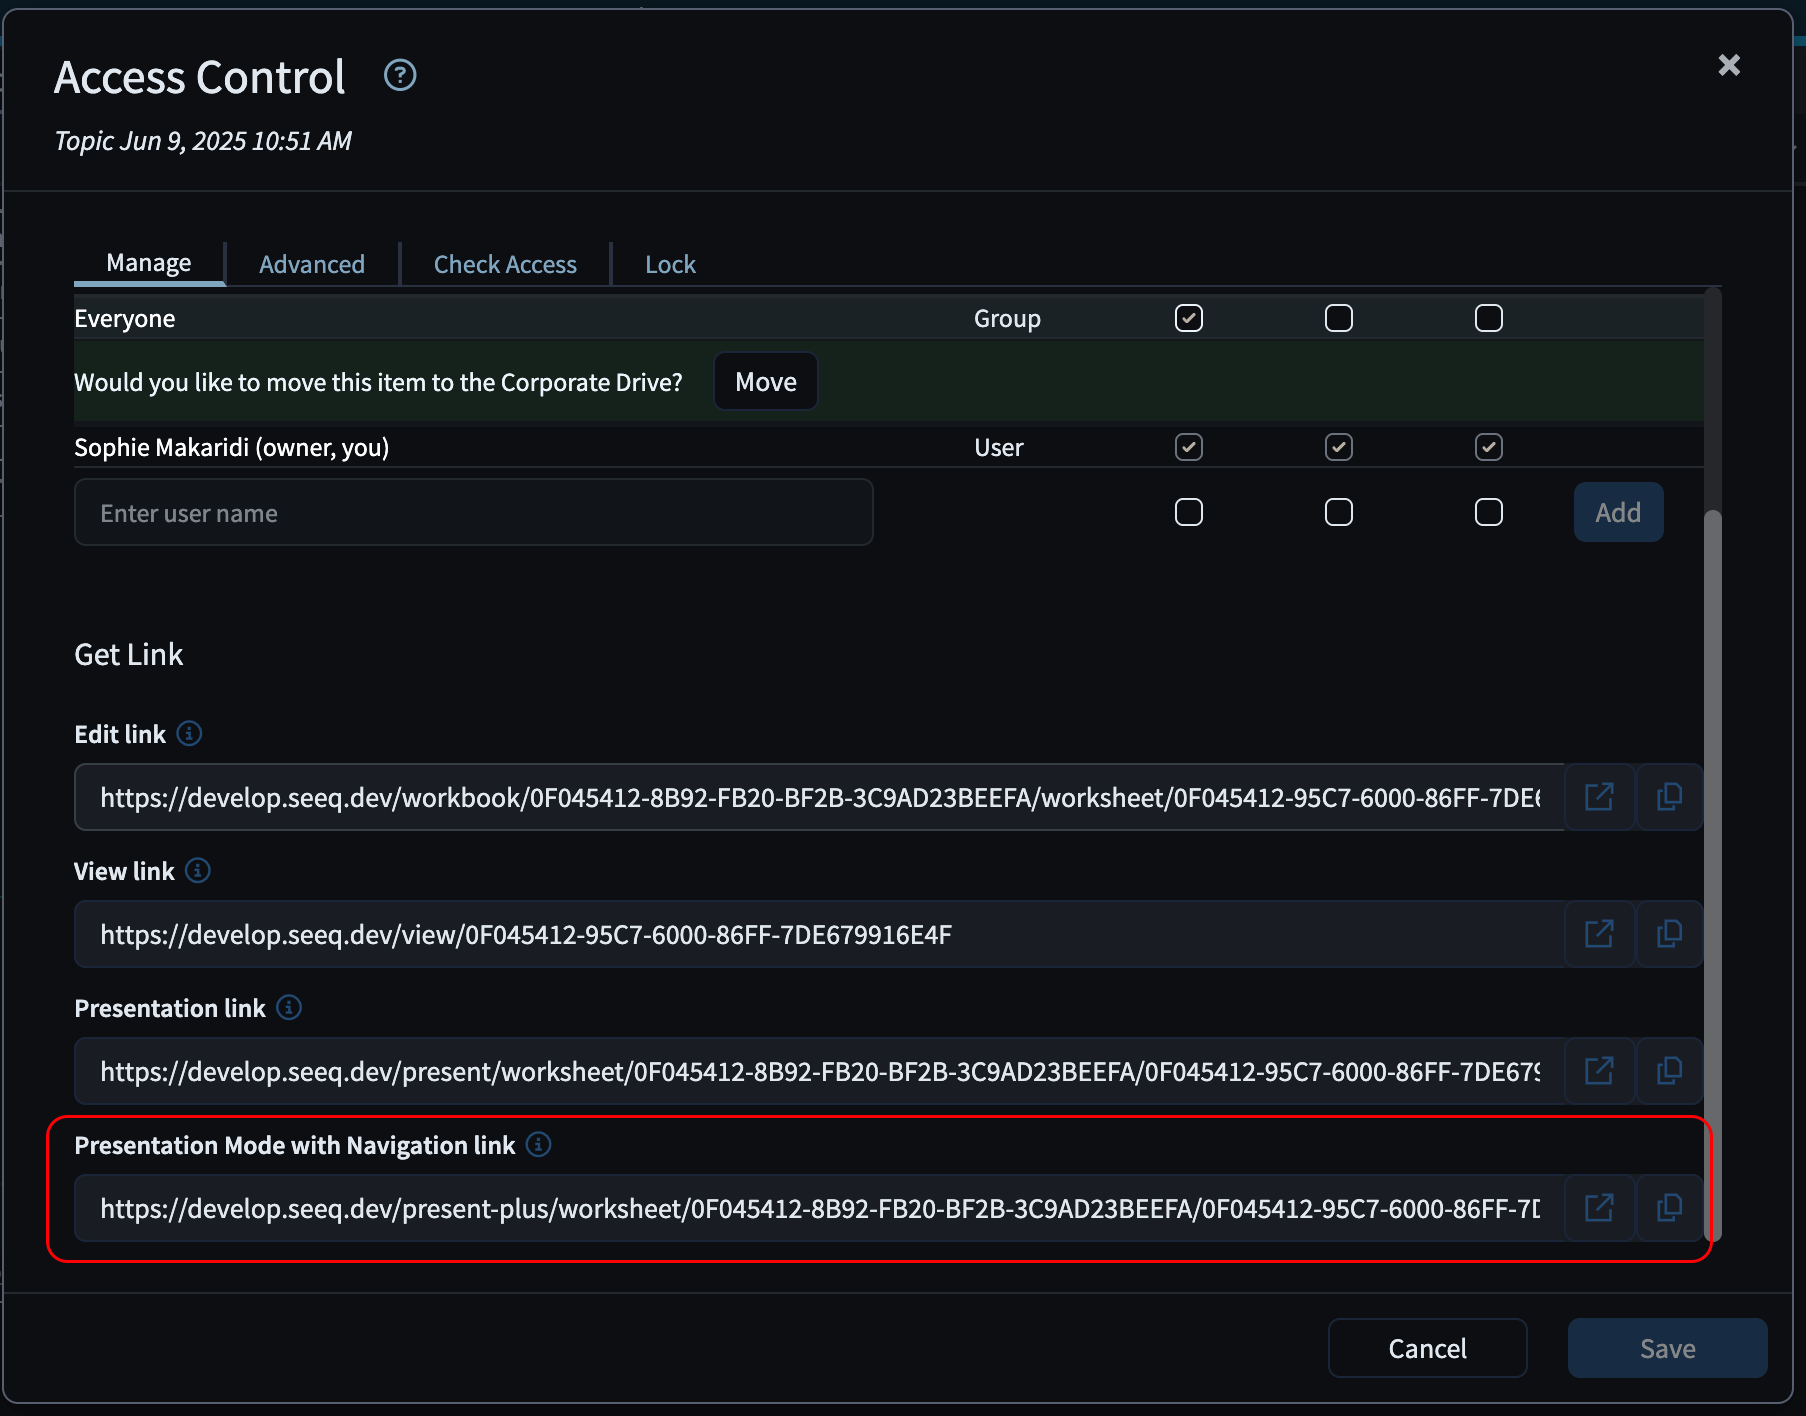
Presentation Mode with Navigation
You can now share Organizer Topics and Workbench Analyses in a new way.
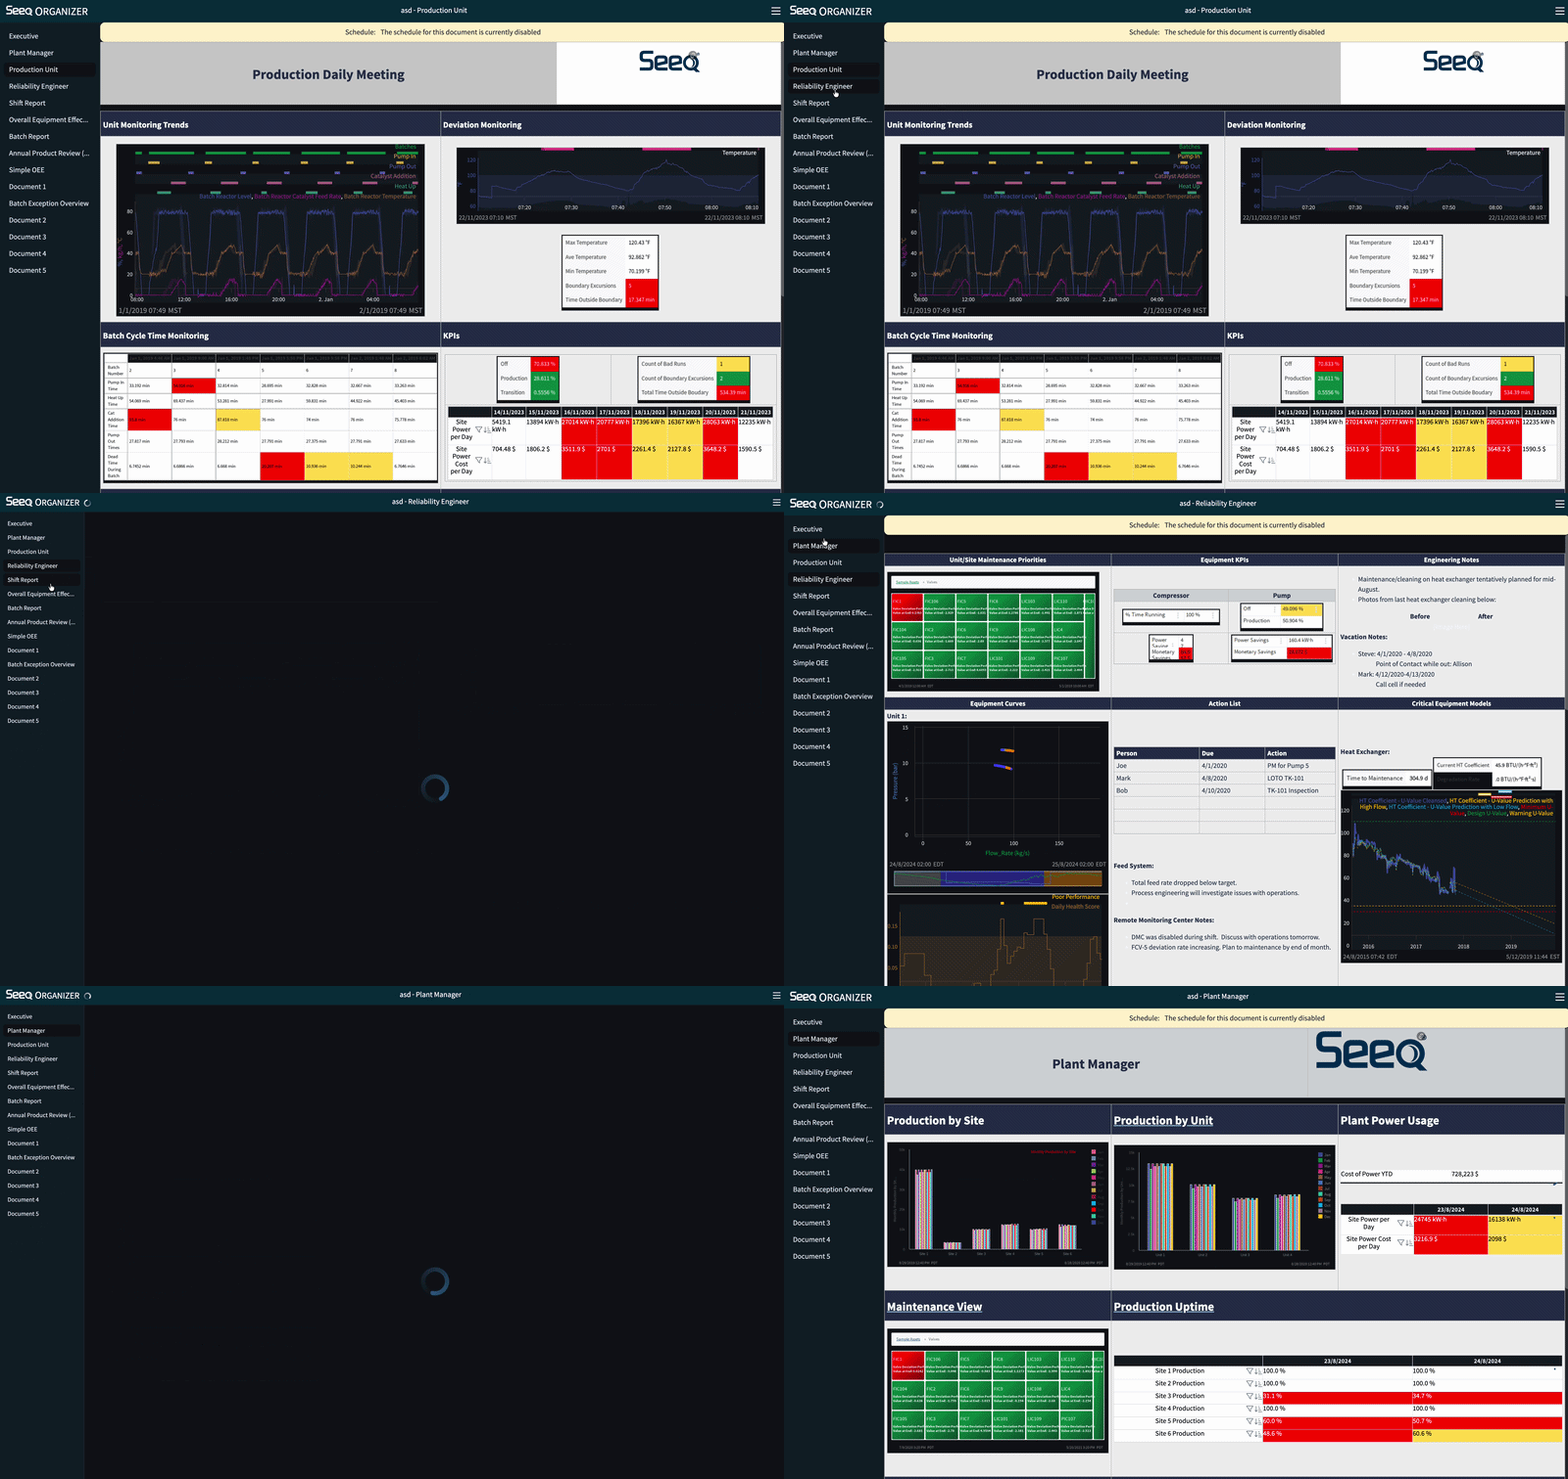
Clicking the “Presentation Mode with Navigation” link opens the sheet in a presentation view with a navigable sidebar, making it easy to move through the content and switch between different sheets without additional setup.
Date Format Preference
Users can now choose how numeric dates are displayed in Seeq from User Preferences. Select Browser default, MM/DD/YYYY, DD/MM/YYYY, YYYY-MM-DD, or DD.MM.YYYY without changing browser or operating system language settings. The existing 24h format setting continues to control time of day. For more information, see User Profile and Preferences.
June 18, 2026
Home Screen Update
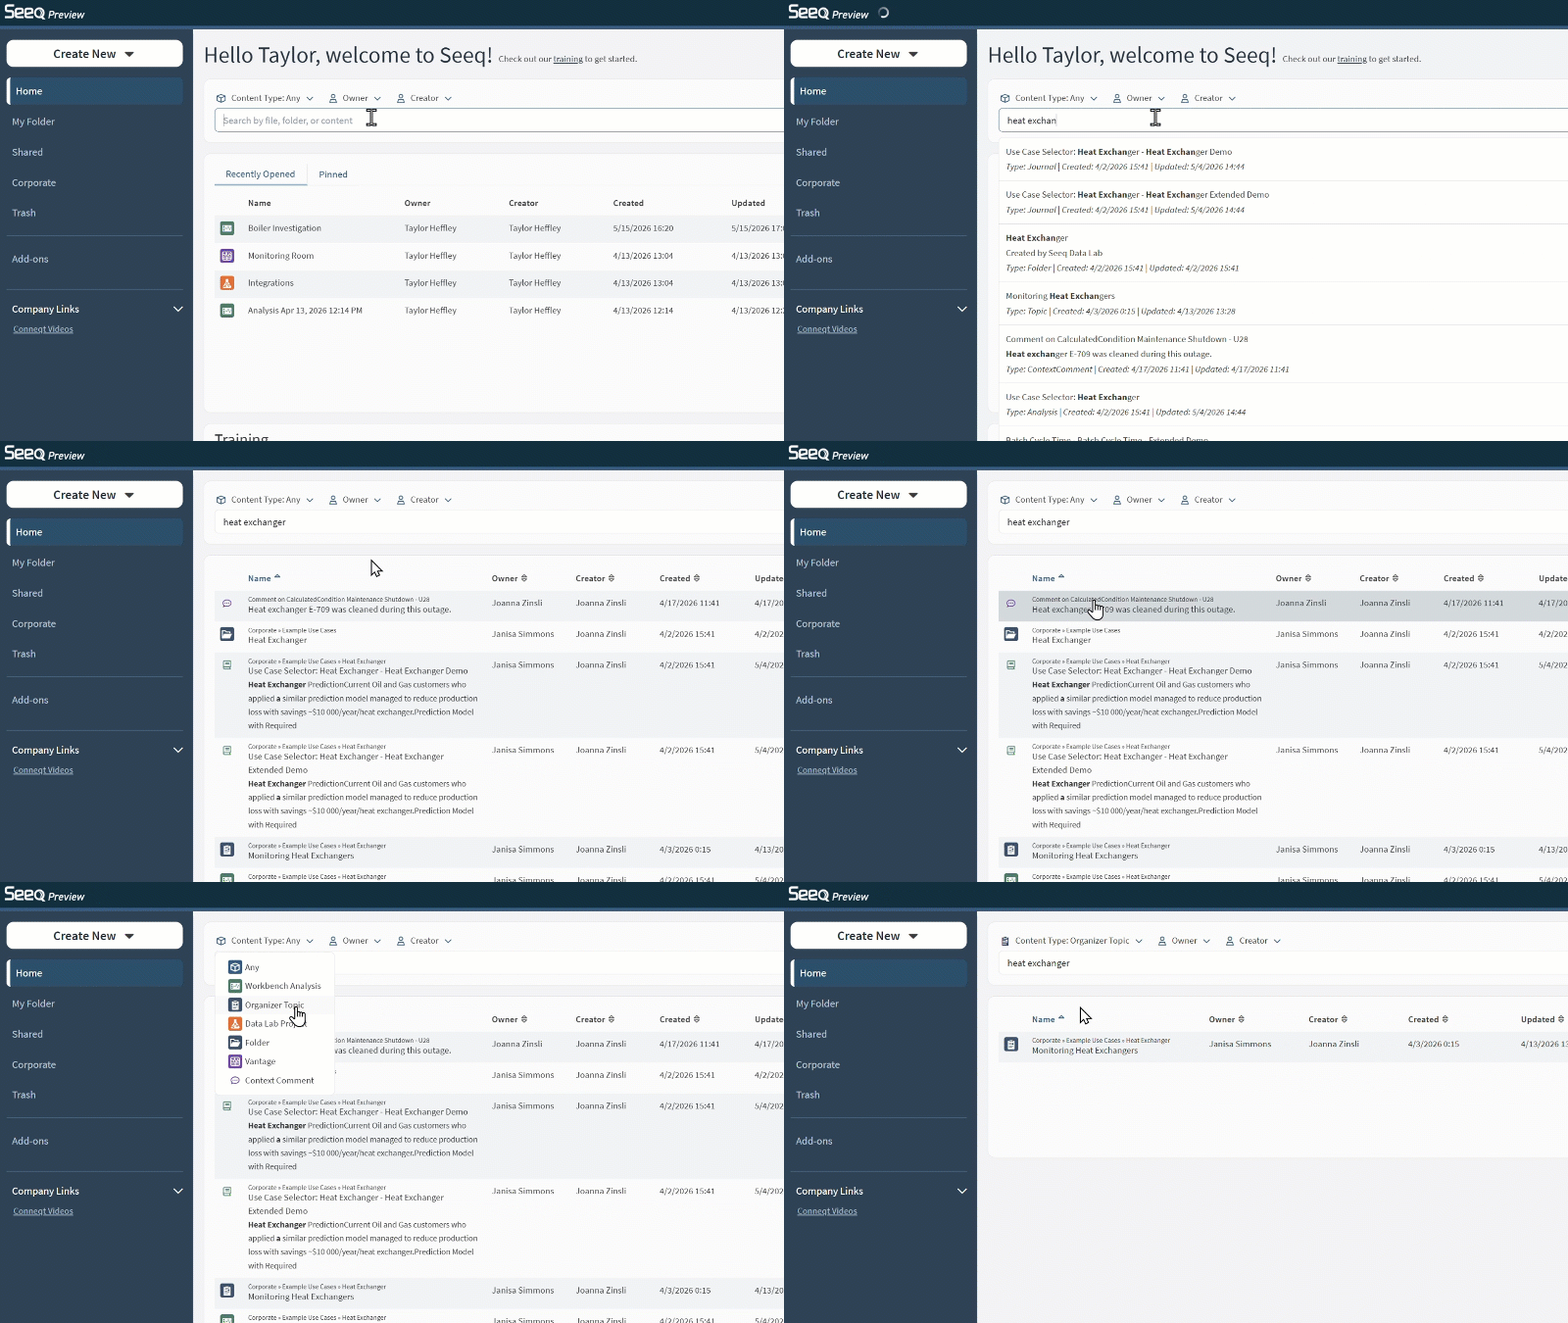
With this update, you can get started quickly, surface relevant content more easily, and navigate your work with greater speed and flexibility.
-
Find helpful resources through the new Training section on Home.
-
Search faster with improved performance and recommended results.
-
Narrow results with quick filters above the search bar.
-
Limit searches to My Folder, Shared, Corporate, or a particular subfolder.
See the updates in a quick video.
Read more in the Knowledge Base.
Scaling Table Navigation
When navigating a scaling table in the Data Pane you can now enable a tree view, by toggling “Expand”. This allows you to browse the rows of the Scaling Table with the same hierarchical view that was used to populate it.
For more information on using it, see Scaling Tables
June 1, 2026
Scale Best Practices with Templates
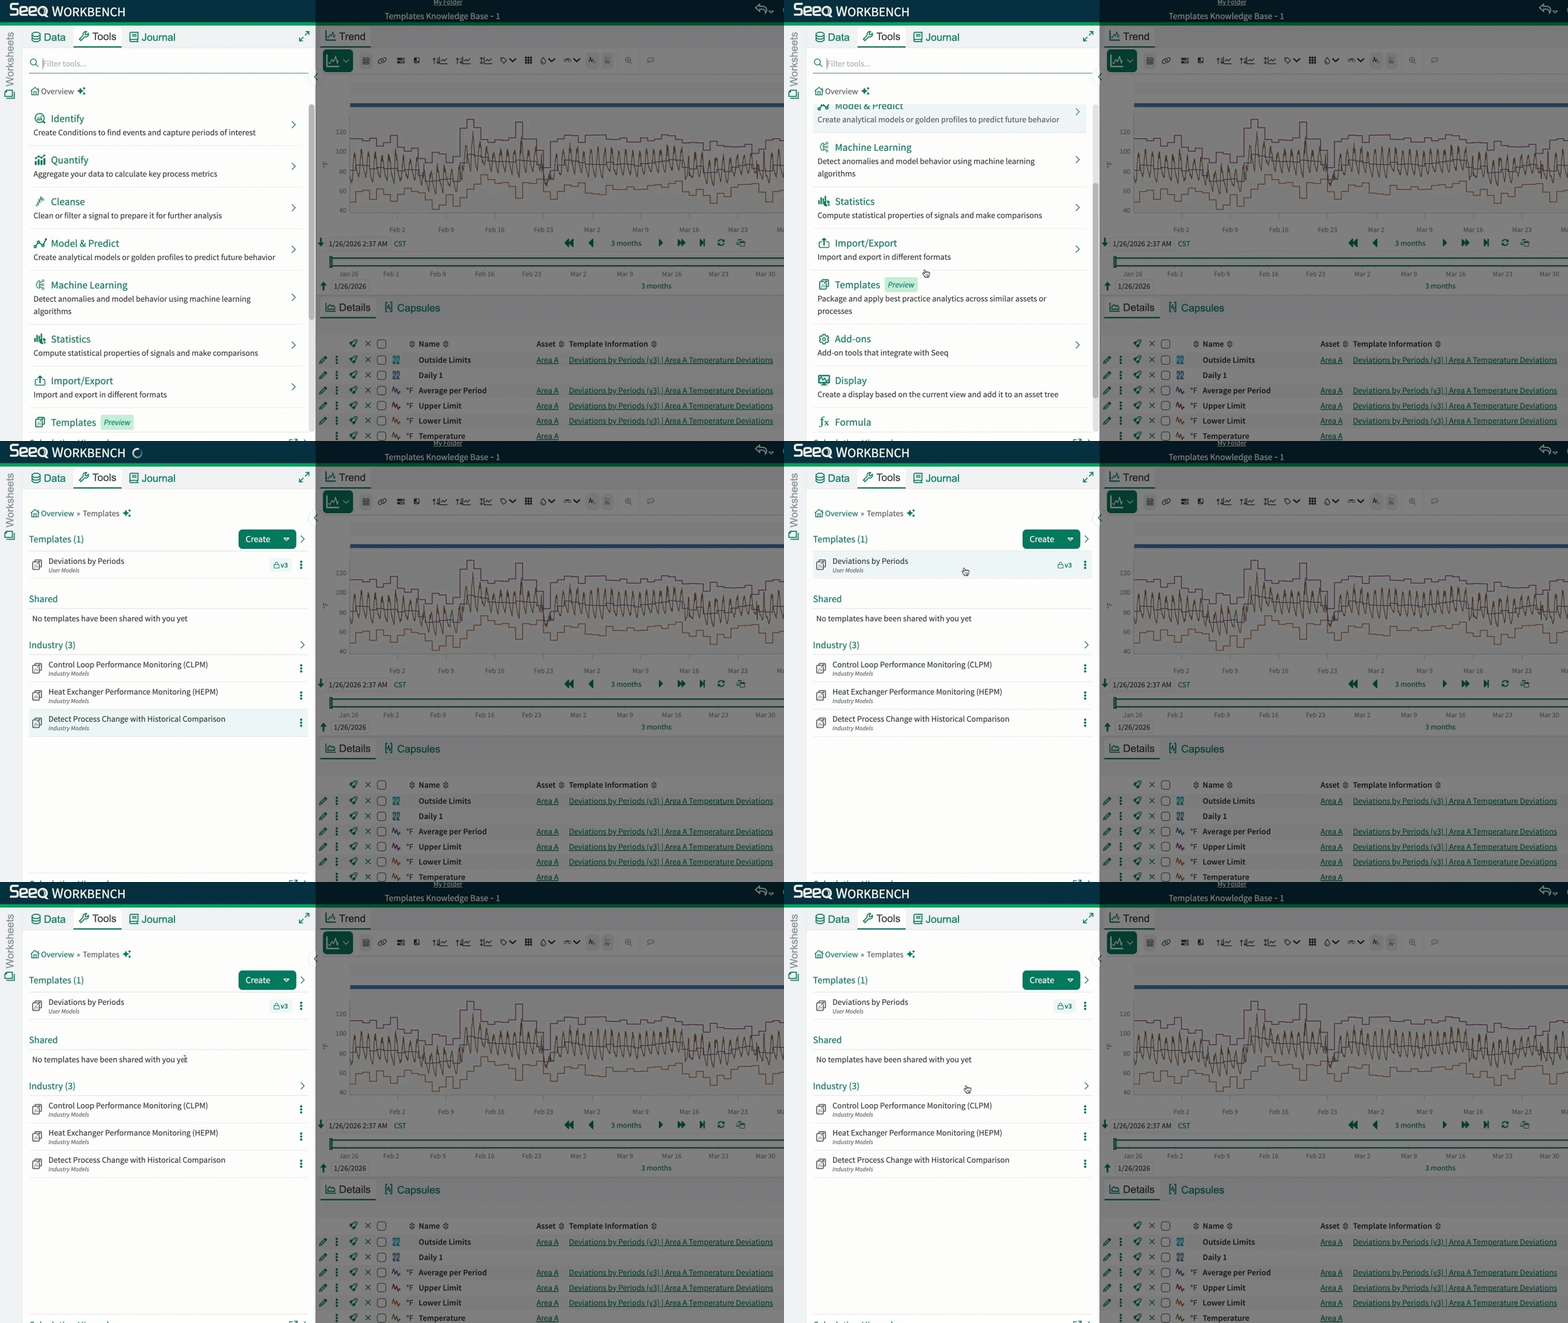
Templates help teams standardize, share, and scale best practices in Seeq.
With Templates, you can:
-
Reuse governed, validated calculations across analyses instead of rebuilding the same logic from scratch.
-
Roll out successful analyses faster by supporting multiple outputs from a single template.
-
Get to results faster with a guided, user-friendly experience, even when starting from a blank page.
-
Improve trust and governance with more consistent, standardized analytics.
-
Scale deployment across assets when paired with Scaling Tables.
-
Get started quickly with industry templates built for common Seeq use cases.
Want to learn more? Check out the Knowledge Base or ask the AI Assistant.
May 29, 2026
Sustain the Gains with Seeq
Seeq introduces built-in statistics to support you in keeping the gains from you improvement projects alive, connected, and actionable.
With this update, you can:
-
Find Statistics Summaries in Tools under Statistics.
-
Create Statistic Summaries in a single execution.
-
Generate a Histogram, Box Plot, SPC Chart, and summary statistics for a defined sample set.
-
Compare Statistic Summaries to test for equal mean and variance.
-
Assess improvements faster and with greater confidence.
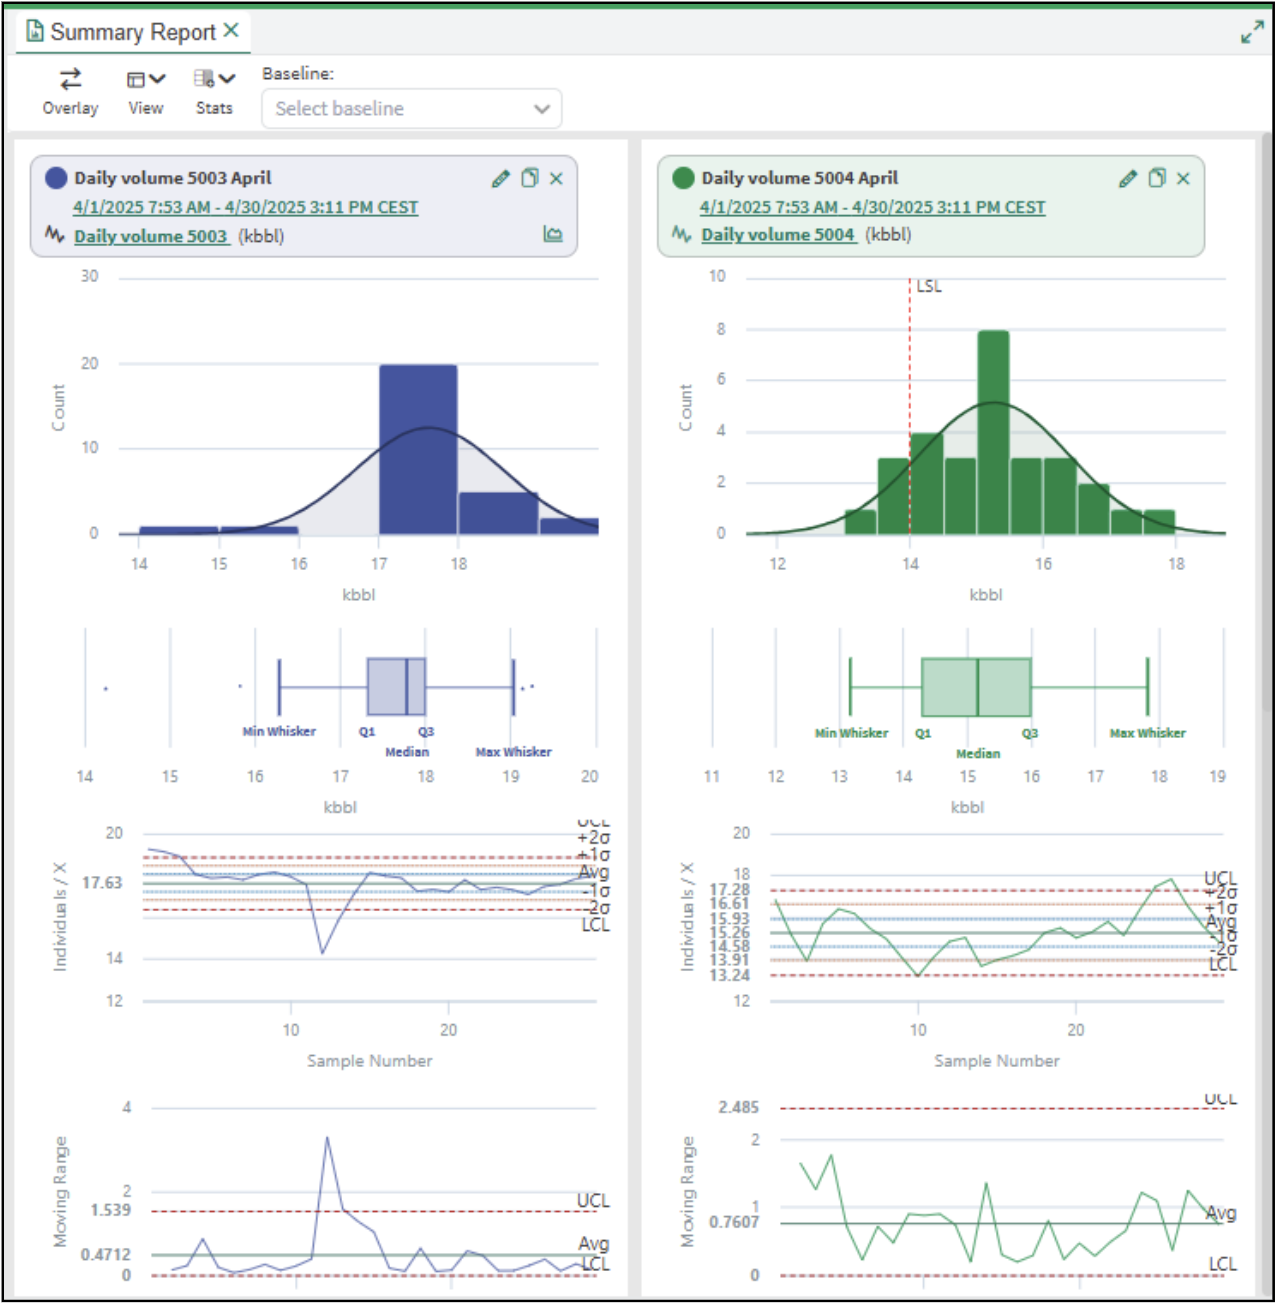
This is the first step in bringing statistics closer to day-to-day improvement work in Seeq. Seeq will extend these capabilities with the ability to operationalize outputs from a Statistic Summary, including SPC charts, Western Electric rules, event-driven process capability calculations, and comparison tests.
No more analyses that show success and then get left behind. With Seeq, your gains stay alive.
Read more in the Statistics.
Review Stage for Impact Reports
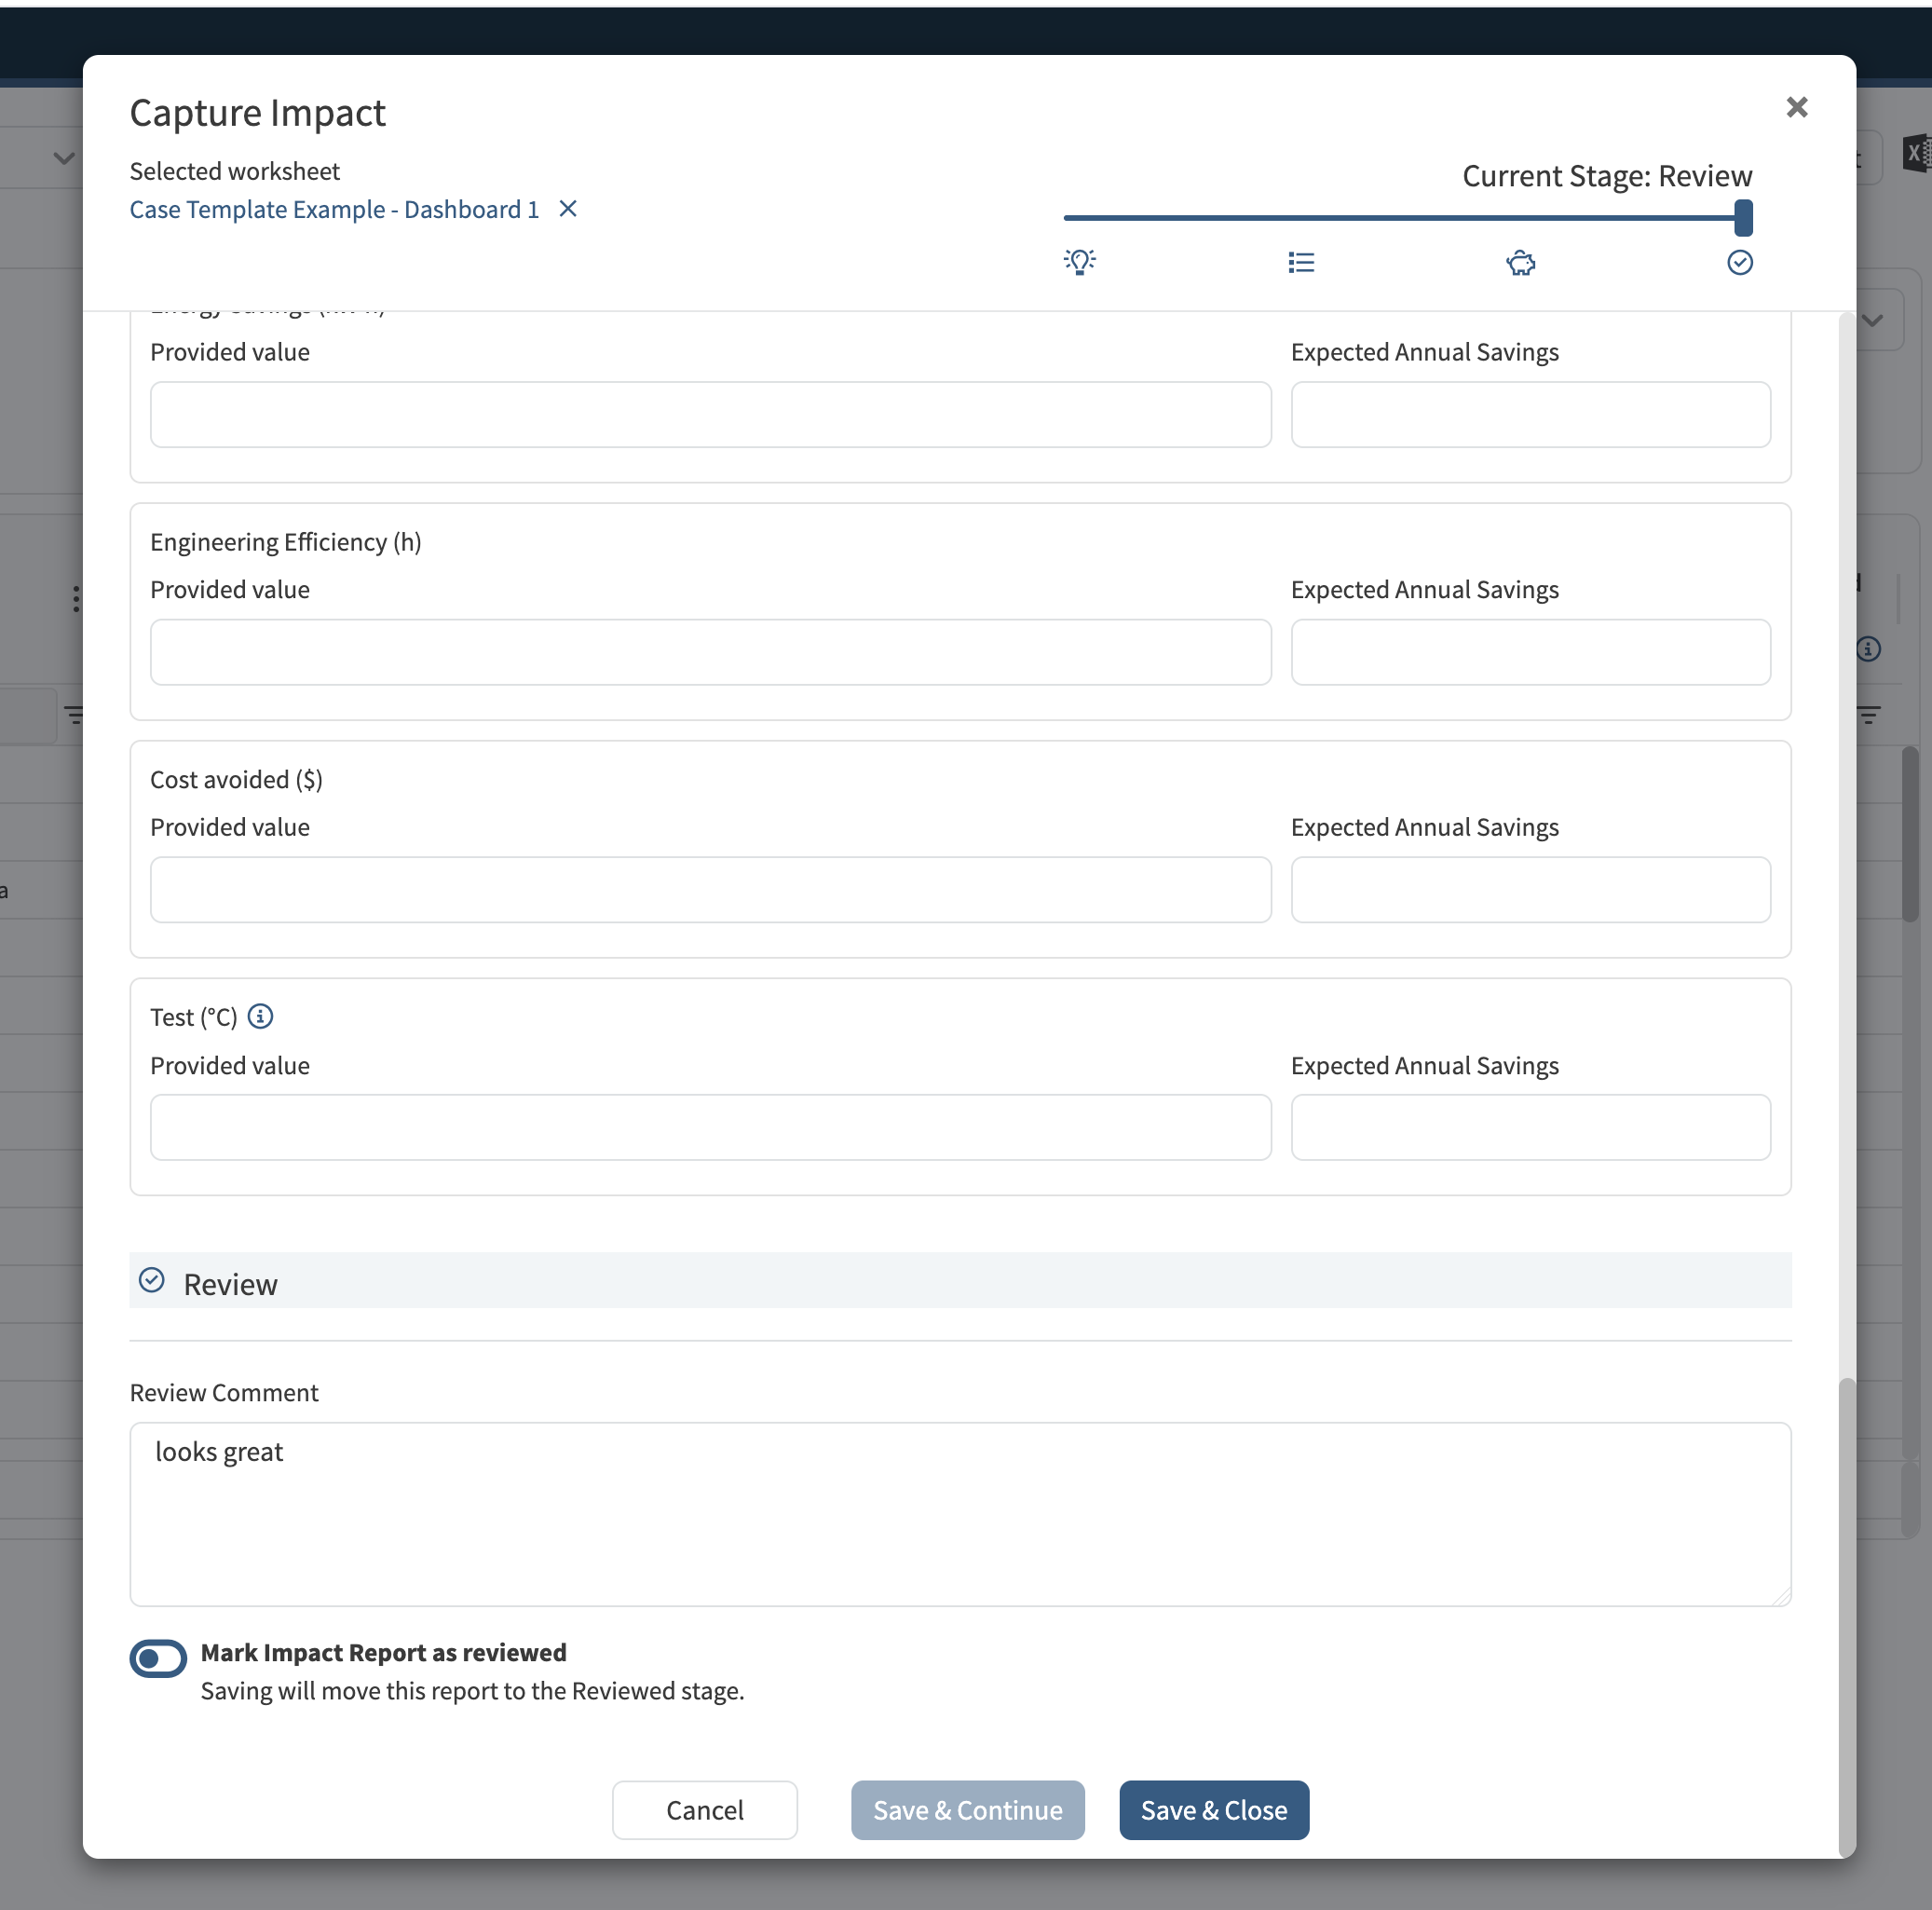
Impact Reports now provide an additional stage called “Review”. Only users who are Analytics Administrators can assign this stage to reports. Additional review comments may be provided.
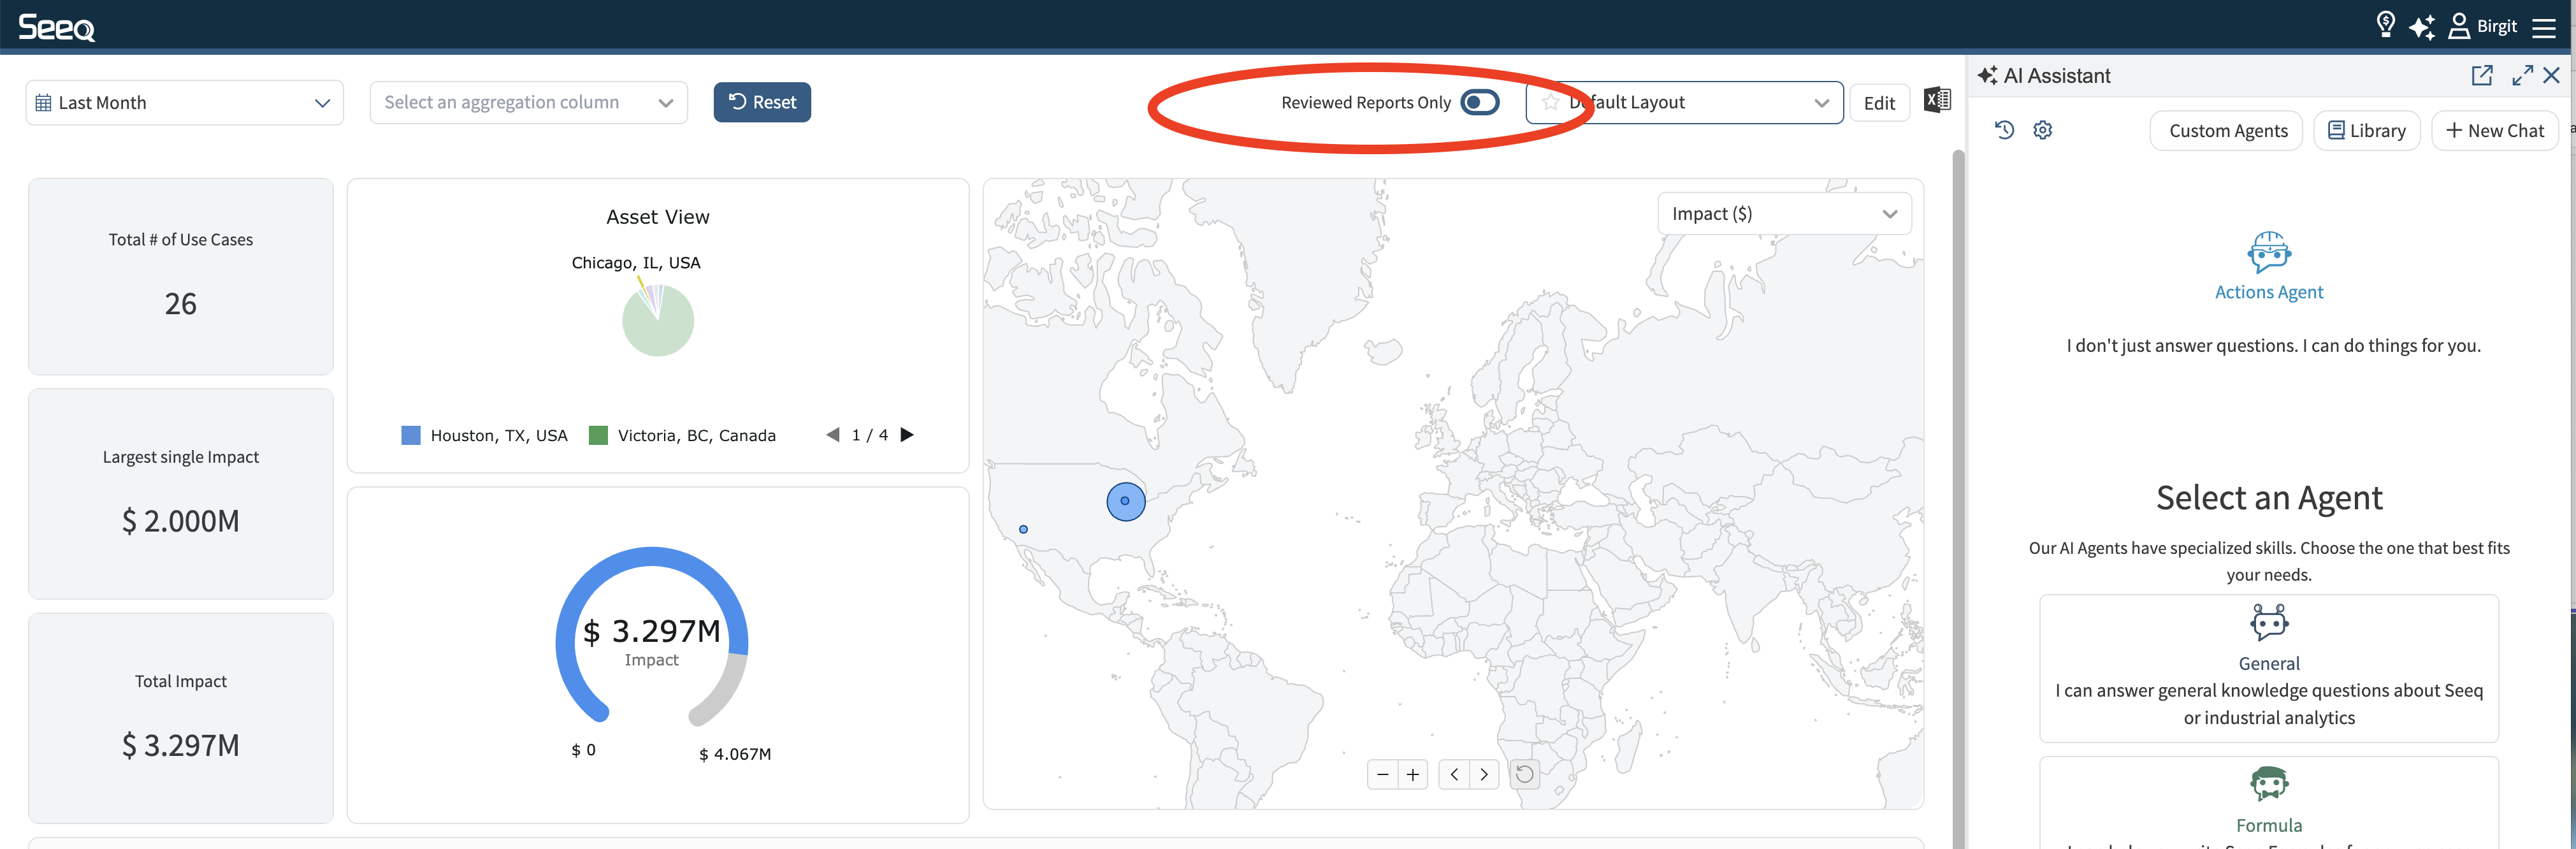
The Impact Report dashboard now also supports filtering to only display reviewed reports.
April 28, 2026
Context on time range selected on Quicktrend
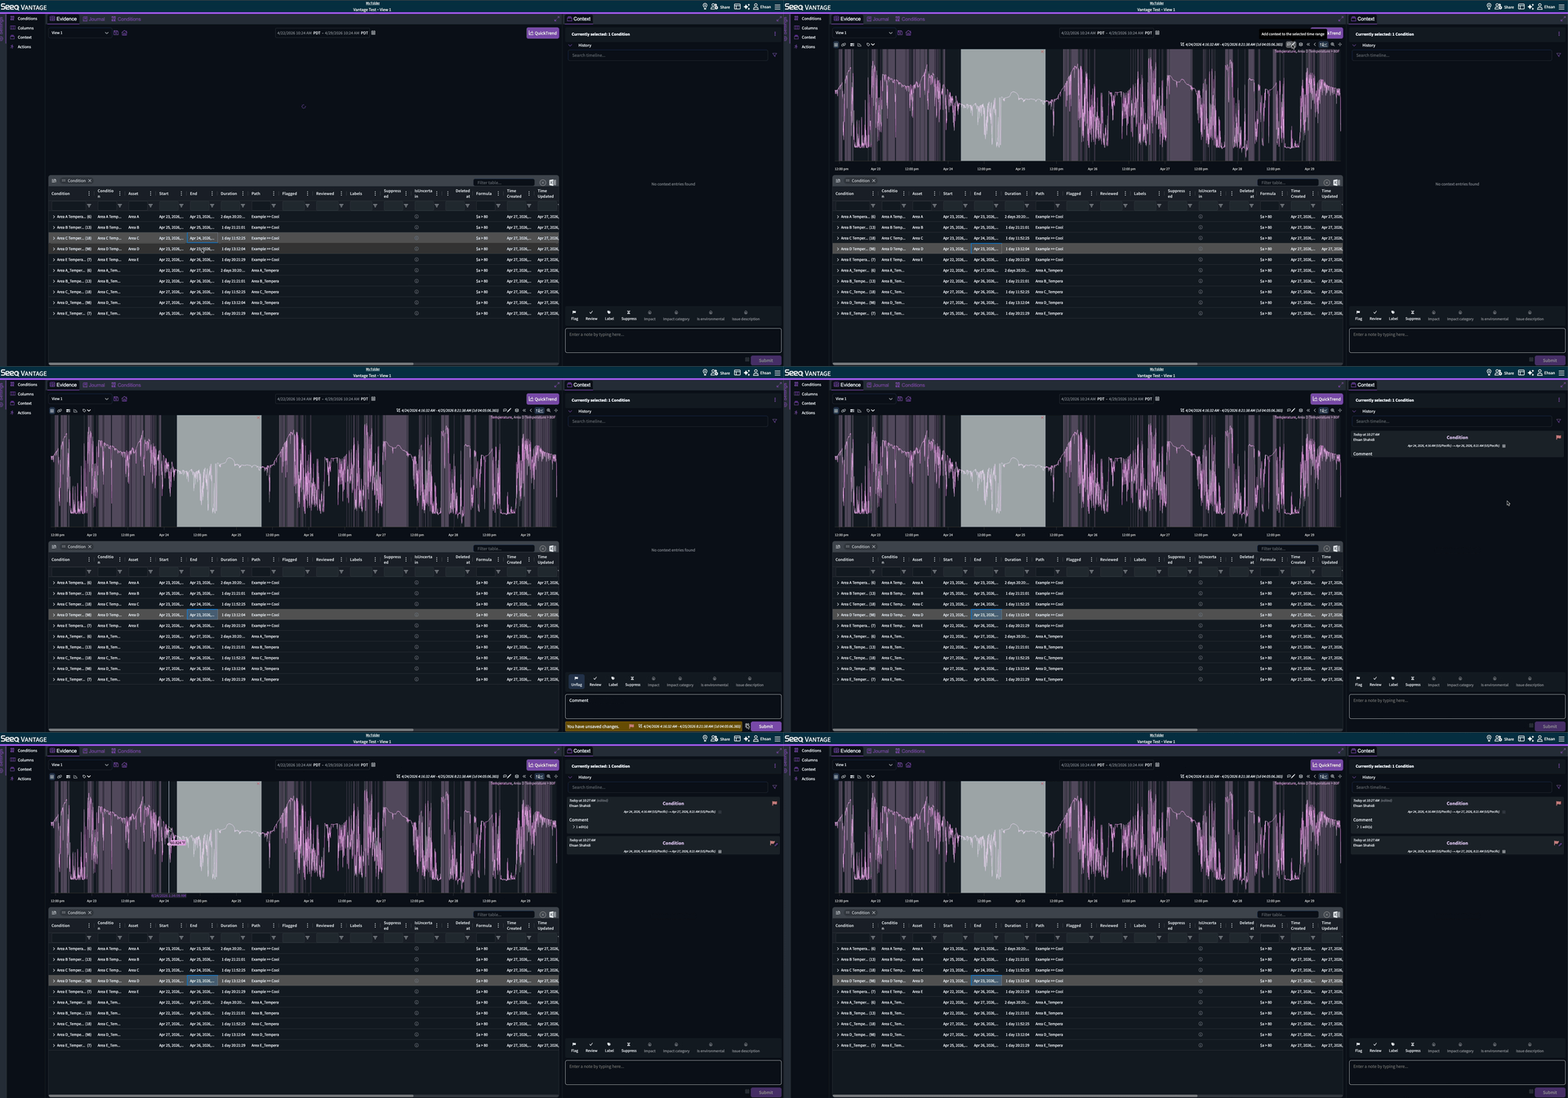
You can now drag-select a time range on Quicktrend, apply context bound to that time range on the conditions or assets shown on Quicktrend, and adjust the time range further before or after submitting the context.
April 9, 2026
24-hour Time Format
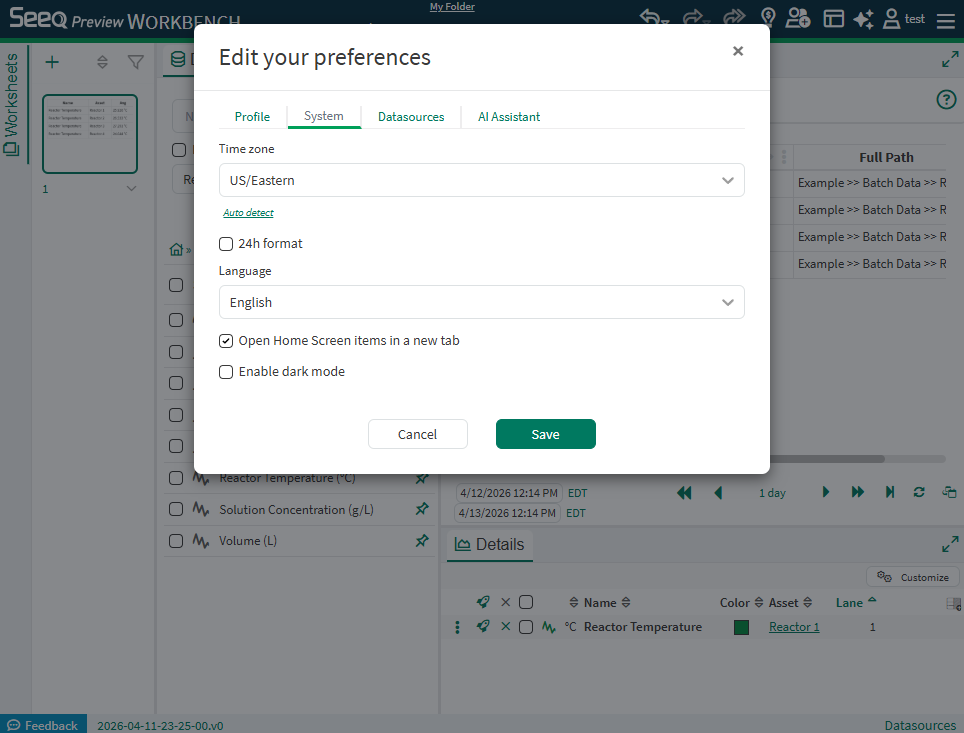
Now users who prefer 24-hour formatting for time of day can make this selection from their User Preferences so that times will appear as 0:00 to 23:59 instead of 12:00 AM to 11:59 PM. Read more at User Preferences.
April 7, 2026
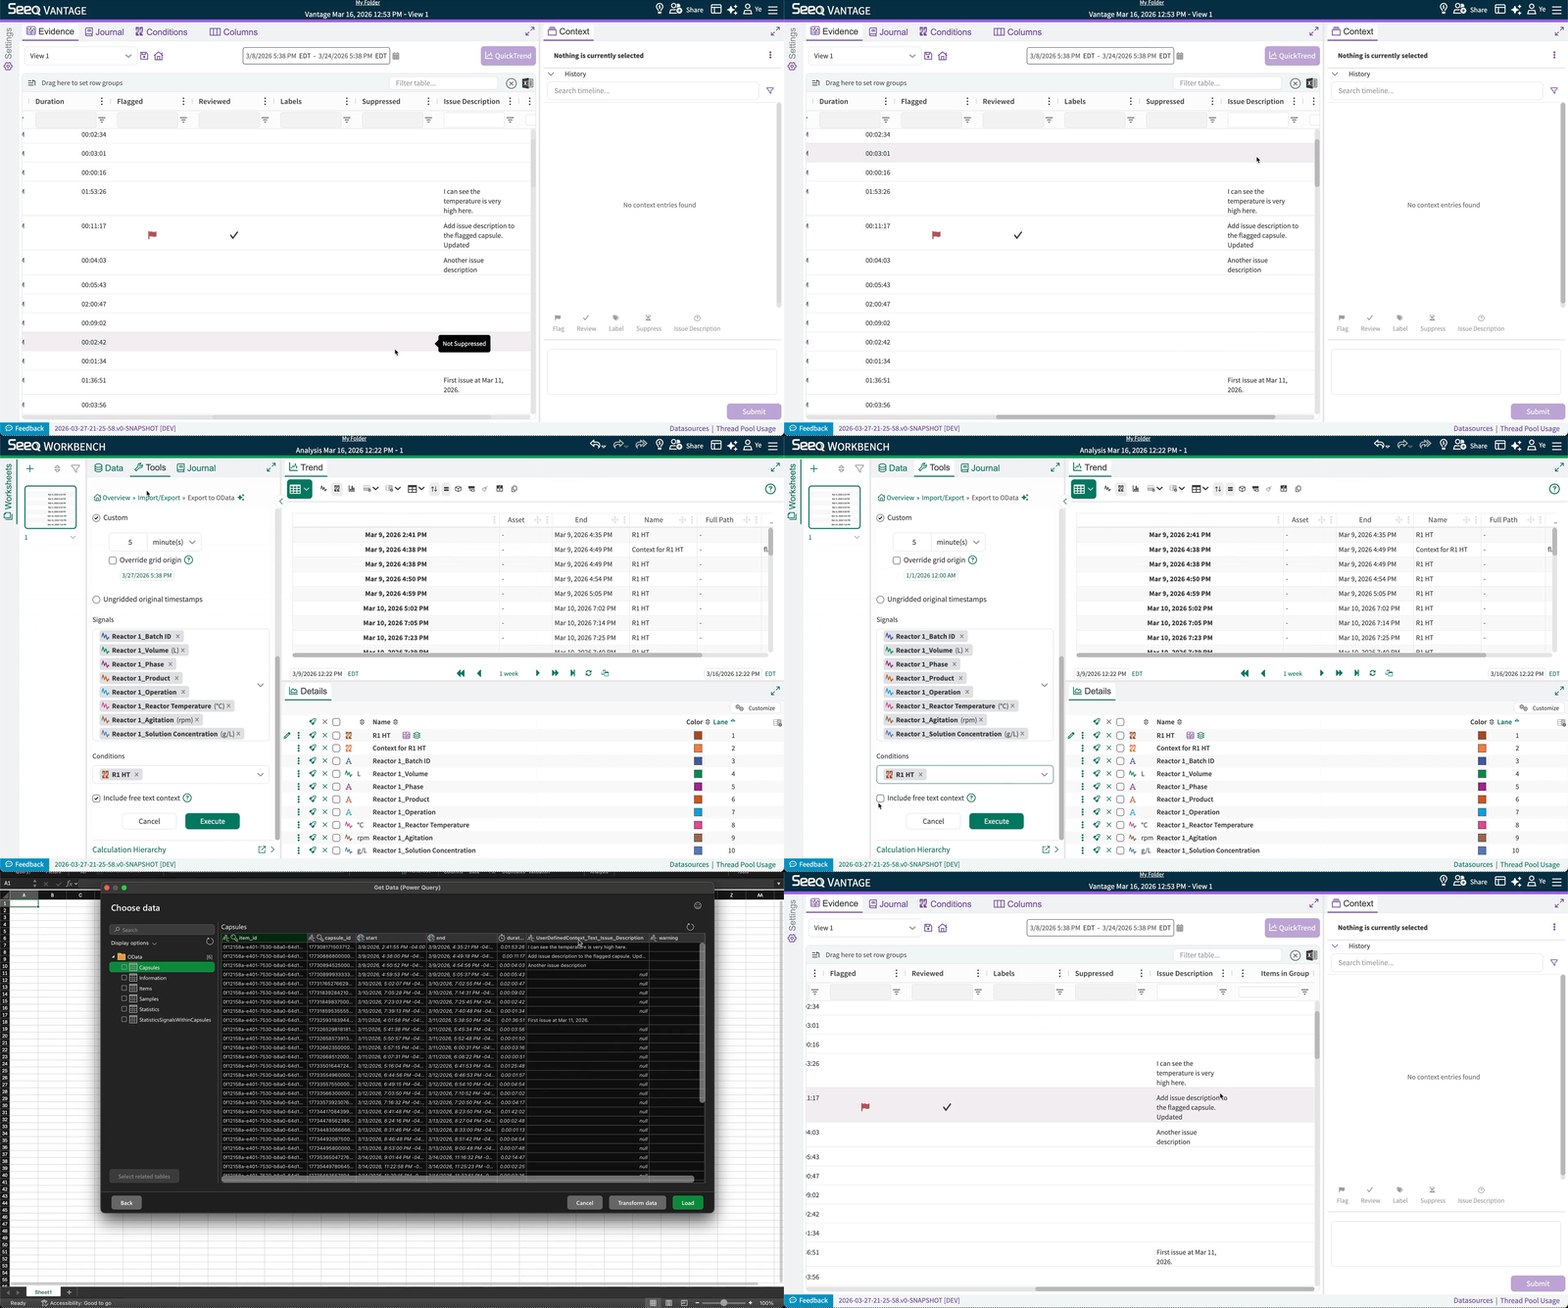
OData export can now include free text user-defined context
Free-text (categorical comment) user-defined context entered in Vantage can now be included in OData export.
April 3, 2026
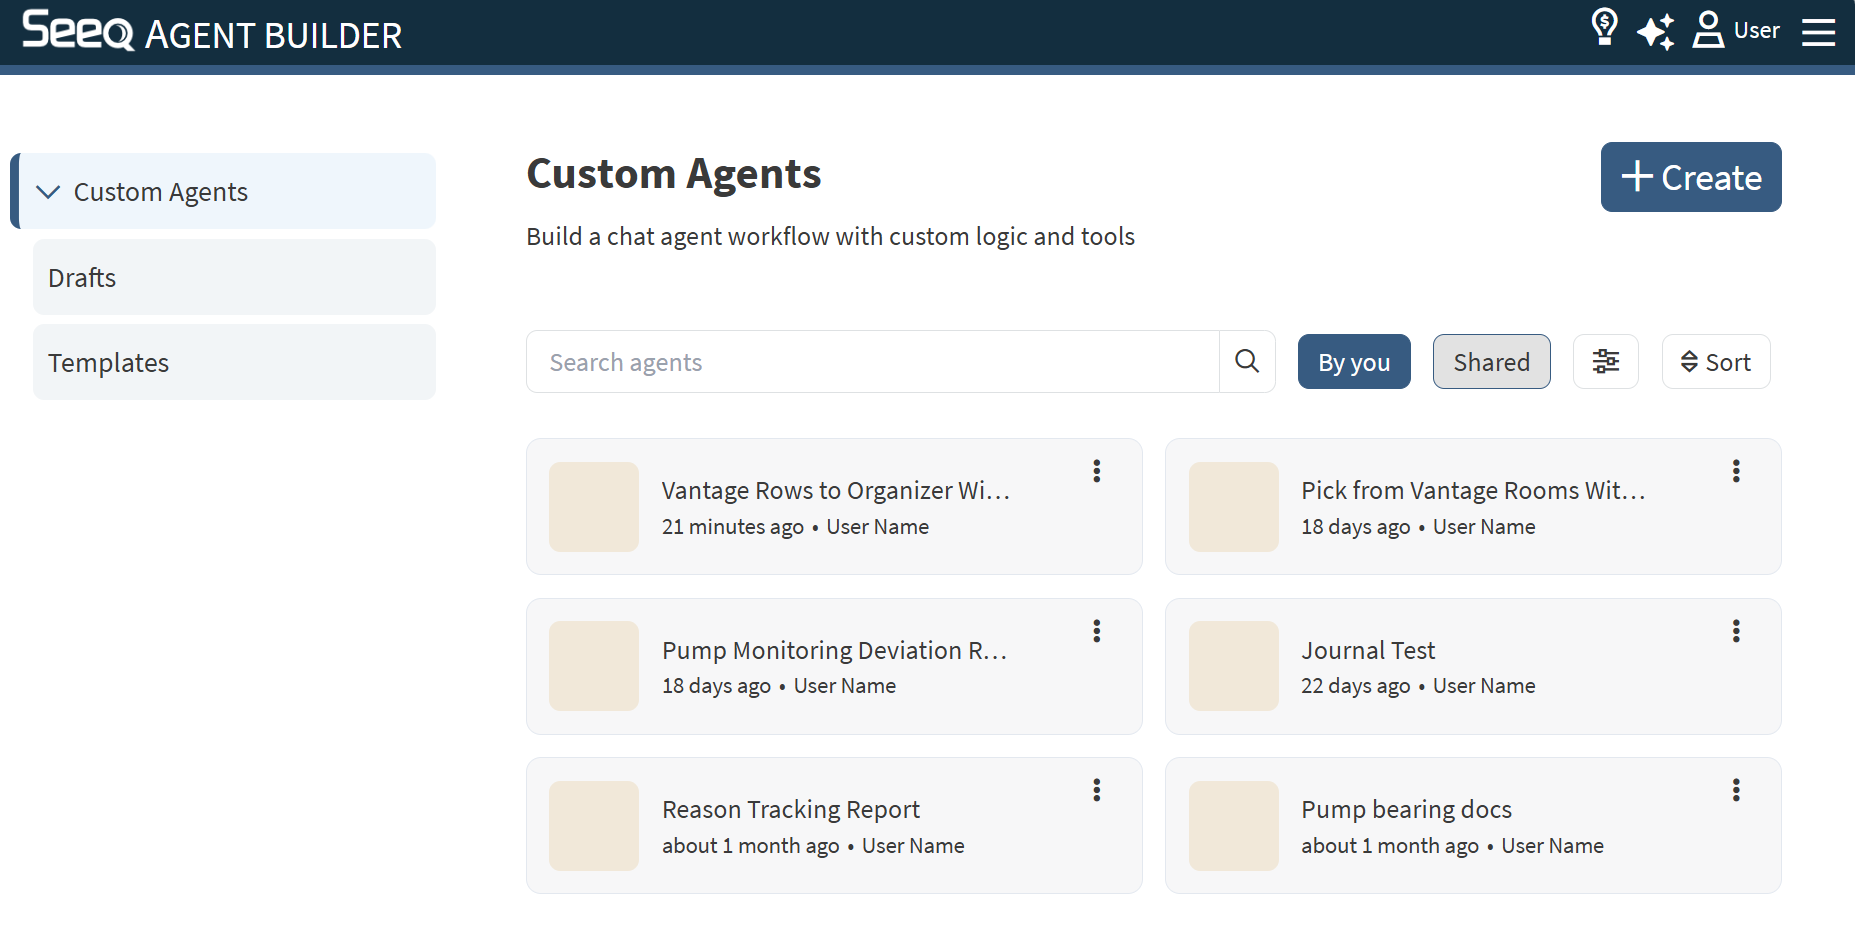
Search and Filter Custom Agents
Seeq Intelligence customers can more easily discover and navigate custom agents. The Agent Builder page now has a search field and several filters to quickly get access to custom agents you have created or those that have been shared with you. Read more at Seeq Agent Builder.
March 11, 2026
Share Custom Agents created in Agent Builder
Seeq Intelligence customers can share custom agents they create in Agent Builder with other users, just like any other items in Seeq. This allows a small set of users to enable their wider organization with custom agents.
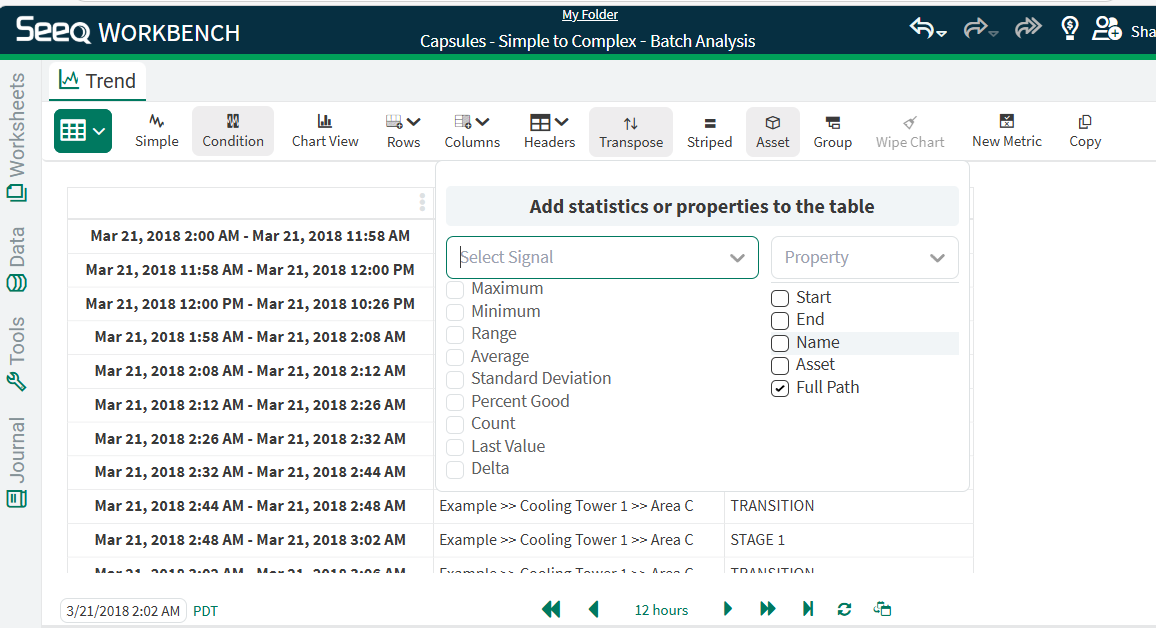
Add Full Path to Condition Tables
Condition Tables now support full path so you can more easily distinguish between assets when viewing a table across multiple layers in an asset tree.
February 18, 2026
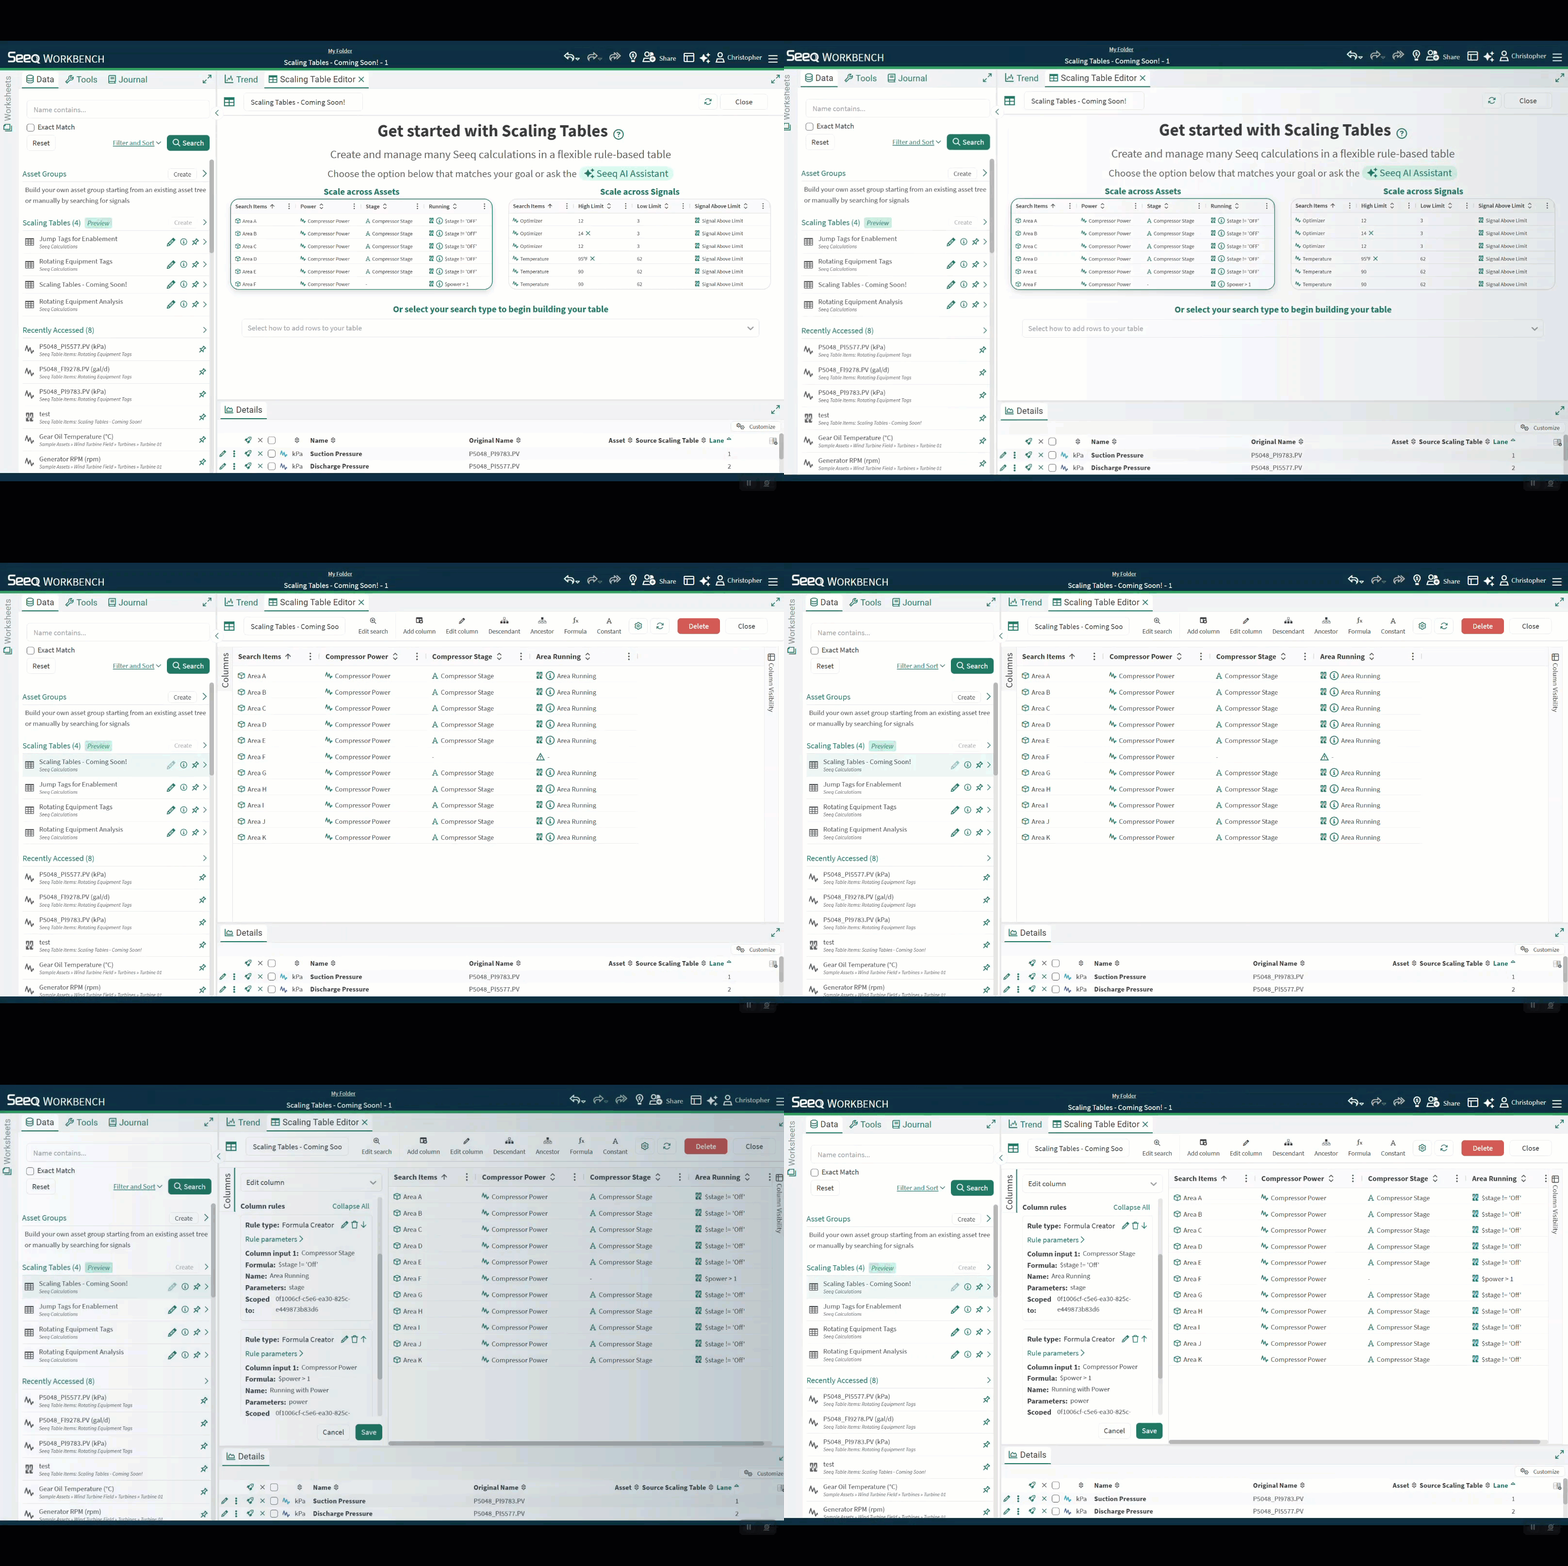
Scaling Tables now available for Enterprise customers
Scaling Tables streamline the creation and management of thousands of calculations with:
-
A no-code user interface to configure and manage analytics
-
Flexible, rule-based logic to accommodate asset differences
-
Rapid bulk updates to continuously improve your analytics
-
Easy deployment and use of asset and signal information from CSVs
-
Sharing your analytics across your organization or team
Check out the Knowledge Base and this Tips & Tricks video to learn more!
February 12, 2026
Modify Subject and Body of Scheduled Organizer Emails
You can modify the subject and body when sending Organizer Topics to recipients as PDFs on a schedule. This can help you add more context than the Organizer Topic name.
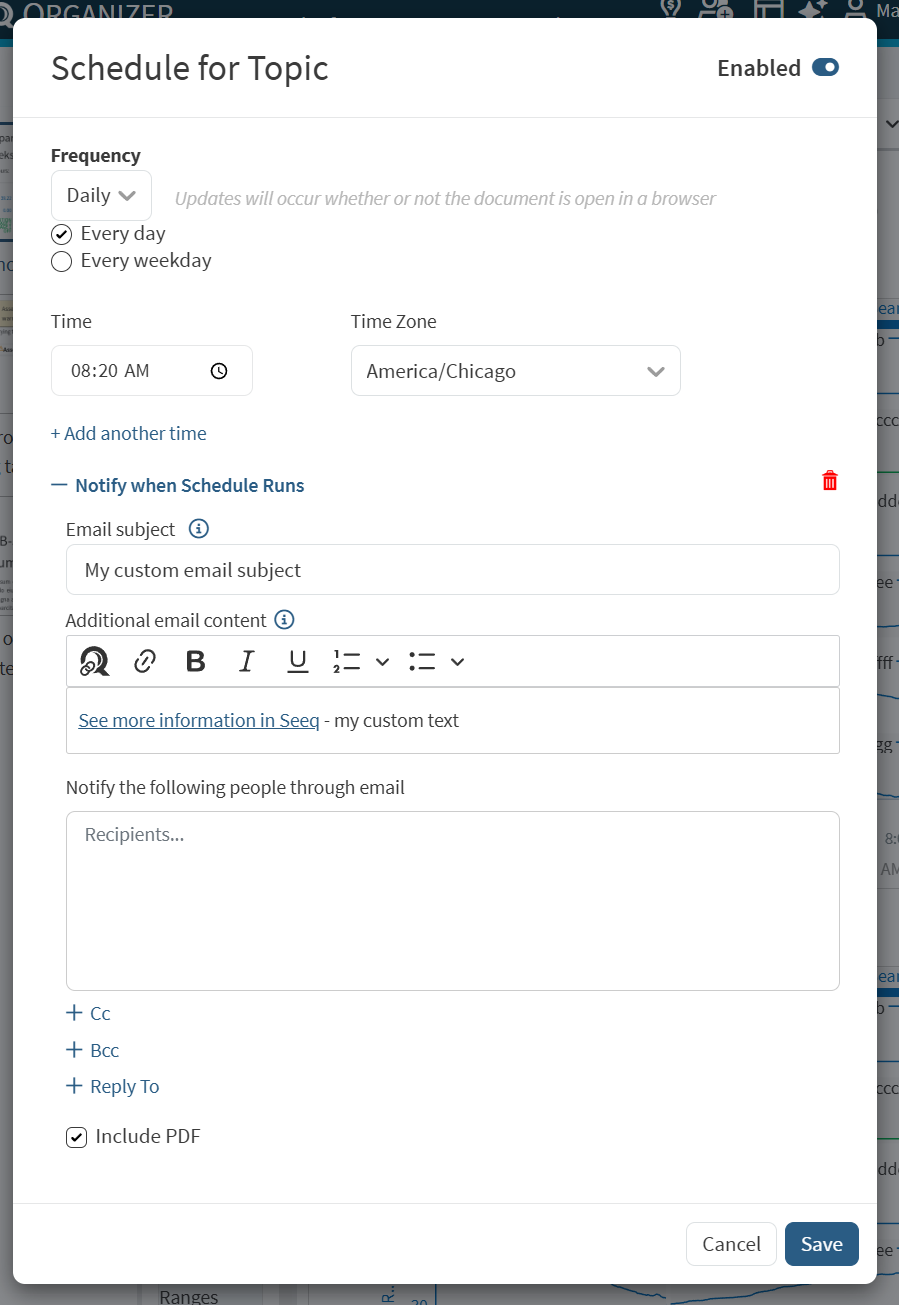
Read more at Scheduling Organizer Topic Documents - Seeq Knowledge Base - Confluence.
Ignition Module support for Ignition v8.3
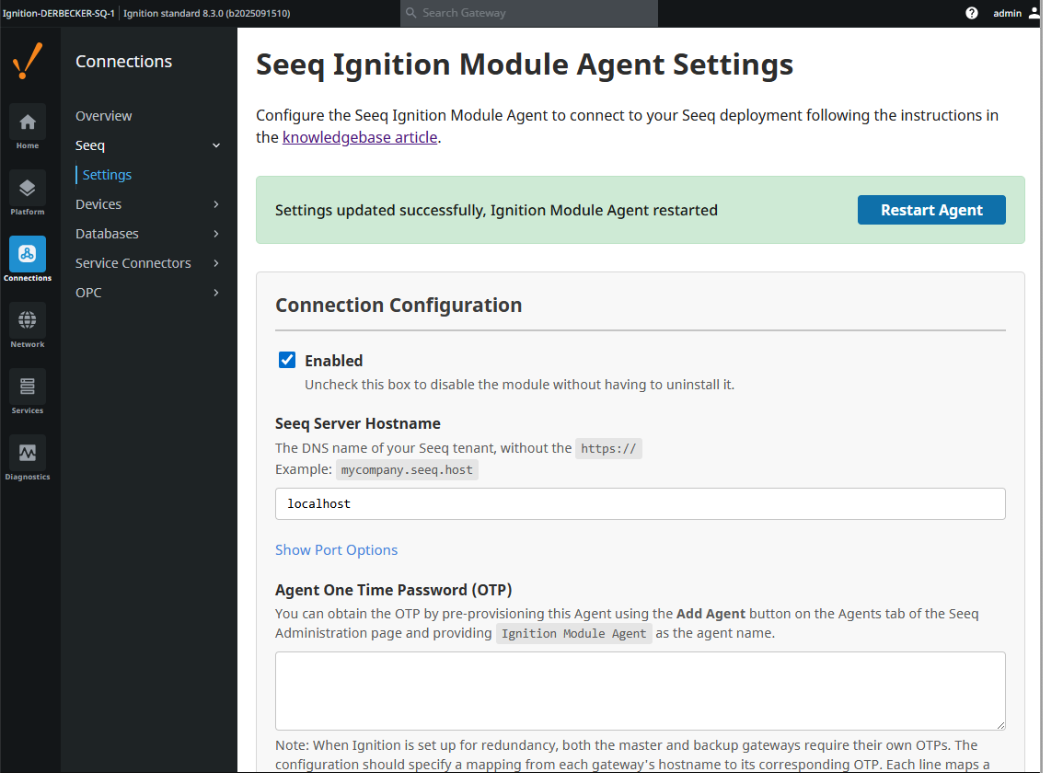
We have added support for Ignition 8.3. The Seeq Ignition Module for version 8.3 has been modernized with an improved settings UI and real-time connection status monitoring.
Key improvements include:
-
New Web UI: Modern React-based settings interface
-
Connection Status: Real-time monitoring and display of Seeq server connectivity with detailed error reporting
-
Component Cleanup: Deprecated and removed
SeeqVisualizationComponent.LaunchSeeqComponentis now fully functional under 8.3. -
Enhanced Developer Experience: Improved build scripts with support for running/debugging Designer and Client independently
The new UI is available in the Ignition Gateway UI under Connections > Seeq > Settings and looks like this: