Scaling Tables is a new feature, only available for customers on the Enterprise Package (inclusive of legacy IEM Suite).
For more details, or if you are interested in unlocking the capabilities outlined below, please reach out to your Seeq Account Team.
Overview
Scaling Tables are the next evolution of self-service scaling of analytics within the Seeq platform. Scaling Tables are a no-code UI directly in Seeq Workbench tailored to self-service scaling, whether across a fleet of pumps, control loops, reactors or single-variable anomaly detection.
Whether you are starting with just a scaling dream, a pre-existing asset/data structure, or a list of “similar” tags or units, this page will show you how to get from one analysis to scaling across more similar assets using this new, no-code interface.
Scaling Tables unlocks effortless, self-serve enterprise scaling of analytics with:
-
Flexible, rule-based logic to accommodate asset differences
-
Rapid bulk updates to continuously improve your analytics
-
Easy onboarding of asset metadata and signal names from CSVs
-
Sharing your analytics across your organization or team
-
Automatically include new Assets or Signals with scheduled searching
Check out this Tips & Tricks video for helpful guidance on getting started and leveraging all the Scaling Tables functionality.
Scaling Tables vs. Asset Groups
If you’re aiming to scale analytics across assets with flexible logic, automation, and high-volume deployment, Scaling Tables provide more flexibility and power, especially for large enterprises and organizations moving toward proactive, scalable monitoring. In addition, Scaling Tables allows you to:
-
scale across your Enterprise; there are no row or cell limits.
-
share your work across Workbooks: Scaling Tables can be made Global.
-
manipulate text columns, to be used to assign Condition or Capsule properties.
-
implement fallback rules for asymmetrical asset structures
-
manage and navigate your large tables effortlessly through sorting, rearranging and hiding columns
-
perform univariate analytics on signals, and more.
If you need to manage a smaller group of assets, or to create a tag mapping manually when none exists, Asset Groups are still available for use.
Getting Started
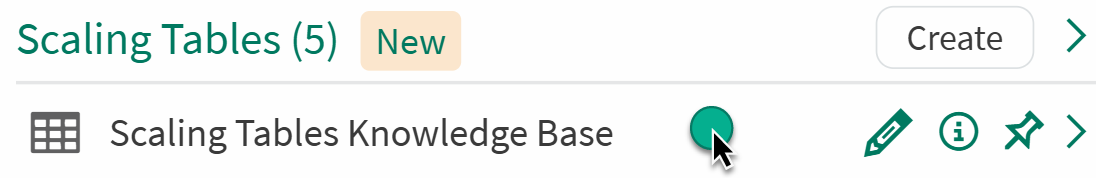
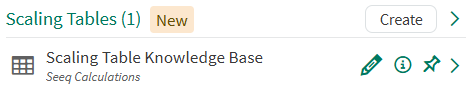
To create a Scaling Table, start in the Data tab and click the "Create" button to the right of the Scaling section. This will open a new Scaling Table Editor window. Like other Seeq windows, this is resizable and moveable.
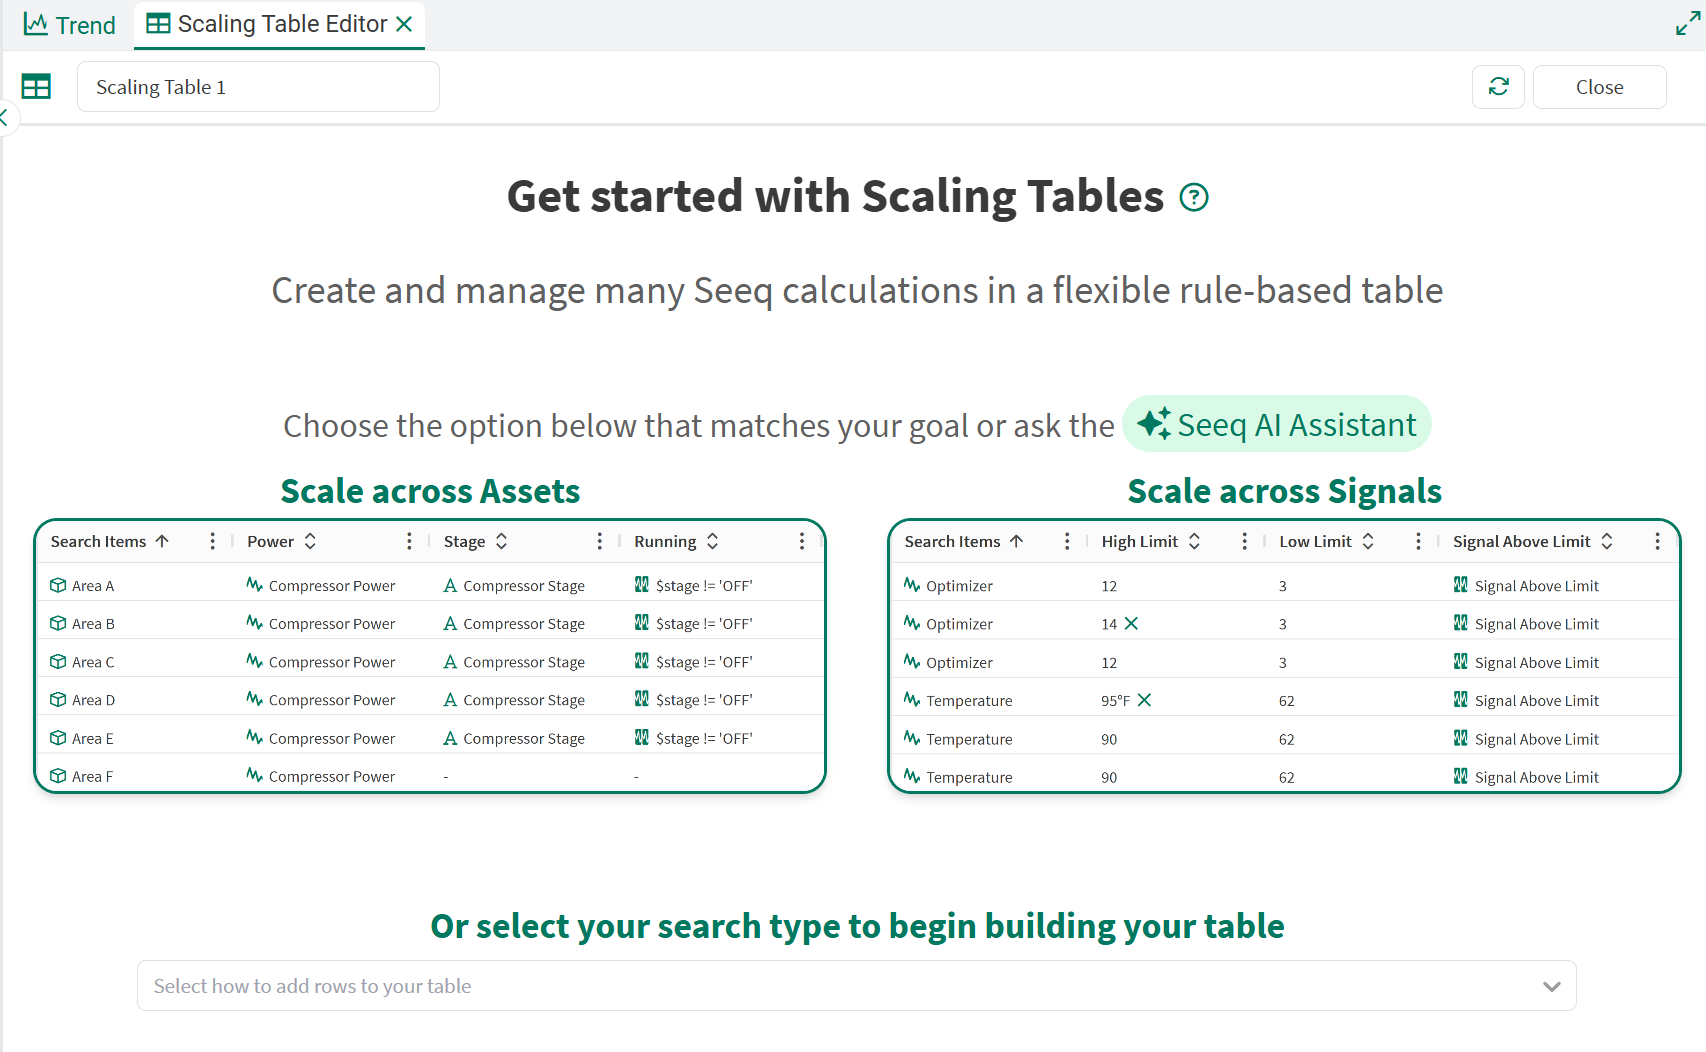
From here, you will see the “Get started” page with two shortcut options above a dropdown option prompting you to choose how you’d like to search in order to add rows to your table.
Adding Rows to a Scaling Table
The two clickable shortcuts streamline getting started with two common workflow paths, but are not the only ways to get started:
-
Scale across Assets: This option prepopulates the starting search as a Property search with Type equal to Asset. This starting point still requires you to add which Root asset to search under and/or additional filters like Name, Description or Template. Use this option when you want to scale analytics across a fleet of assets, equipment, units or other grouping.
-
Scale across Signals: Another common workflow is scaling single-variable analytics across many Signals. Selecting this option prepopulates your search, also as a Property search, this time with Type equal to Signal. You can still additionally filter your search by limiting it to a particular Asset Tree and add more filters like Name or Description. Use this option when you want to perform single-variable analytics like signal smoothing/cleansing, create many Value Searches or perform univariate anomaly detection.
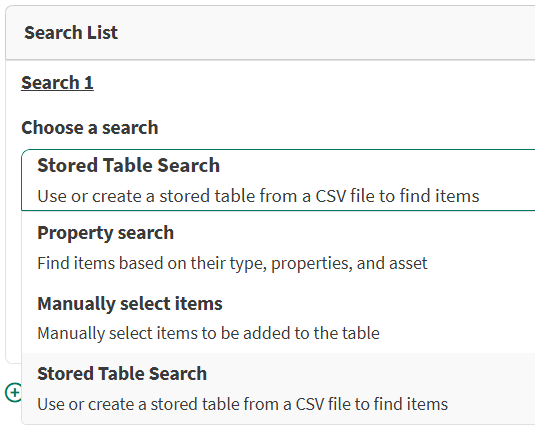
Below the shortcuts, you will find the three primary options for adding rows to your table: property search, manually selecting items, and Stored Table Search. Plus you can always get help from the Seeq AI Actions Agent. Regardless of which search method you choose, this search will populate the first new column of your table - Search Items, and from there you can start scaling your analytics.
Helpful Tip
Try using the AI Actions Agent to help populate your search. Start with something simple like: “Add all signals named Temperature to the scaling table.” and go from there! If the AI Assistant doesn’t yield the correct search, try using the methods below.
The Property search should be used if you have a similar shared property for all of the items you want to find. This could be the Name, Datasource, Description, or any other custom property assigned on your items. The search results can be further filtered down by Type or limited to a specific Asset Tree or Workbench scope.
The Manually select items should be used if you want to do a search similar to the Workbench Data Pane and choose each item that you would like added to your table. This is most similar to Asset Groups where you are manually mapping/selecting the items you’d like to work with.
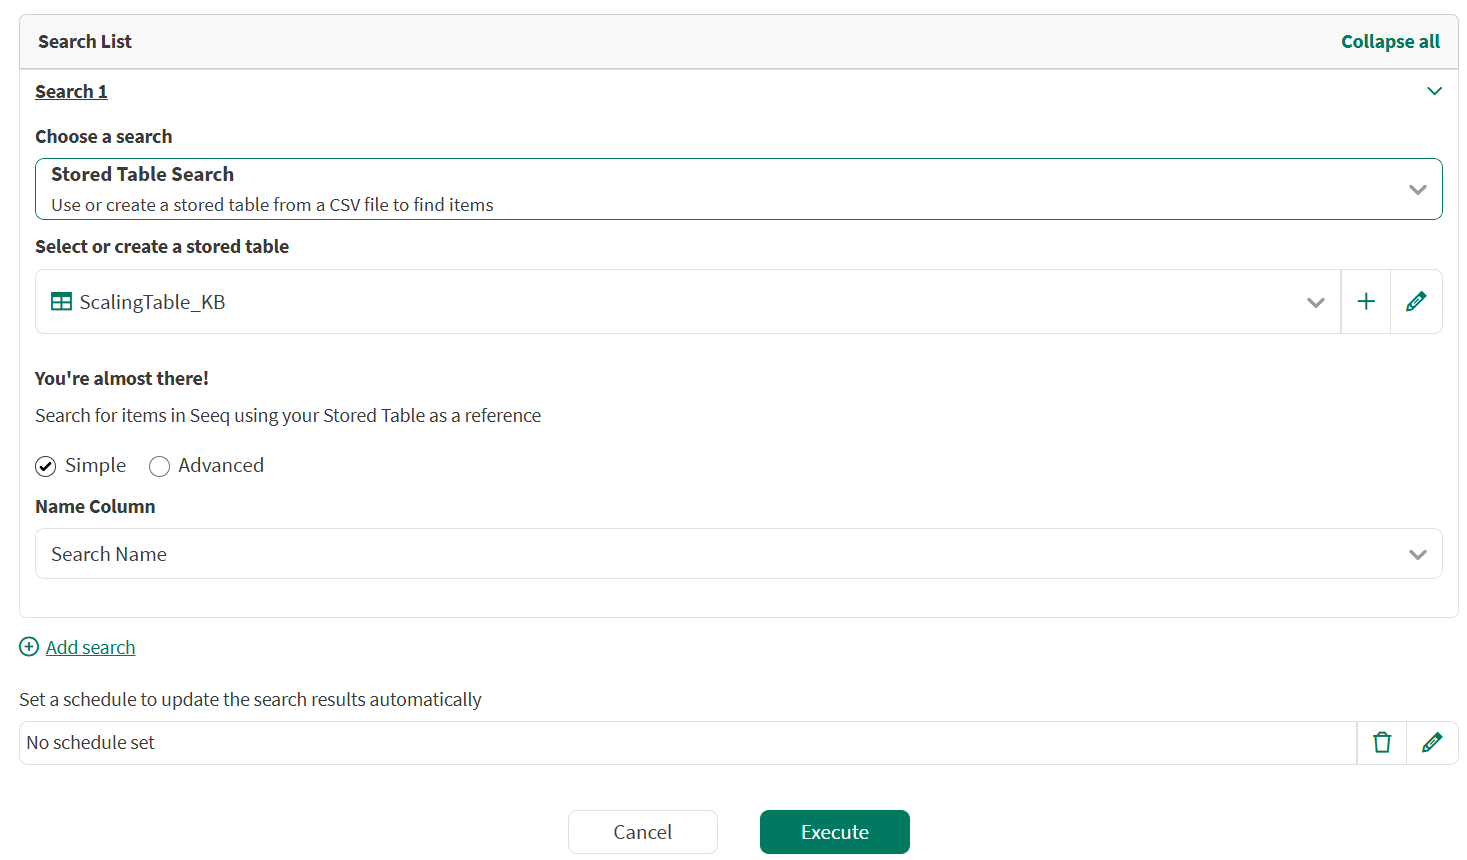
The third option of Stored Table Search should be used if you already have a list of tags upon which you’d like to do univariate analytics. Once you’ve imported your file, you’ll be prompted to choose which column from that file to search the Seeq system for. Valid search results will populate the first column of the table.
Adding Columns to a Scaling Table
Once you have found your search items, you can continue to add your columns to the table through either Rules or Shortcuts. Creating new columns in a Scaling Table gives you more information to operate with, allowing you to perform more complex logic or multivariate Formulas to get your desired output. There are many different Column Rules that enable you to find more data, calculate and define new values, or find and change text. A full list of the available rules can be found here.
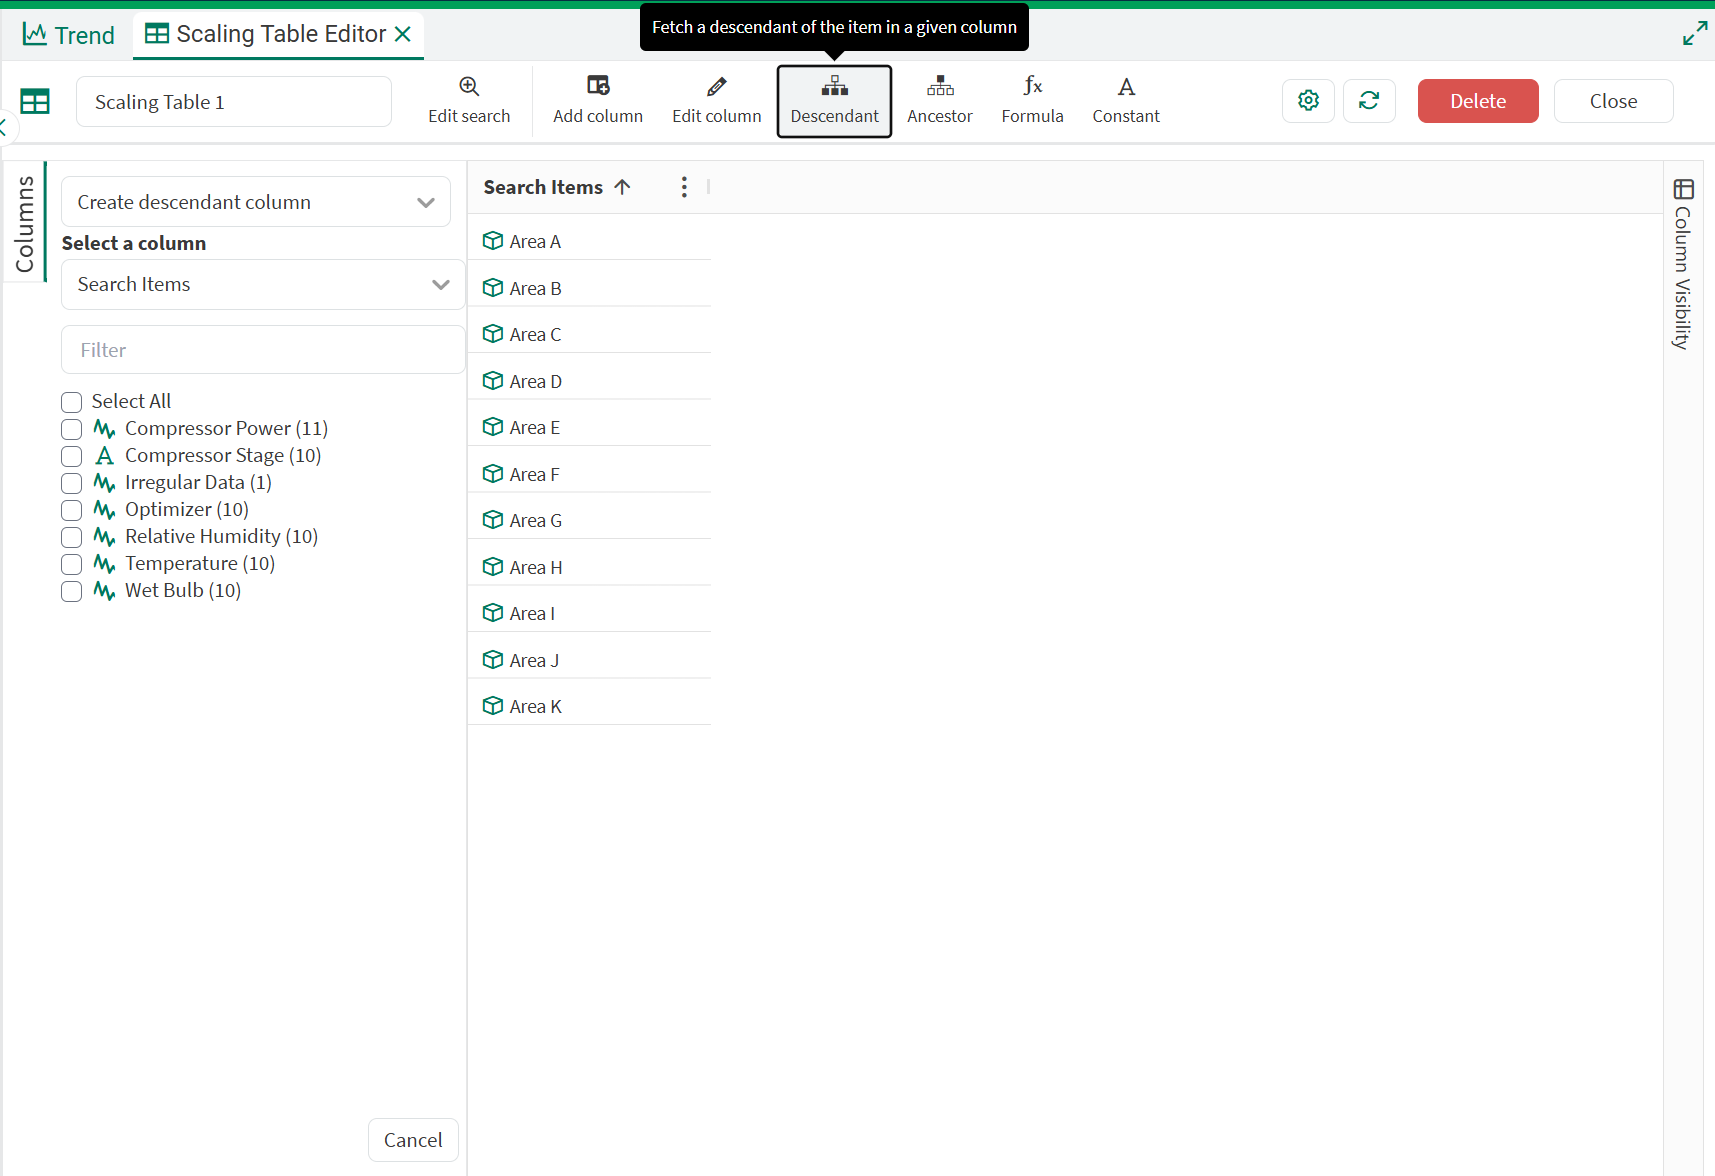
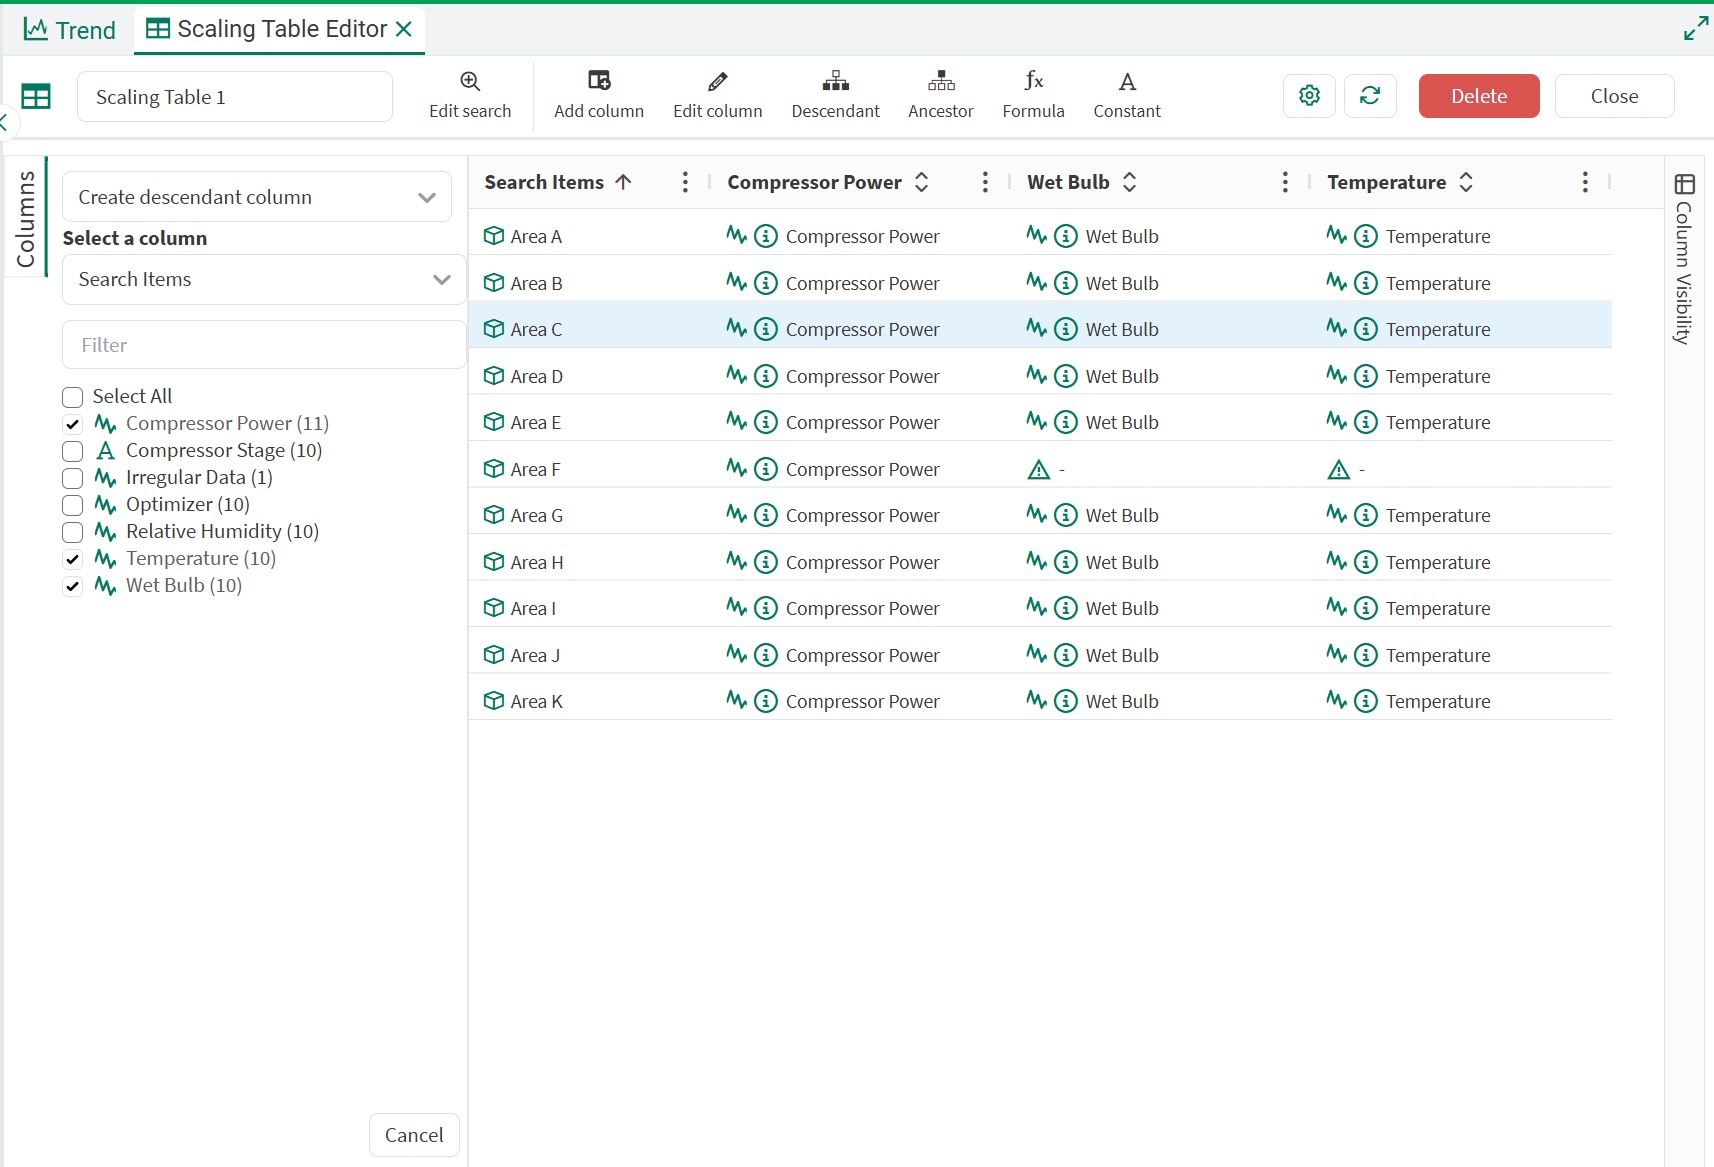
Shortcuts are another way to quickly populate new columns with properties, descendants, and ancestors and can be accessed through the 3 dot menu for a column or through the tool bar. If you’ve started your Scaling Table by doing a Property Search for assets, using the Create Descendant Column is the fastest way to bring in your signals, scalars, or conditions associated with each asset to be able to start building calculations. Ancestors allow you to navigate up layers in your tree, and the property shortcut lets you extract information from the items in that column.
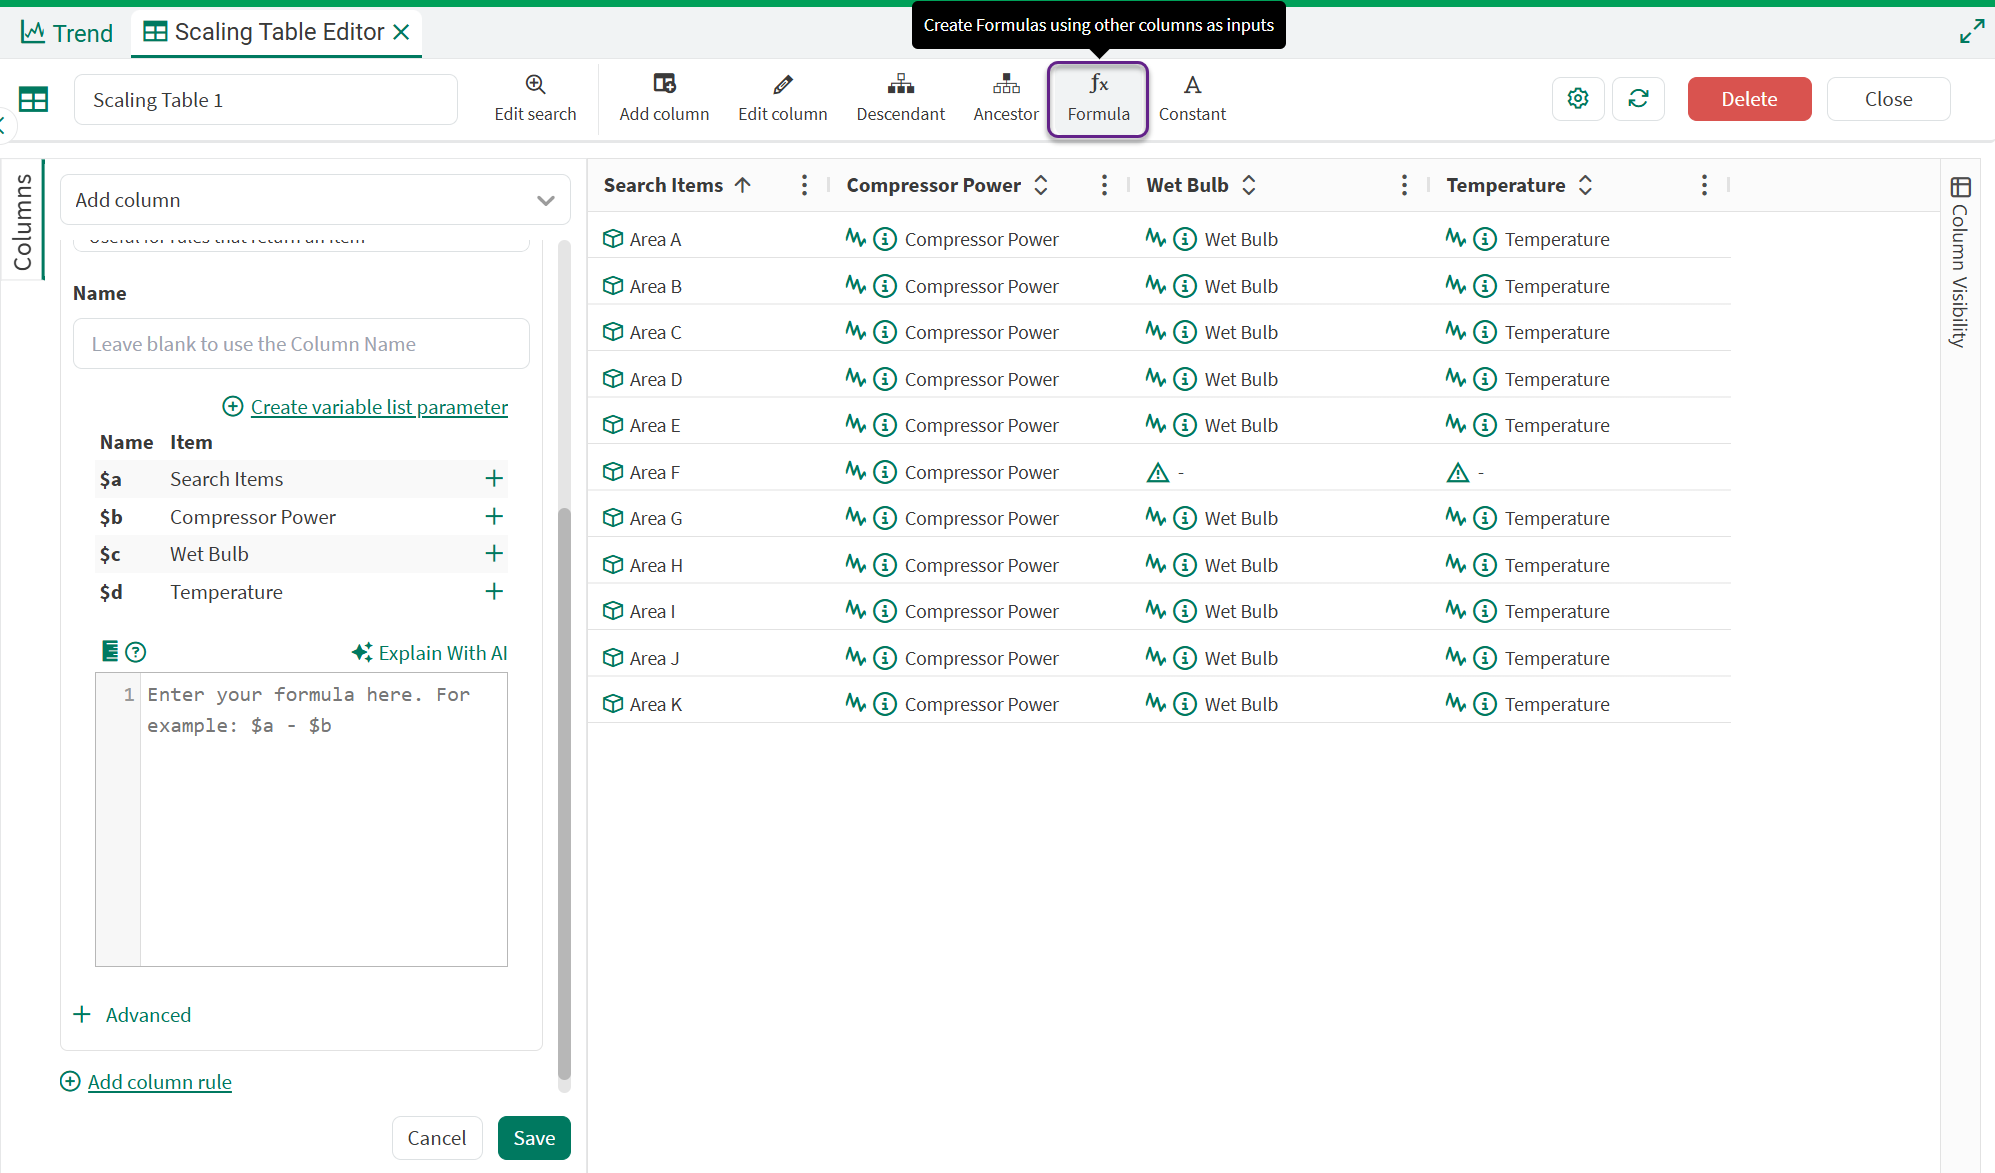
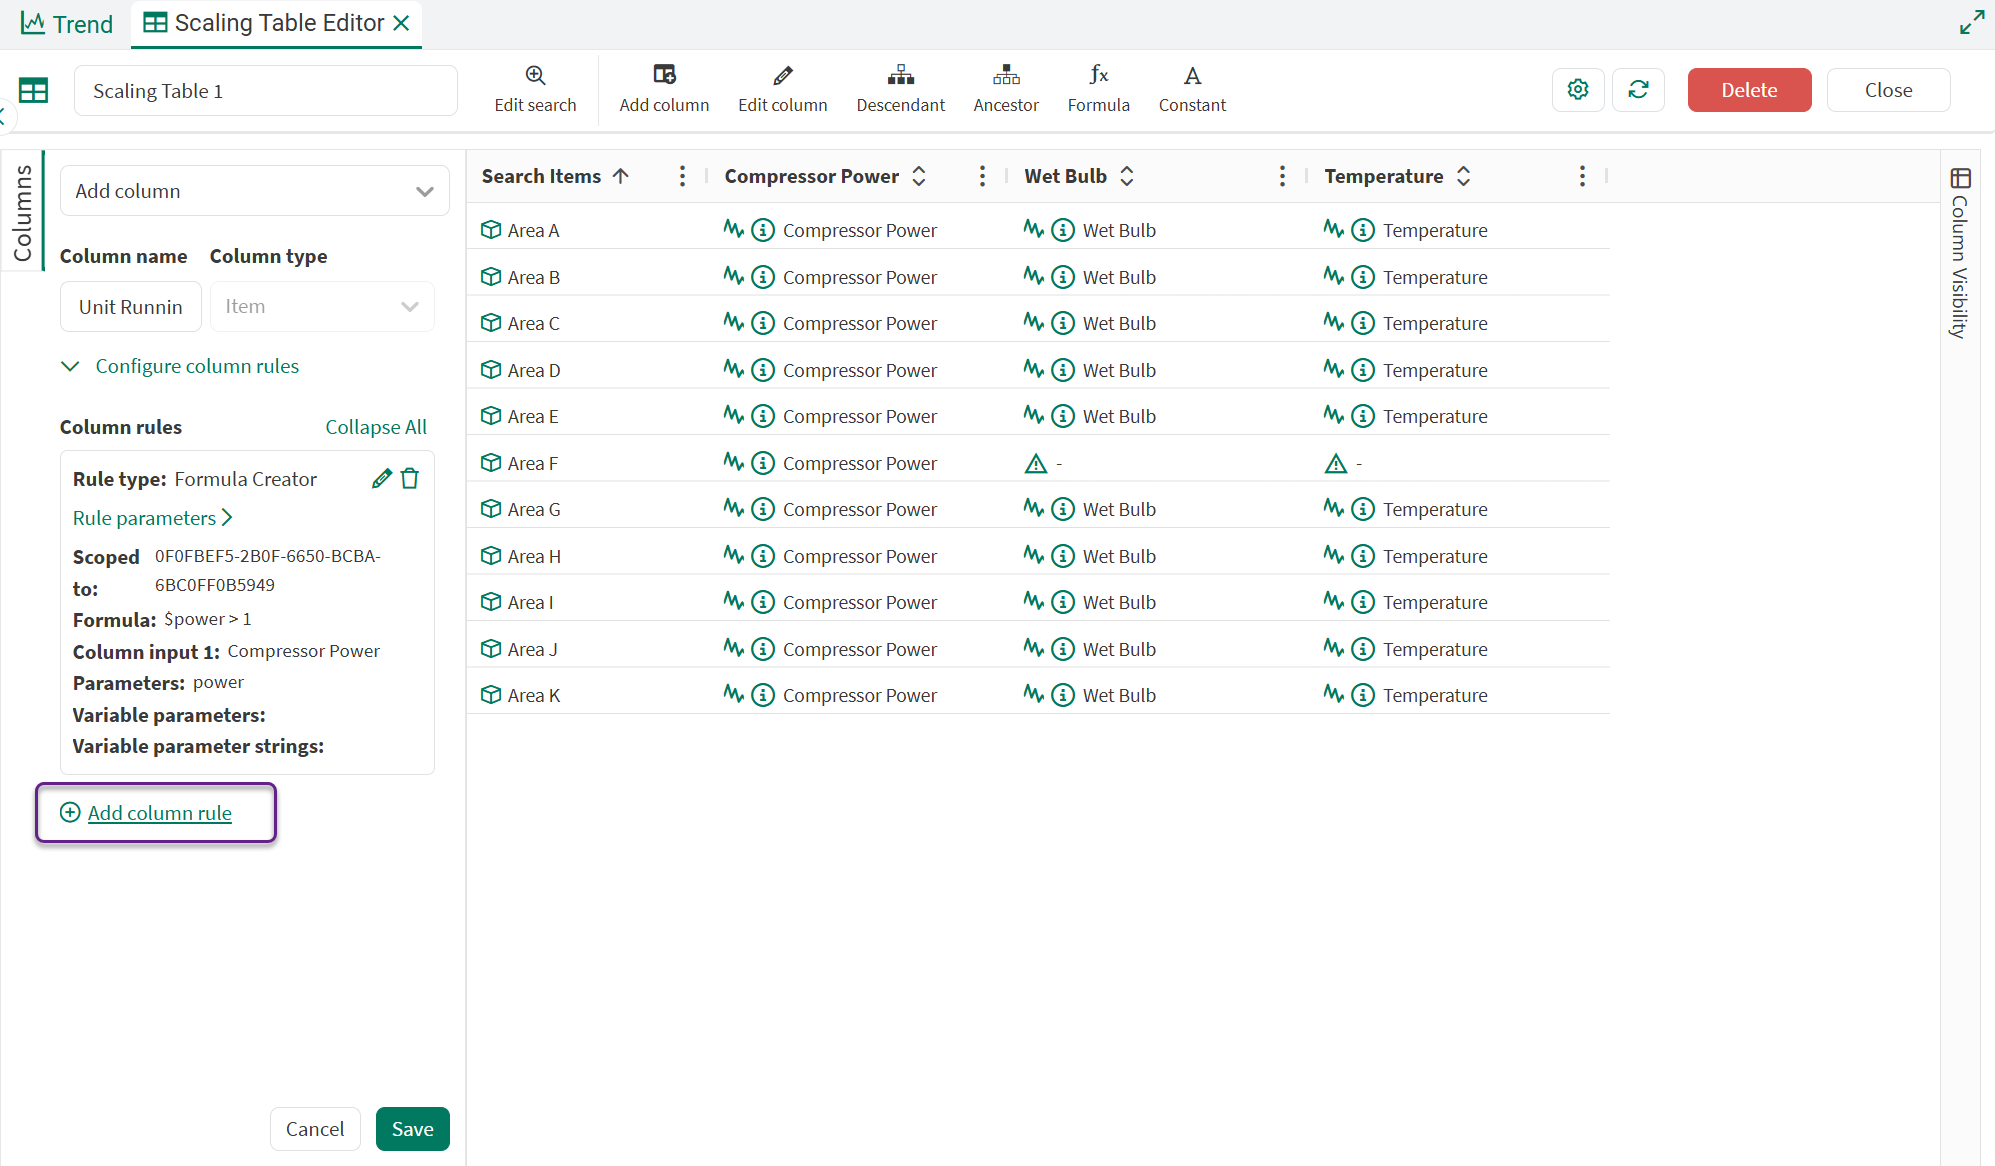
Once you have some signals, conditions, and/or scalars in your table, one of the most commonly used rules is the Formula Creator. Similar to the Formula Tool in Seeq Workbench, this allows you to create new calculations for all of the applicable rows of your table. The formula syntax is the same that you use in the Formula Tool.
Fallback rules can also be applied to any column in the Column Rule Editor. The first Column Rule specified will be tried first. If that does not apply to all of your items, you can add as many rules as necessary to fill out all of the rows for that column. This is like an if-then structure. If Rule #1 can be applied it will, if not try Rule #2 and so on.
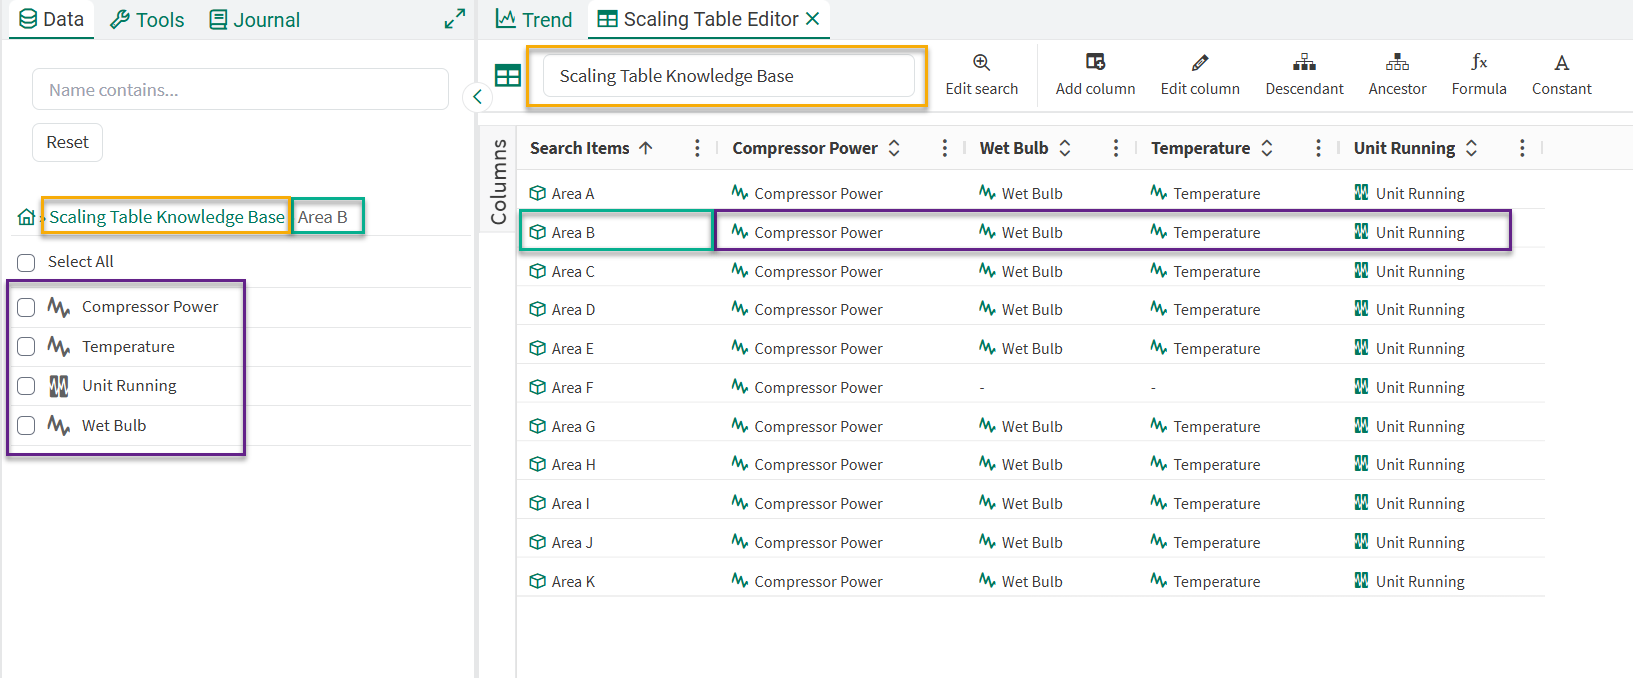
Using Items
Once you’ve configured your analytics in a Scaling Table, you can simply search for them via the Data Pane search modal or navigate the table by clicking into it, which will reveal a hierarchical representation of the rows in the table. Check out more details here.

For a step-by-step guide of a simple workflow using Scaling Tables, check out this page.