
This simple walk through will guide you through how to use Tree Builder to organize a large collection of process signals into reusable hierarchies for data discovery and scaled analytics.
In this example, we are working with reactor data from multiple sites. The source signals do not use a consistent naming convention, and some of the metadata needed by end users is not available on the signals themselves. We will create a reusable metadata table, publish multiple tree views from that table, and then use one of those trees in a Scaling Table.
Note: Tree Builder is available to Seeq Enterprise customers.
Step 1: Define your search
Tree Builder uses a bottoms-up approach. Start by finding the signals, conditions, or scalars that you want at the lowest level of the tree. The items returned by your search become the Search Items in the Tree Builder table.
For this example, we want to find the signals associated with our reactors. From the Tree Builder Overview page, select Create and give the Tree Builder table a descriptive name, such as Reactor Monitoring.
There are several ways to find the items you want to organize:
-
Use Property Search to search by Name, Description, Datasource, or another custom property.
-
Use Start with an Asset to select signals, conditions, or scalars below an existing asset.
-
Use Stored Table to import a CSV containing signal identifiers and metadata.
-
Use Manual Selection to select a specific set of items.
-
Use another Tree Builder table or tree as the starting point for a new structure.
For a large or multi-source data set, you can add multiple searches and include or exclude the results from each search. When matching duplicate tag names, add more context to the search, such as the Datasource, Description, Asset, or another unique property.
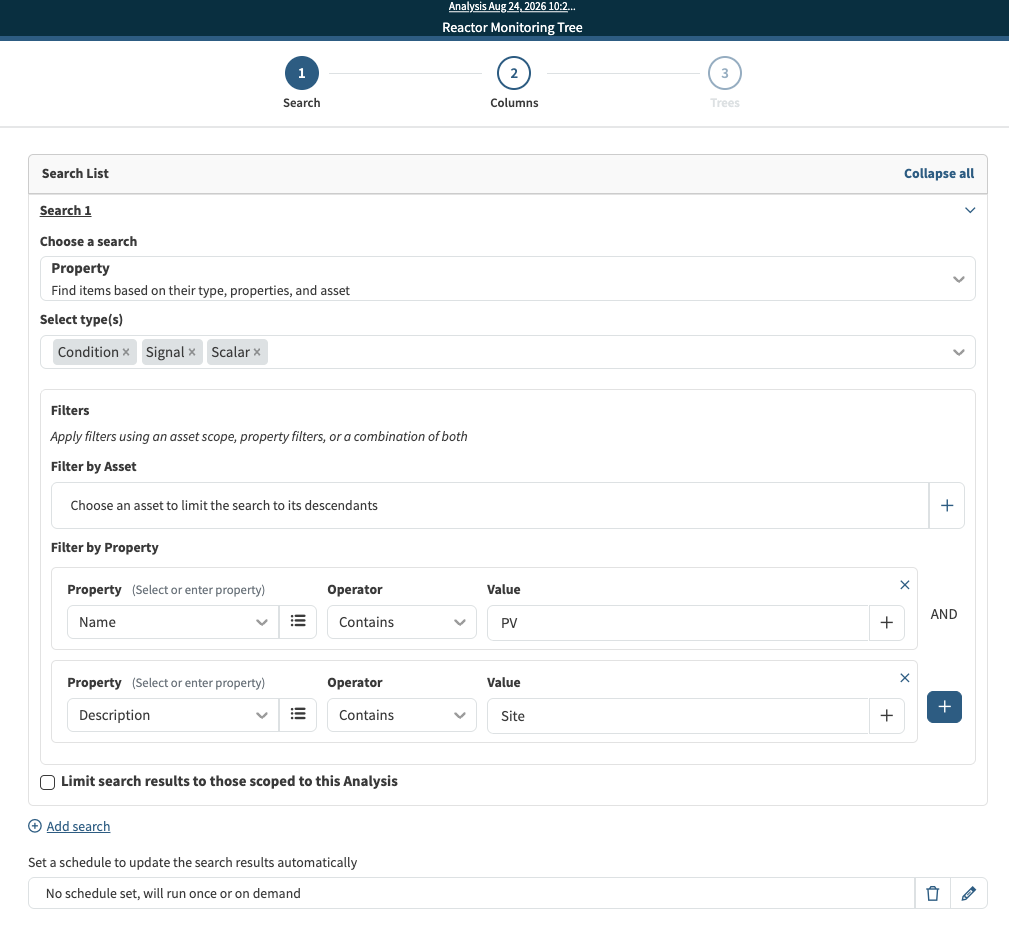
For this example, we will use a Property Search configured as follows:
-
Item types: Signal, Condition, and Scalar
-
Name and Description: The naming pattern used by the source system
Execute the search to populate the Search Items column. If new items will be added over time, you can configure the search to run on a schedule so that matching items are added automatically.
Step 2: Add context and metadata
Once the Search Items are populated, add columns that describe how the items should be organized. In this example, we want to create columns for:
-
Region
-
Site
-
Equipment Type
-
Reactor
-
Signal Type
-
Friendly Name
You can populate these columns in several ways:
-
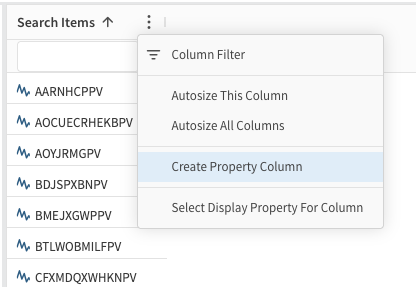
Create a property column from information that already exists on the Seeq items.
-
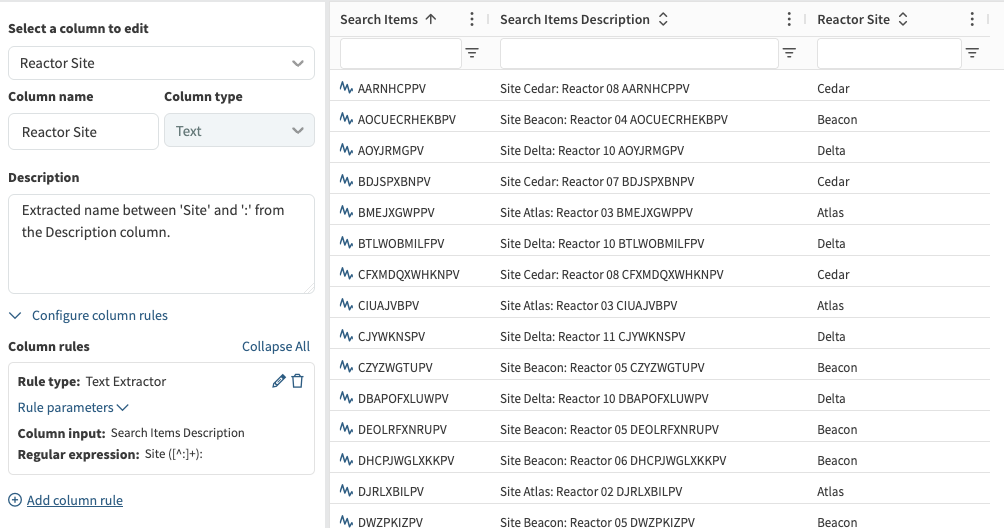
Use a text rule to split or extract information from a tag name or Description.
-
Use Find Ancestor or Find Descendant when the source items already belong to an existing hierarchy. Since this example isn’t already in a tree, we won’t use these.
-
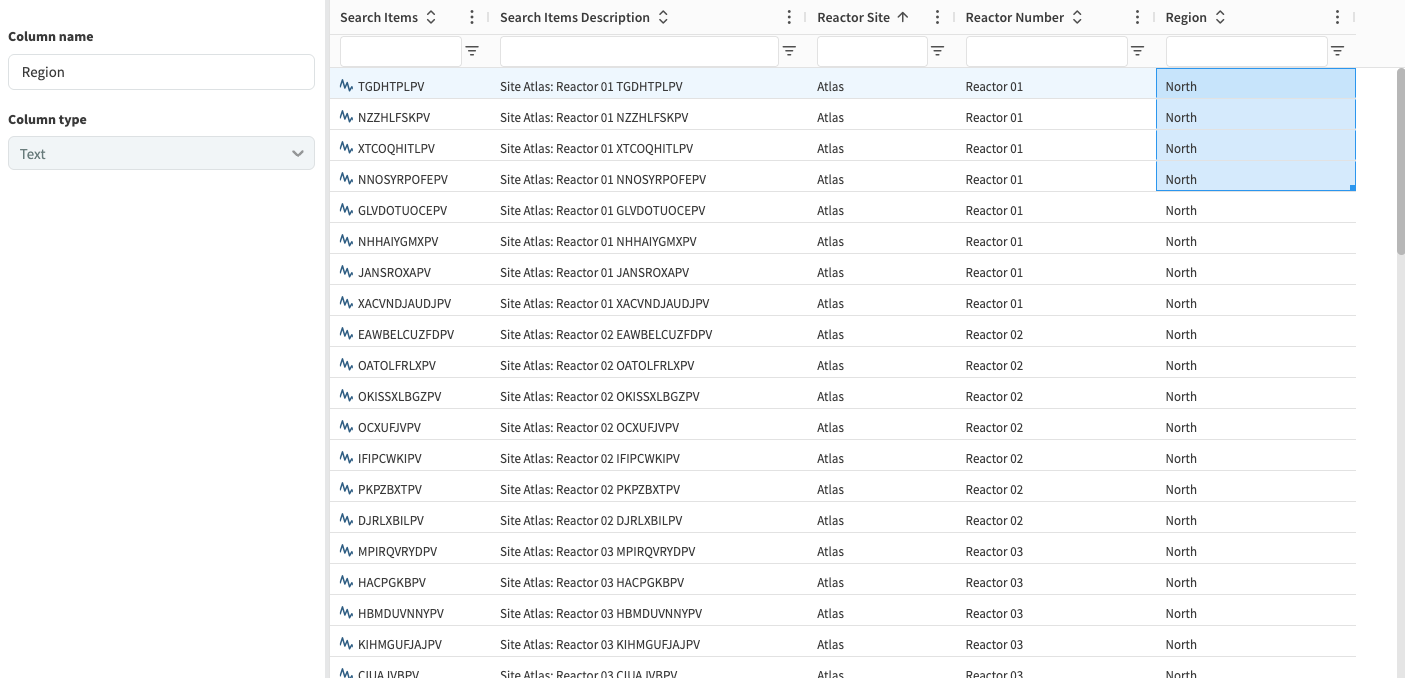
Use constants or manual entry when the information is not available on the source items. Click and drag to autofill cells in bulk.
-
Import the metadata in a CSV file along with the signal identifiers.
When importing a CSV, the column names are customizable. At least one column must identify the Seeq item to search for, such as the signal Name. The remaining columns can contain metadata that is useful for grouping, navigation, or downstream calculations.
For example, a CSV could contain the following information:
-
Tag: The source signal name used to find the item in Seeq -
Site: The site where the reactor is located -
EquipmentType: The type of equipment -
Reactor: The reactor identifier -
SignalType: The measurement represented by the signal -
FriendlyName: The name that users should see when navigating the tree
If the same source signal name appears more than once, configure an advanced search using additional criteria such as Description or Datasource. This prevents the search from matching the wrong item when different systems use the same tag name.
You can also make targeted updates directly in the table. Double-click a cell to apply a manual override, select multiple cells to enter the same value in bulk, or use drag-and-fill to copy a value across rows.
For differences between sites or equipment, use fallback rules. For example, the first rule might look for a Reactor property, the second rule might extract the reactor name from the Description, and the final rule might provide a manually maintained value. Rules are preferable to repeated manual entry when the table will be updated with new items.
Review and filter the columns to confirm that the required metadata is present before creating the tree. Empty or incorrect grouping values can result in missing or unexpected branches in the final hierarchy.
Step 3: Create the first tree
After the metadata columns are ready, select the Trees tab and click Create.
For this example, create a tree named Reactor Monitoring by Location. Add the levels in the order that users should navigate them:
-
Region
-
Site
-
Reactor
-
Search Items
You can create the levels in either of two ways:
-
Add and reorder levels in the Tree Levels section.
-
Drag columns into the grouping area at the top of the table.
Expand the levels to validate the resulting structure before saving it. If you created a Friendly Name column, select it as the Alias for the Search Items.
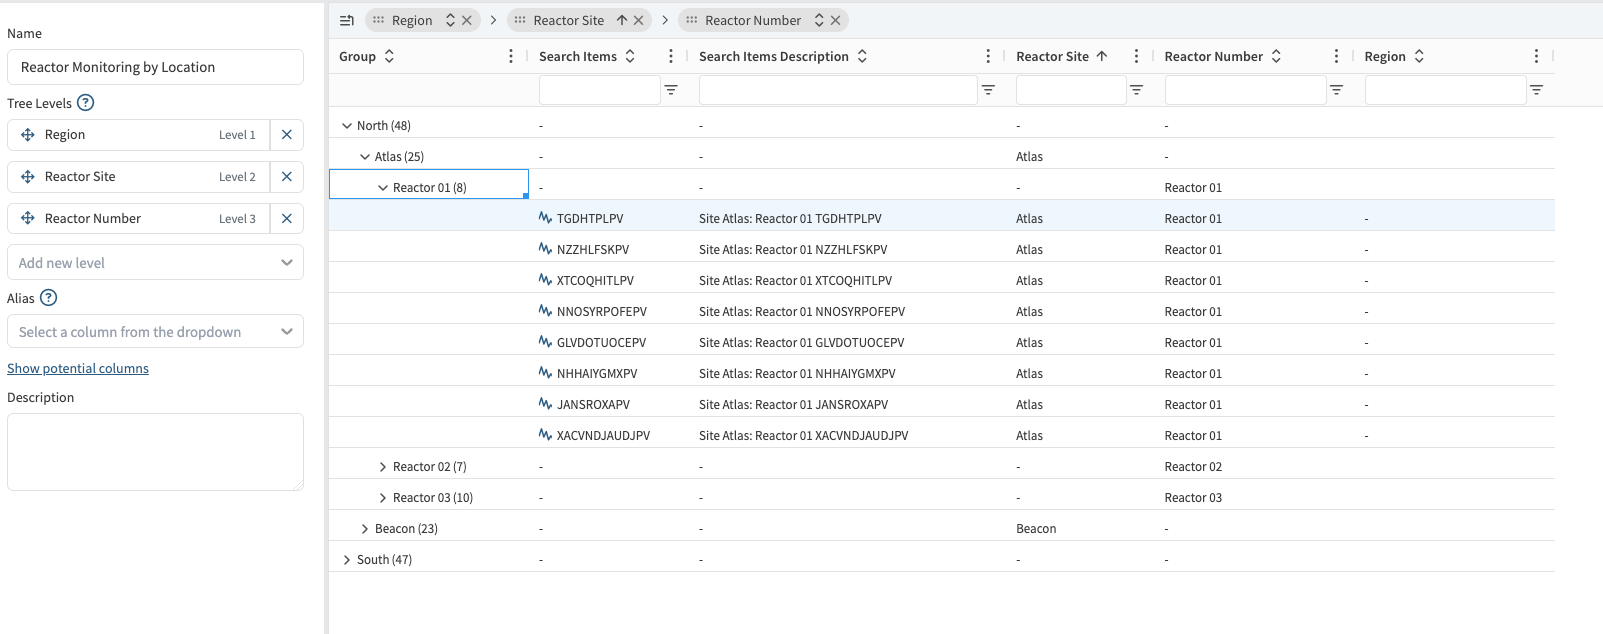
The Alias improves discoverability without changing the original Seeq item. This is important when the source item name is controlled by a historian or another source system. The same source item can also appear in multiple Tree Builder trees with different aliases.
Save the tree, then return to the Trees pane to review the published structure. The tree is now available in Workbench for users to navigate to the reactor signals they need.
Step 4: Publish another view from the same table
A single metadata table can support multiple trees. This allows different teams to use the same underlying item mapping while navigating the data in the way that best fits their work.
For example, create a second tree named Reactor Monitoring by Equipment with the following levels:
-
Equipment Type
-
Signal Type
-
Site
-
Reactor
-
Search Items
This view may be more useful for a reliability engineer who wants to compare all pumps, reactors, or other equipment types. A process engineer may prefer the location-based tree created in the previous step.
You can create additional trees that are:
-
Organized by location, equipment type, manufacturer, or another metadata column
-
Simplified or flattened by removing levels
-
Reorganized for a specific team or user persona
-
Built from a combination of existing trees and newly searched items
Each tree retains its own grouping and filtering while using the same Tree Builder table. When appropriate, configure the table as Global so it can be used across workbooks. Otherwise, keep it scoped to the workbook or team that owns the use case.
Use the table’s sharing controls to give users permission to view or modify the table. Users who only need to consume the resulting hierarchy can be given access to the tree without maintaining the underlying metadata table.
Step 5: Use the tree to scale and analyze the results
The new trees are available in Workbench just like other Seeq hierarchies. Use them to navigate the data, select signals for an investigation, and make the source context visible to other users.
To apply calculations across the reactor fleet, create or open a Scaling Table and use the Tree Builder tree as the starting point. From there, you can select descendants and apply calculations or templates across the matching rows.
For example, a Scaling Table could apply a reactor-monitoring template that creates conditions for:
-
Pressure outside the expected operating range
-
Temperature deviations
-
Missing or short-duration flow events
-
Batch or phase performance changes
When a calculation has been validated and should be part of the reusable hierarchy, use Add items to Tree(s) in the Scaling Table toolbar to add eligible calculated items back to the shared Tree Builder table. The update is available to current and future trees that use that table, while each tree keeps its own organization and filtering.
The resulting workflow separates the two parts of the use case:
-
Tree Builder creates and maintains the structure and metadata.
-
Scaling Tables deploy calculations across the structured items.
-
Workbench and Vantage provide the downstream investigation, monitoring, and visualization workflows.
This same methodology can be used to organize and scale data across multiple sites, data sources, equipment types, or teams without requiring custom Python code or a single centrally maintained hierarchy for every use case.