What's New?
This page documents new features and capabilities as they become available to users. You will also find this information in Seeq from the blue megaphone on the bottom right corner of the home screen.
The announcements in Seeq will always be up to date with the version of Seeq you can access. If you see something on this page that is not yet announced via your megaphone, it is likely because you are on an older version.
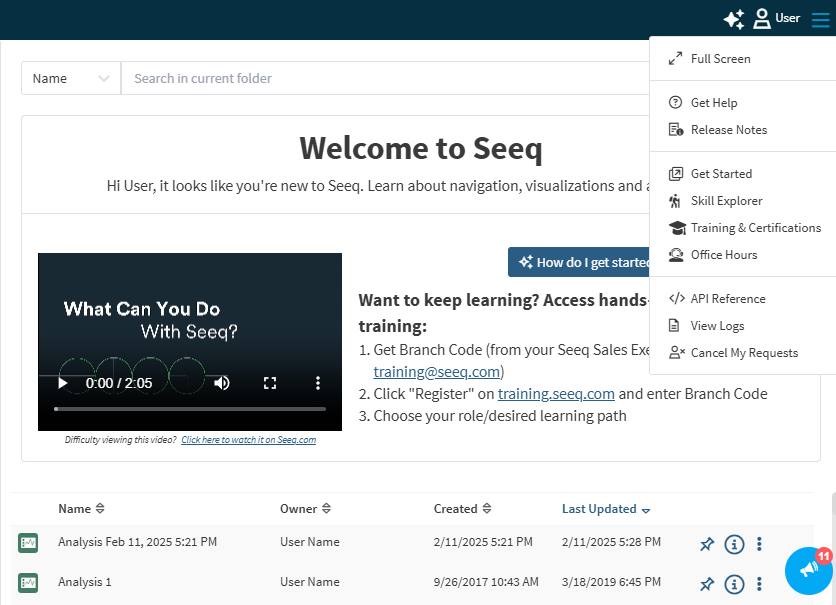
You may also have access to Release Notes from the hamburger menu in the upper right corner, along with other helpful links.
VANTAGE Gantt visualization in QuickTrend
Gantt chart view is now an available option in the Vantage QuickTrend view menu, adding to Trend, Chain and Capsule Views. Gantt view allows you to see only the capsules of the selected conditions in separate lanes for easy comparison. Gantt view supports multi-row select as well as grouped row selection (e.g. Asset). A maximum of 10 conditions can be viewed simultaneously in Gantt view.
VANTAGE Modifying context start and end in Vantage
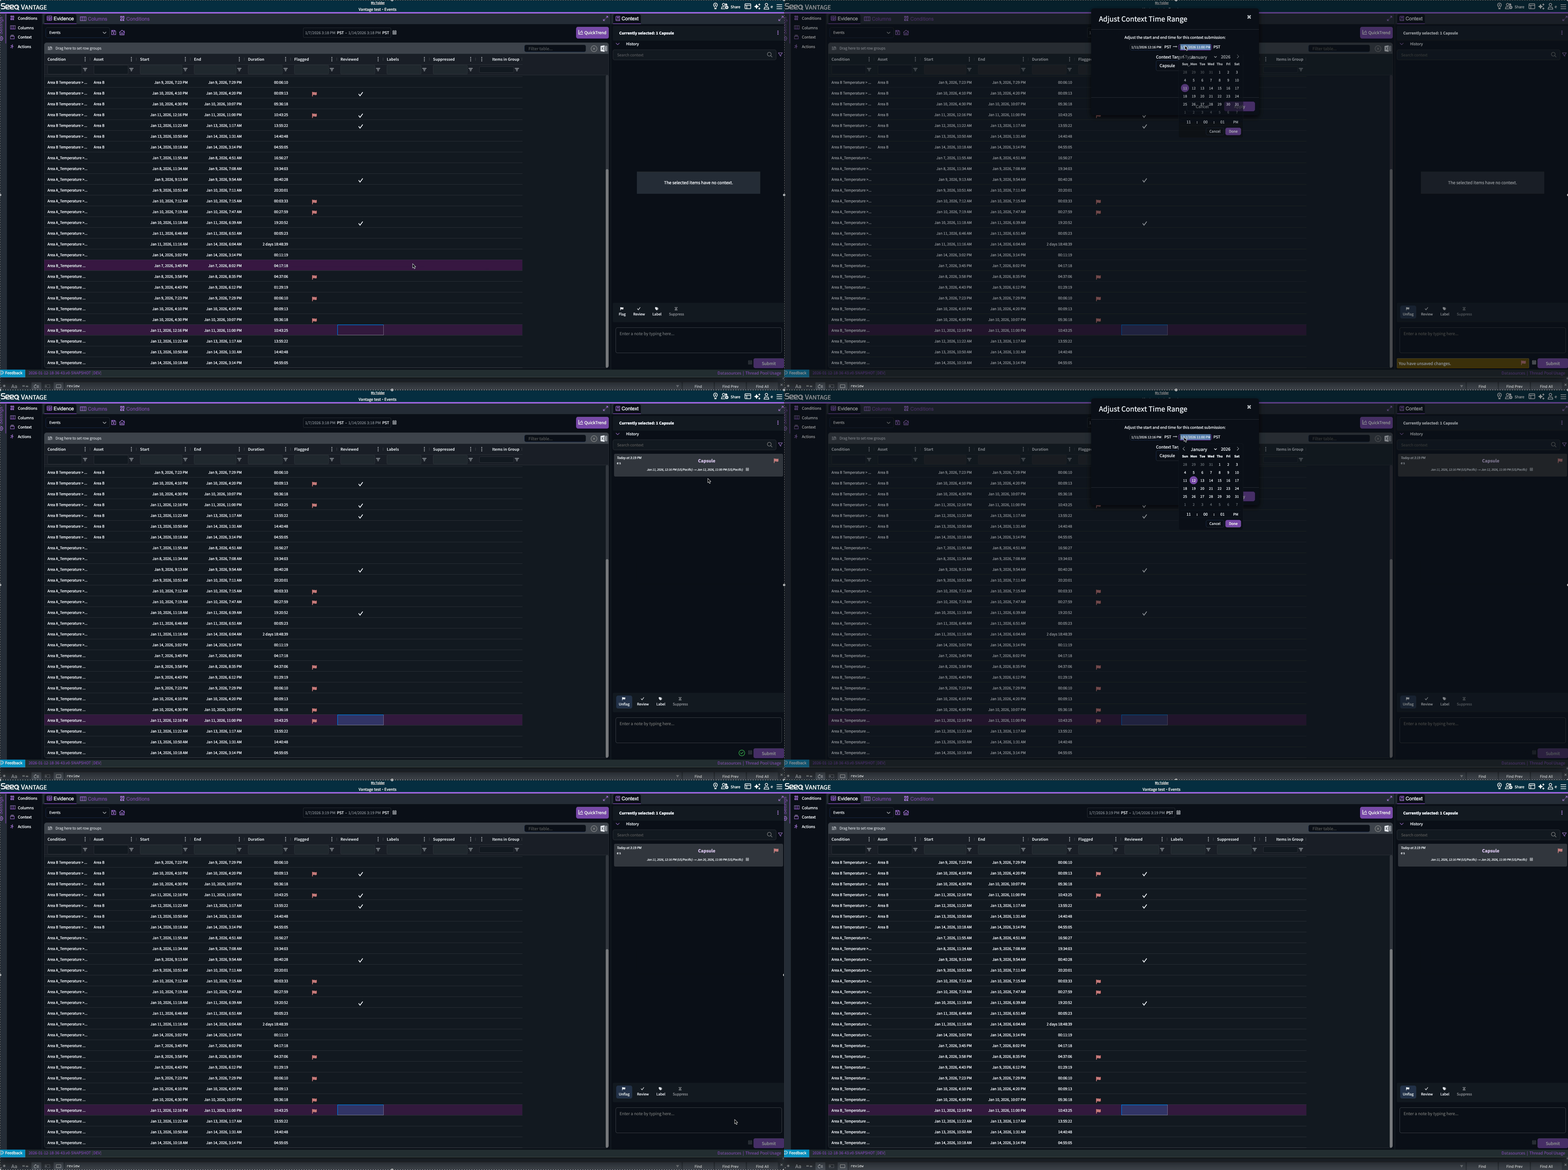
You can now set the start and end of context such as comments, flags, etc to your desired time range. You may do that from the context staging area when creating new context, or from the context Timeline after the fact. This feature is behind a feature flag. As your admin to enable it if desired.
VANTAGE Mentions in Comments
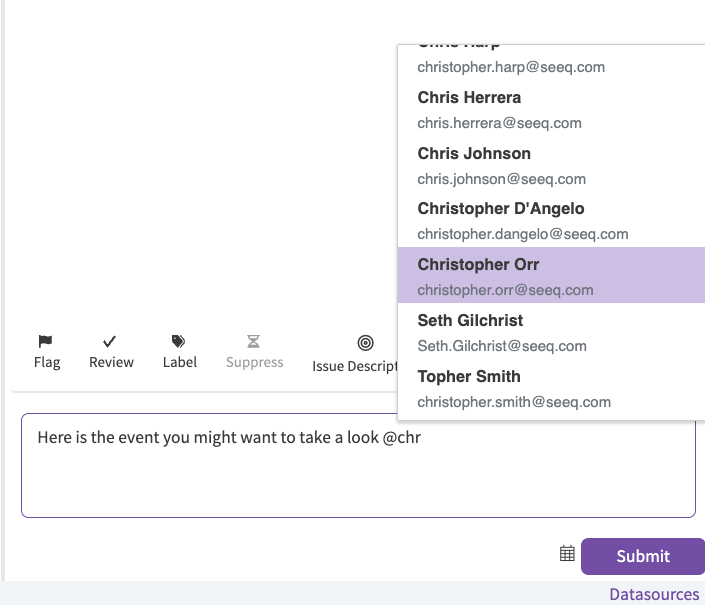
You can now mention other users when adding comments or notes in the Vantage context panel using the standard @user syntax. Mentioned users will receive an email notification containing the comment text and a direct link to the relevant Vantage room. Clicking the link restores the full room state, including row selection and scroll position, so they'll land right where the conversation is happening.
Applications to manage programmatic access
Seeq now supports Applications as a secure, user-independent way to authenticate programmatic access via service principals. Applications are the recommended alternative to Access Keys, offering clearer identity separation and streamlined permission management for API and SPy use.
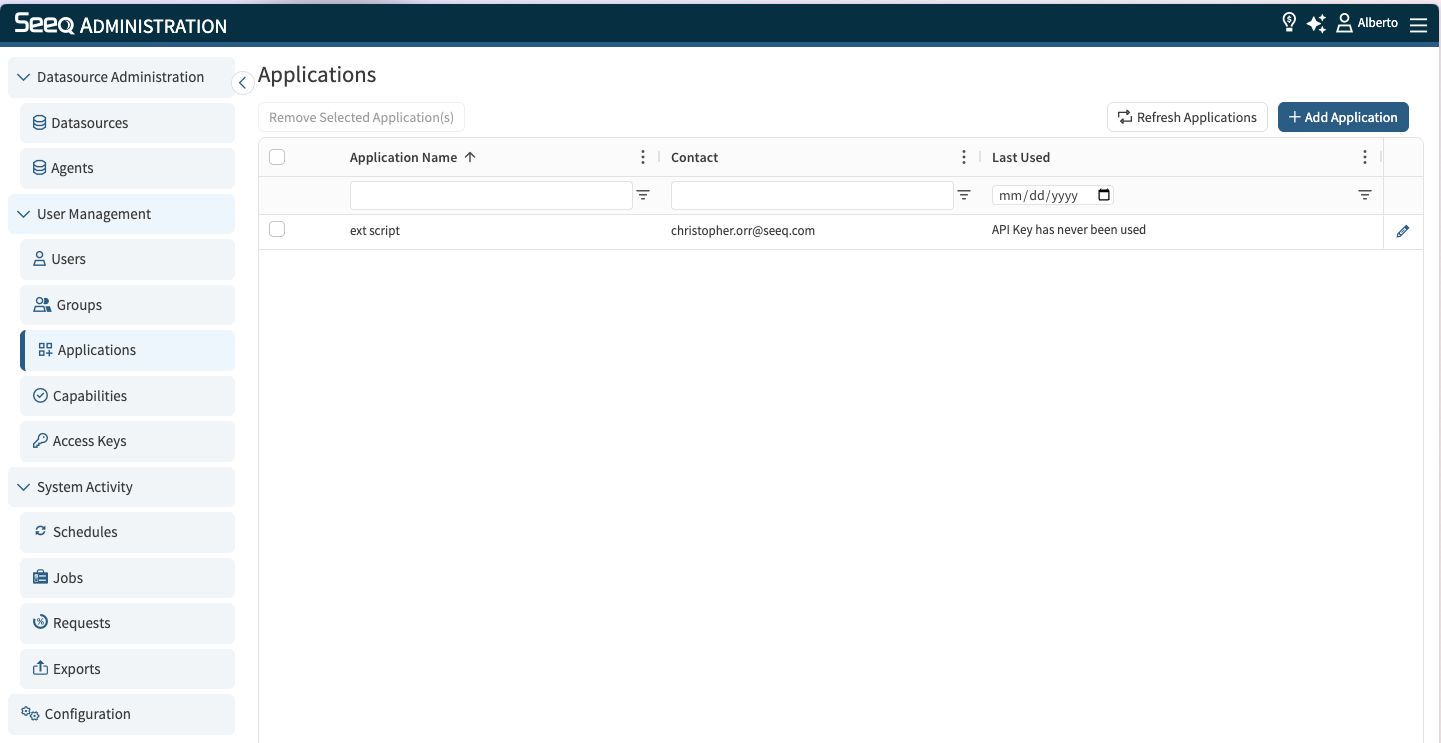
To learn more about Applications, visit: https://support.seeq.com/kb/latest/cloud/applications
AI Formula Agent better understands calculation hierarchies (Admin-only)
The Formula Agent can now request more detailed information on an entire calculation hierarchy to assist in understanding and troubleshooting. This is available wherever you use the Formula Agent, including in the ‘Explain with AI' and ‘Debug with AI’ buttons in the Formula Tool. This functionality is currently limited to users with the ‘All Administration’ capability.
Help Center Modal
We’ve refreshed the Help experience with a brand-new Help Center that brings everything together in one easy-to-navigate spot.
The Help panel has been redesigned and now includes direct access to the Skill Explorer, Training and Certifications Center, API Reference, and the Knowledge Base.
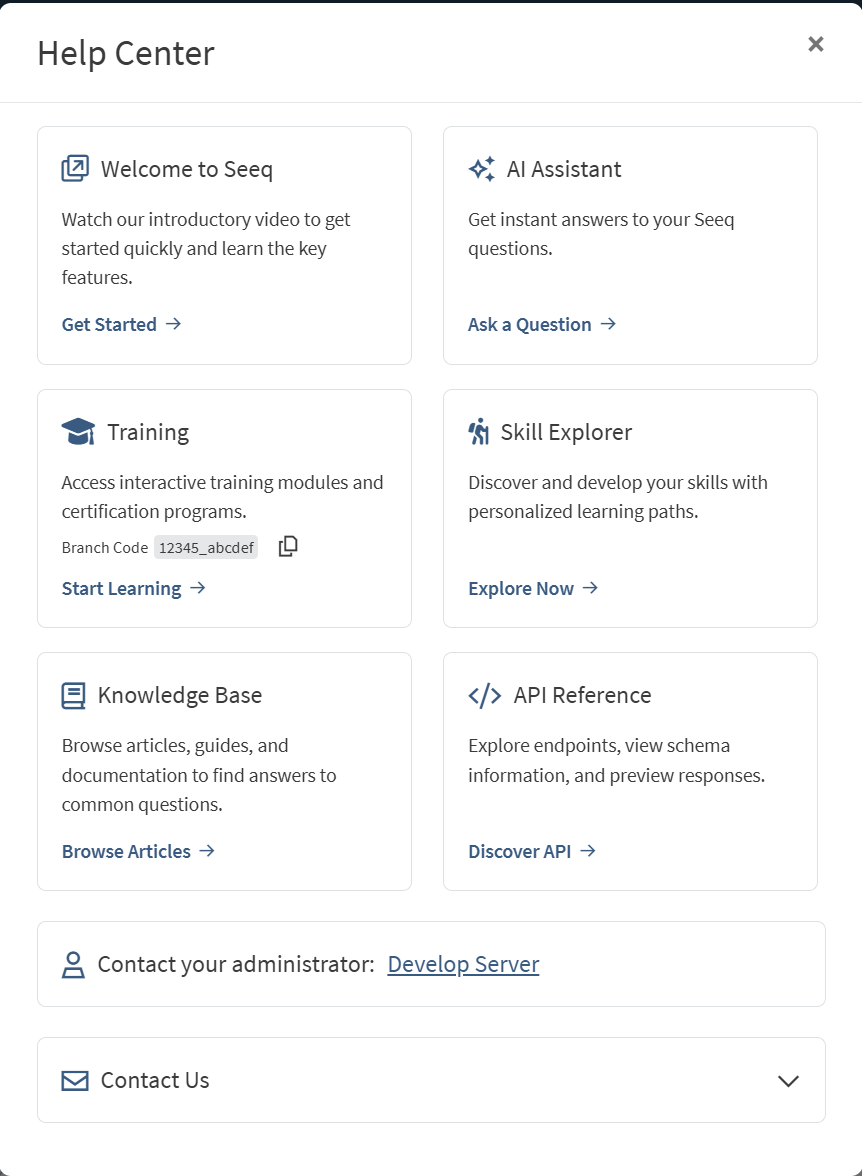
AI Explain and Debug Buttons in the Formula Tool
Use the new ‘Explain with AI’ and ‘Debug with AI’ buttons in the Formula tool to quickly call on the the Formula agent to help understand or troubleshoot a tricky formula.
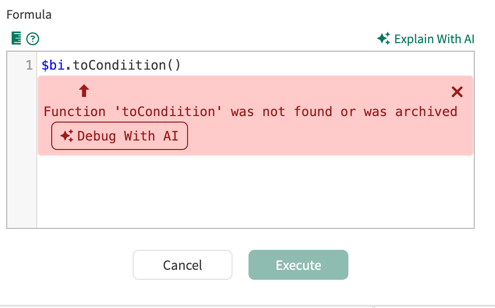
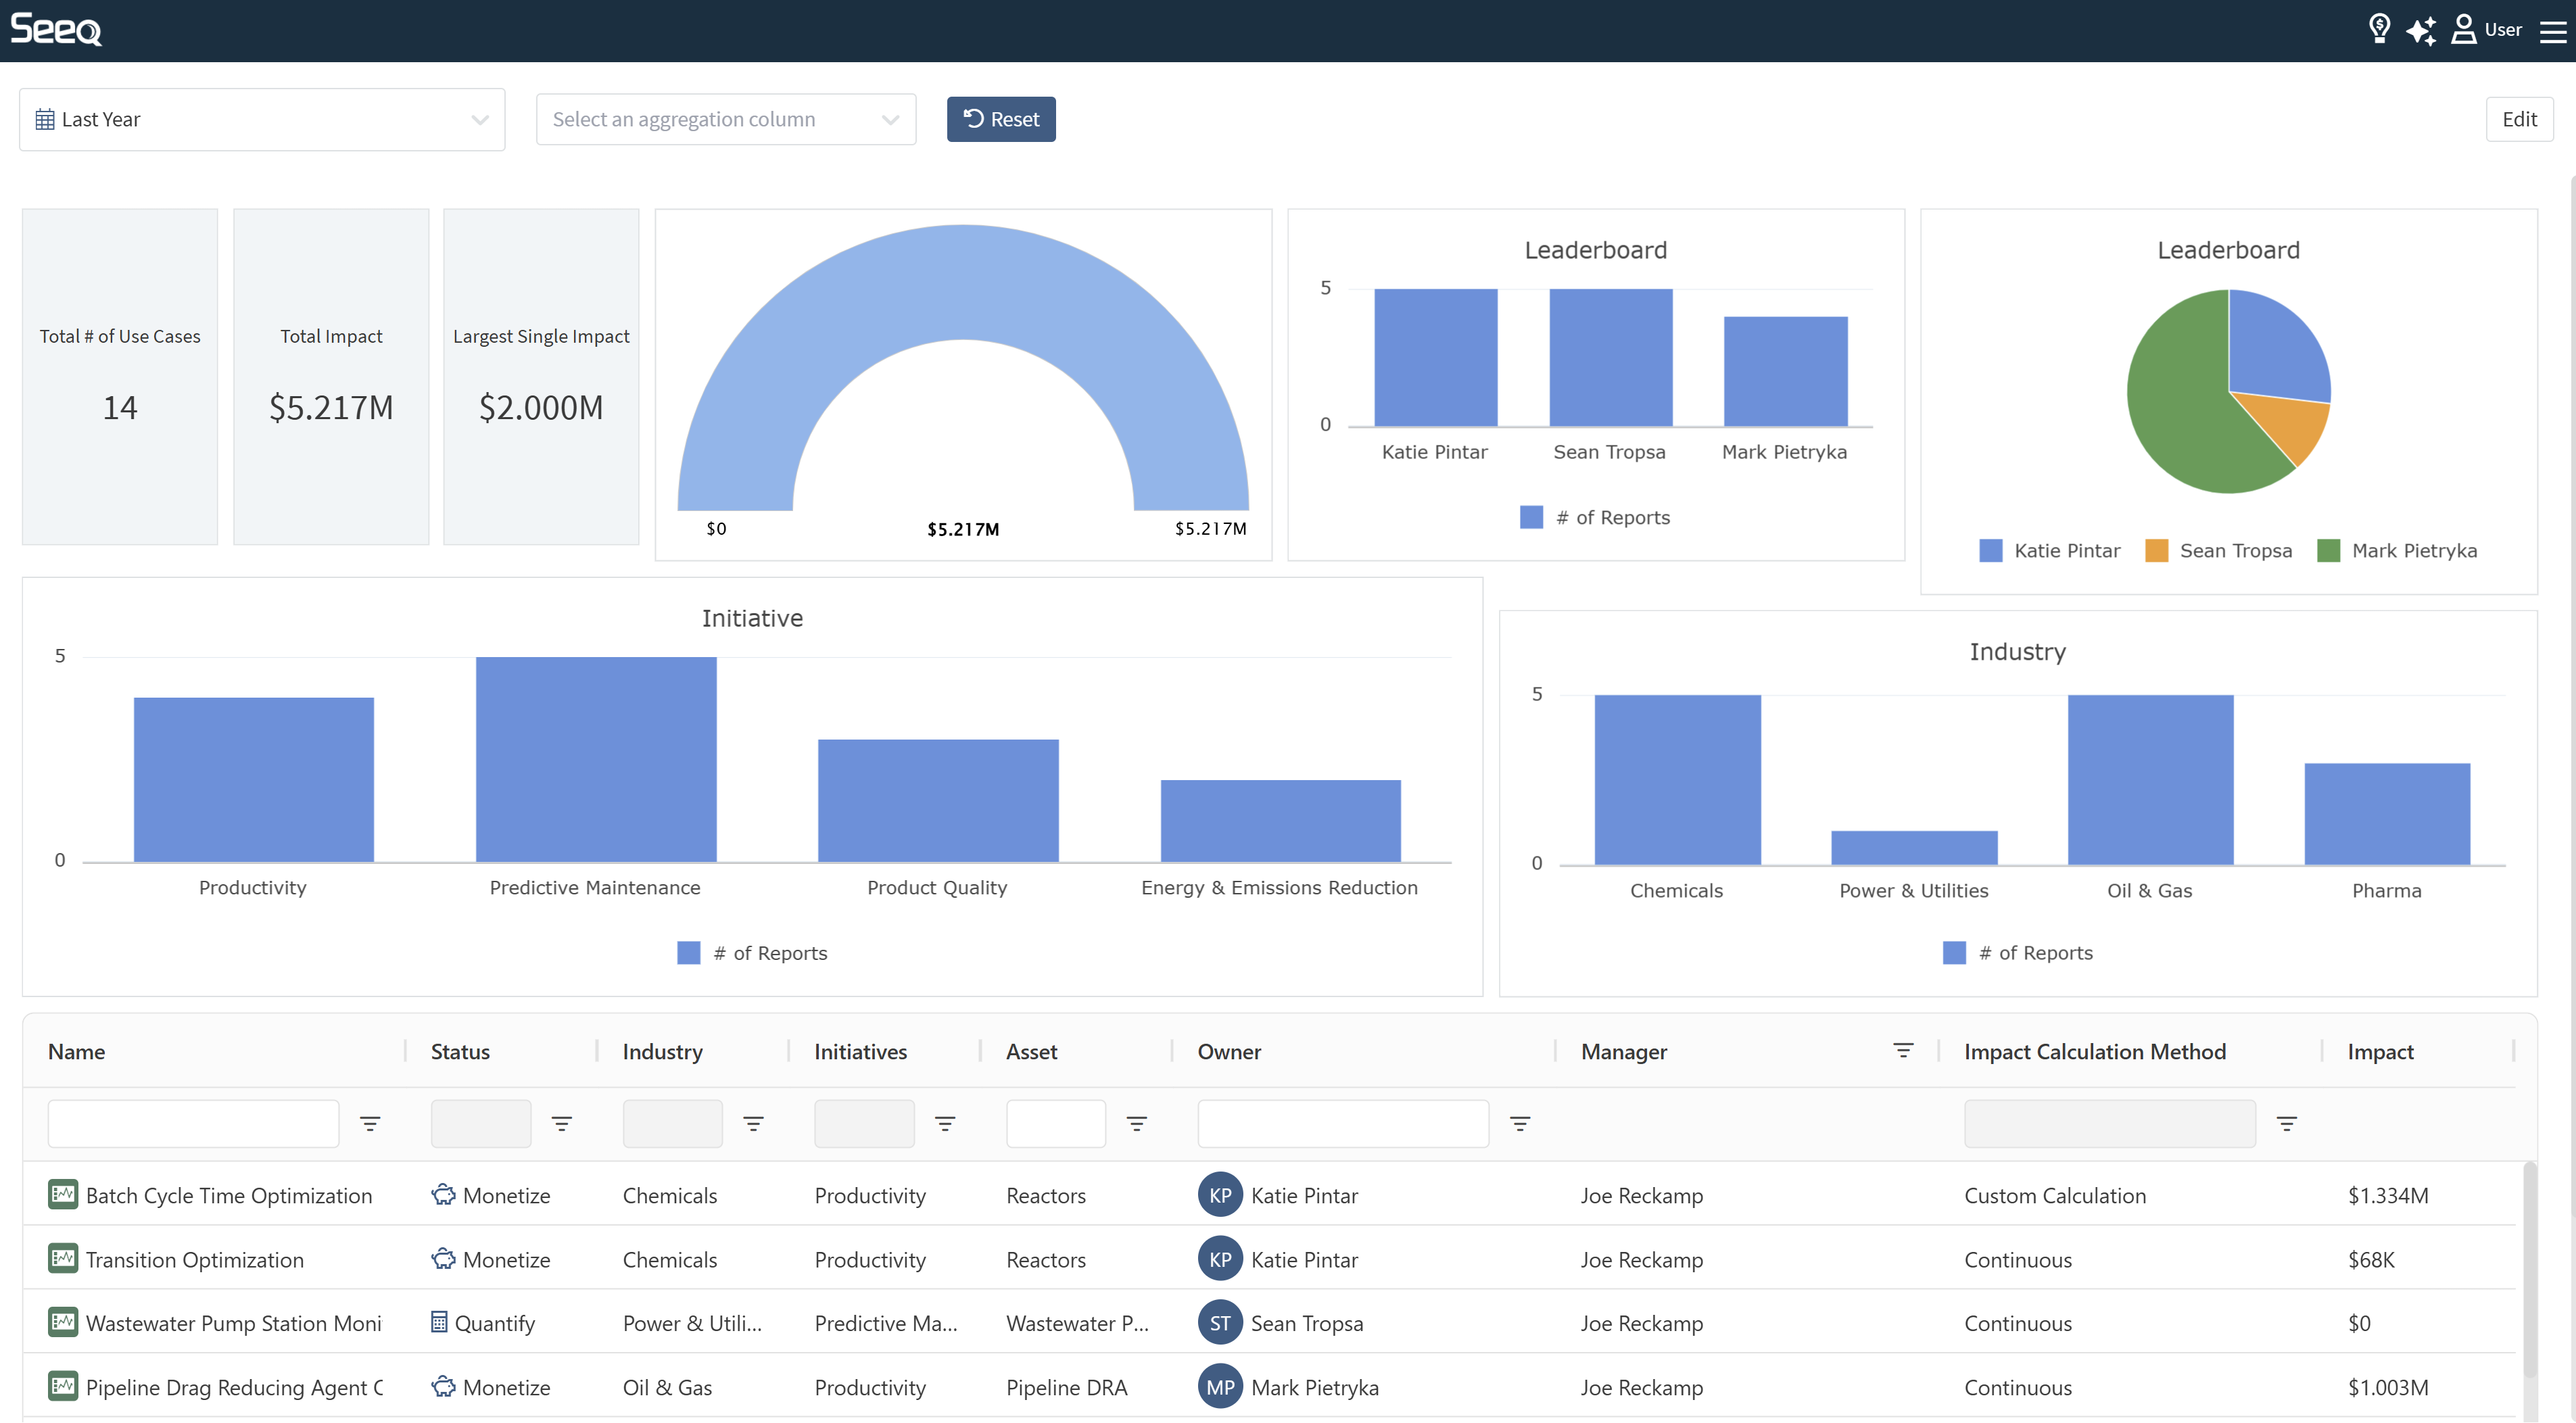
Impact Report Maps are now zoom-able
Ever wanted to zero in on just a specific region’s Impact on the Impact Reports Map? Now you can! The map (that can be added via the “Configure” button) in Impact Reports is now zoom & draggable! If you would like to save the applied zoom & drag settings you can do so by switching to “Edit” mode and then adjusting your map to display as desired. Changes made in “view” mode will not be persisted.
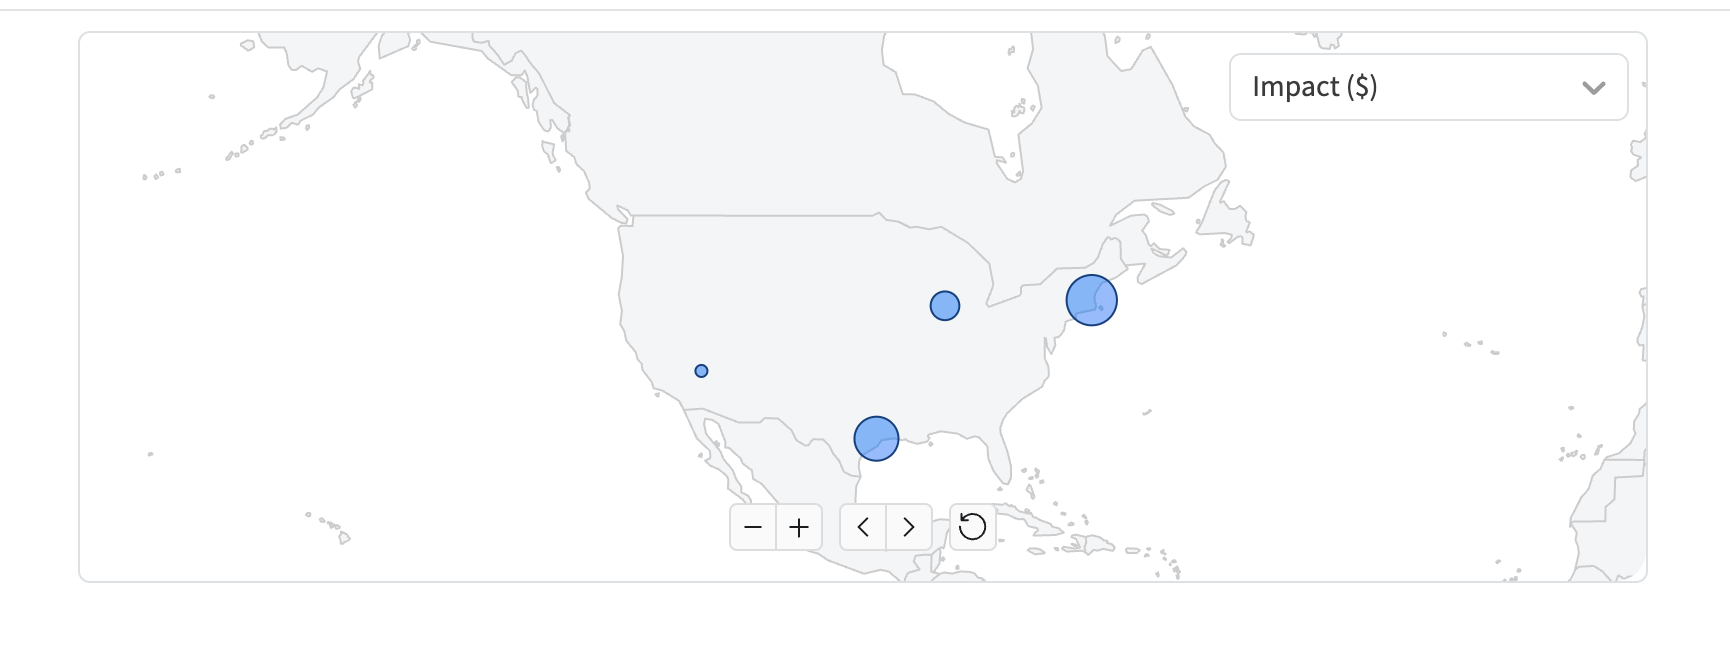
Vantage multimodal filtering for context columns
A subset of Vantage columns now allow the user to apply their desired filter to capsules, conditions, or assets separately. For instance by applying a “Not Suppressed” filter in Capsule mode, the user will only see capsules that are not suppressed, regardless of whether the source condition is suppressed. Similarly, by applying a “Not Suppressed” filter in Condition mode, they would only see capsules, regardless of suppression status, under conditions that are not suppressed. This feature currently only applies to context columns that can have independent values for capsule, conditions, and assets, namely the Suppressed, Flagged, and Labels columns. The default filter mode applies the filter to all capsules and groupings the same way the basic filtering did.
Access and add your own Use Cases to the AI Assistant Library
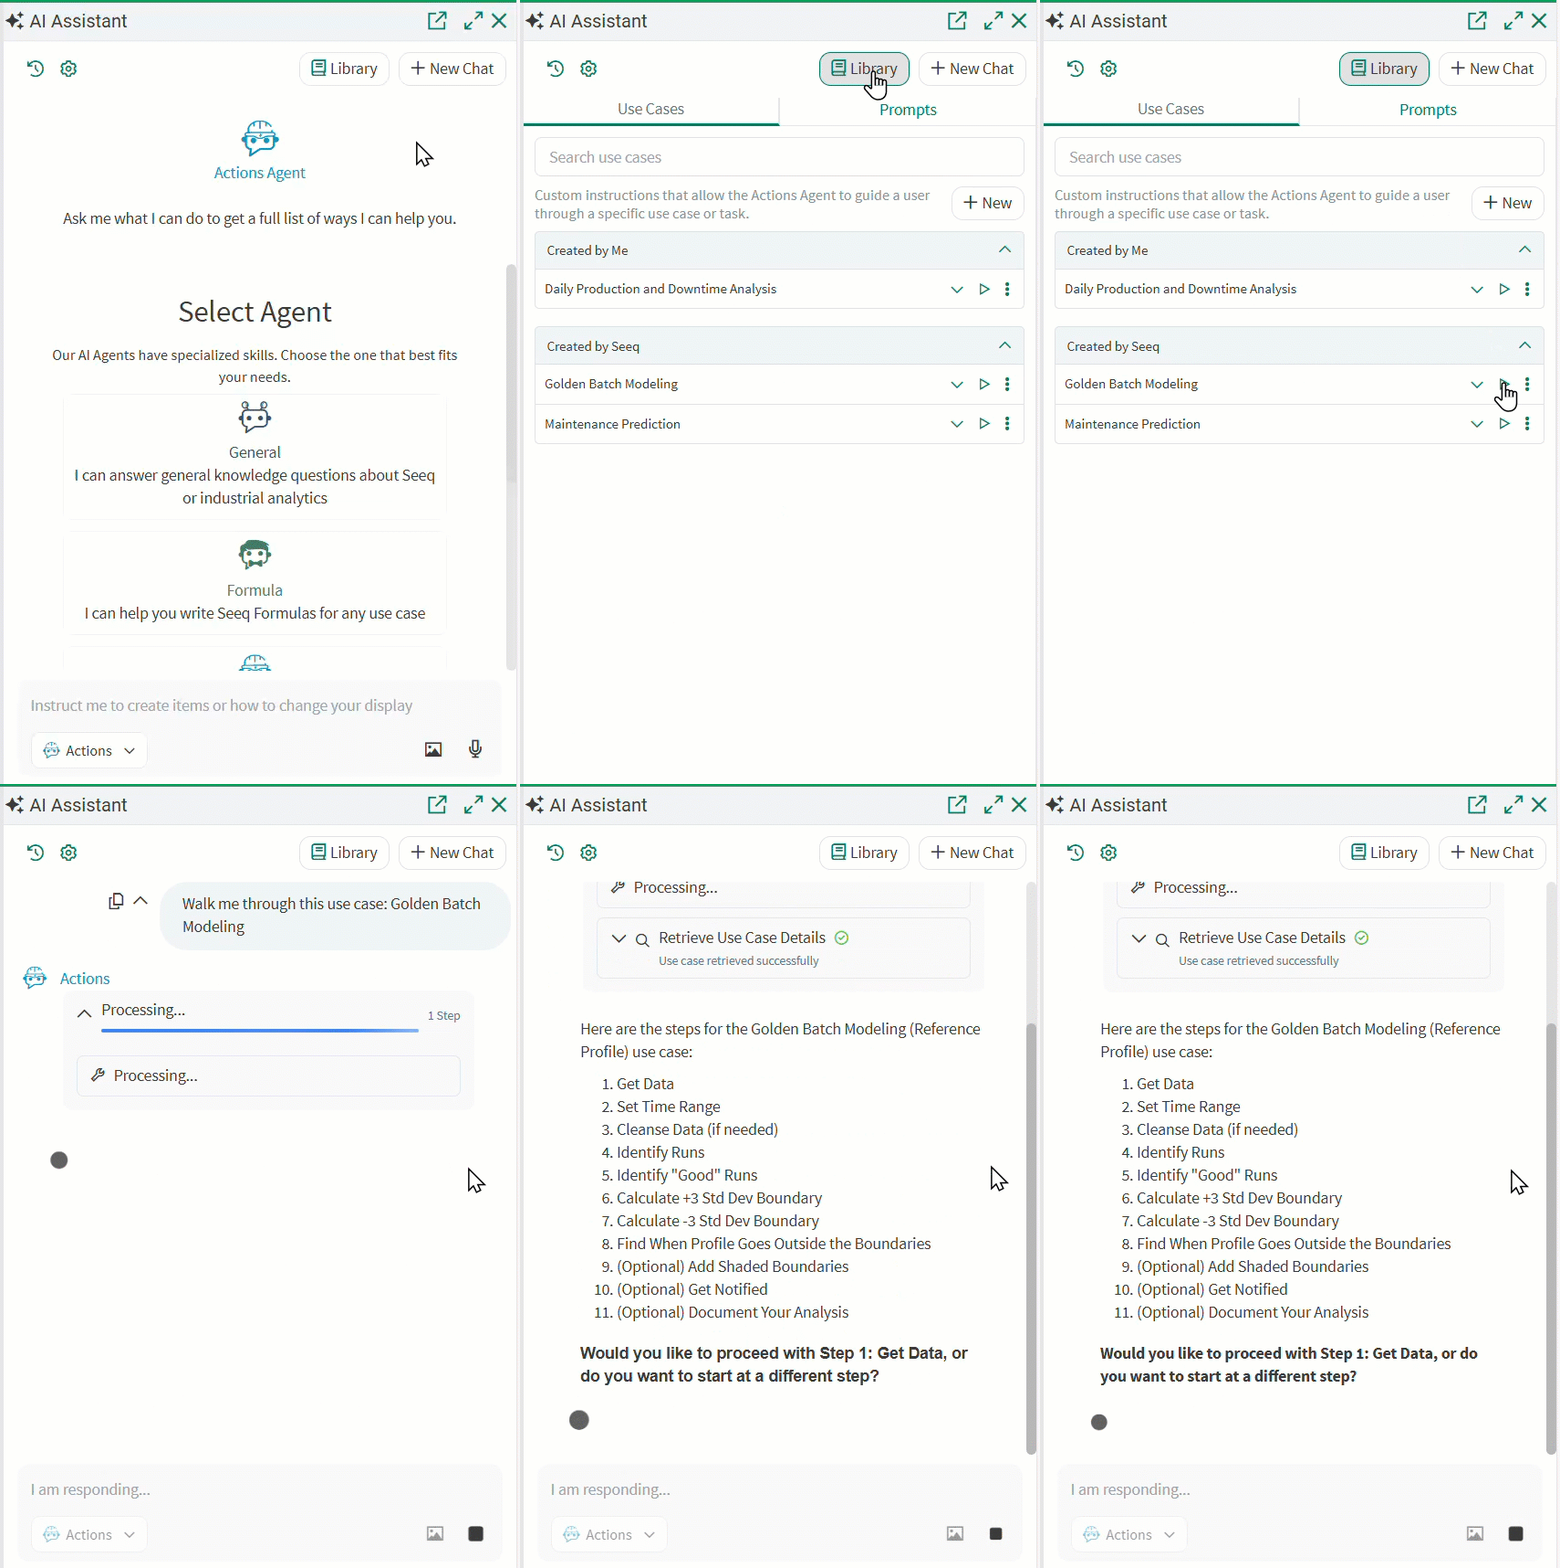
The Actions Agent in the AI Assistant can help users follow specified instructions to perform an analysis. We will be growing a curated list of use cases in this Library, but users can create their own and share them with others in their organization. Administrators will see all use cases across the system.
Use cases will walk users through each step using the Actions Agent, from finding data to performing calculations and sharing with others. Duplicate any use cases provided by Seeq to see how you can structure examples that you may want to build. Read more at AI Assistant - Library & Use Cases - Seeq Knowledge Base - Confluence.
Insert Vantage Views into Organizer
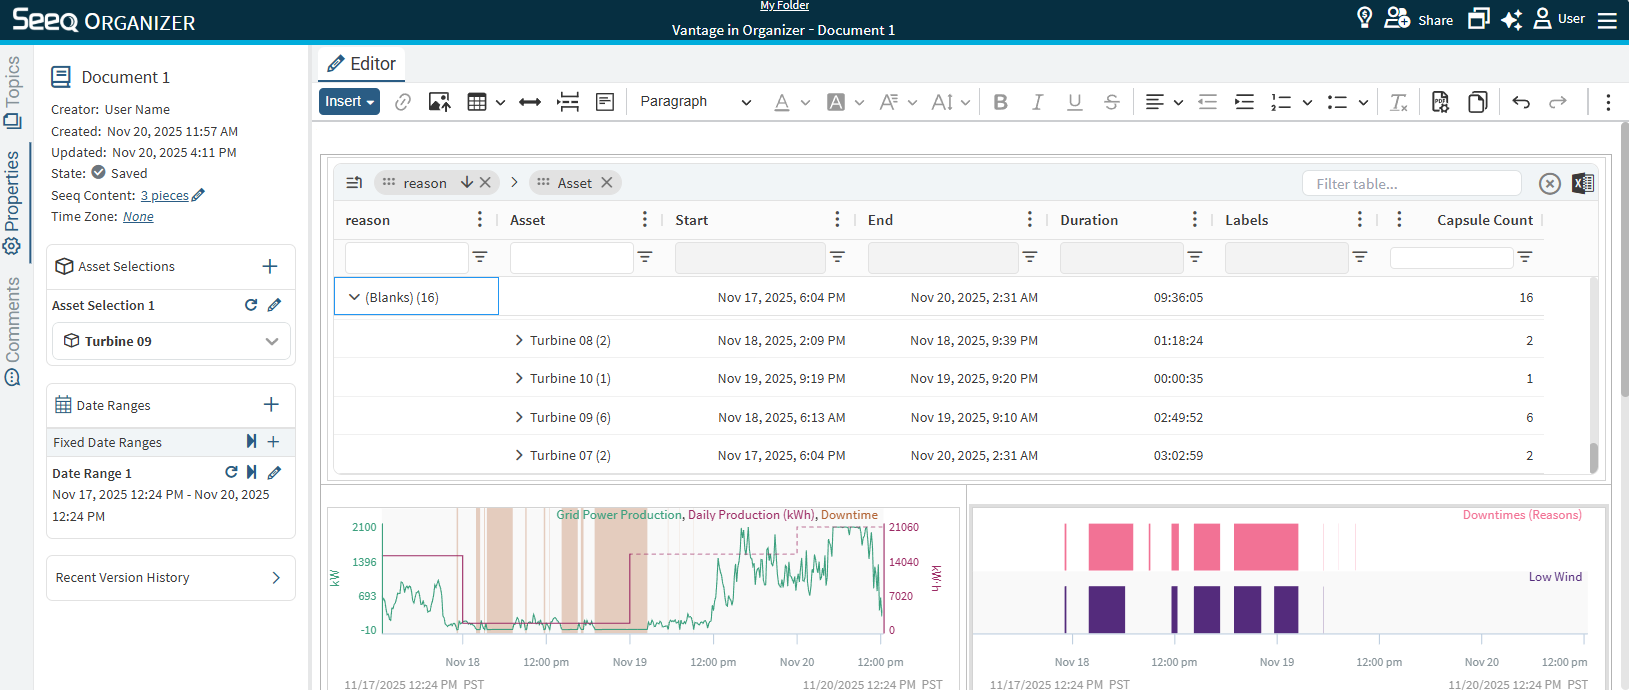
As users adopt Vantage as a place to monitor and triage events, some still have routine reporting workflows for wider awareness. Vantage tables can be inserted into Organizer Topic Documents or Dashboards so that these events with their additional context can be viewed alongside other information in Organizer or as part of existing reporting workflows. They will follow date range selection. Read more at Inserting Content - Documents.
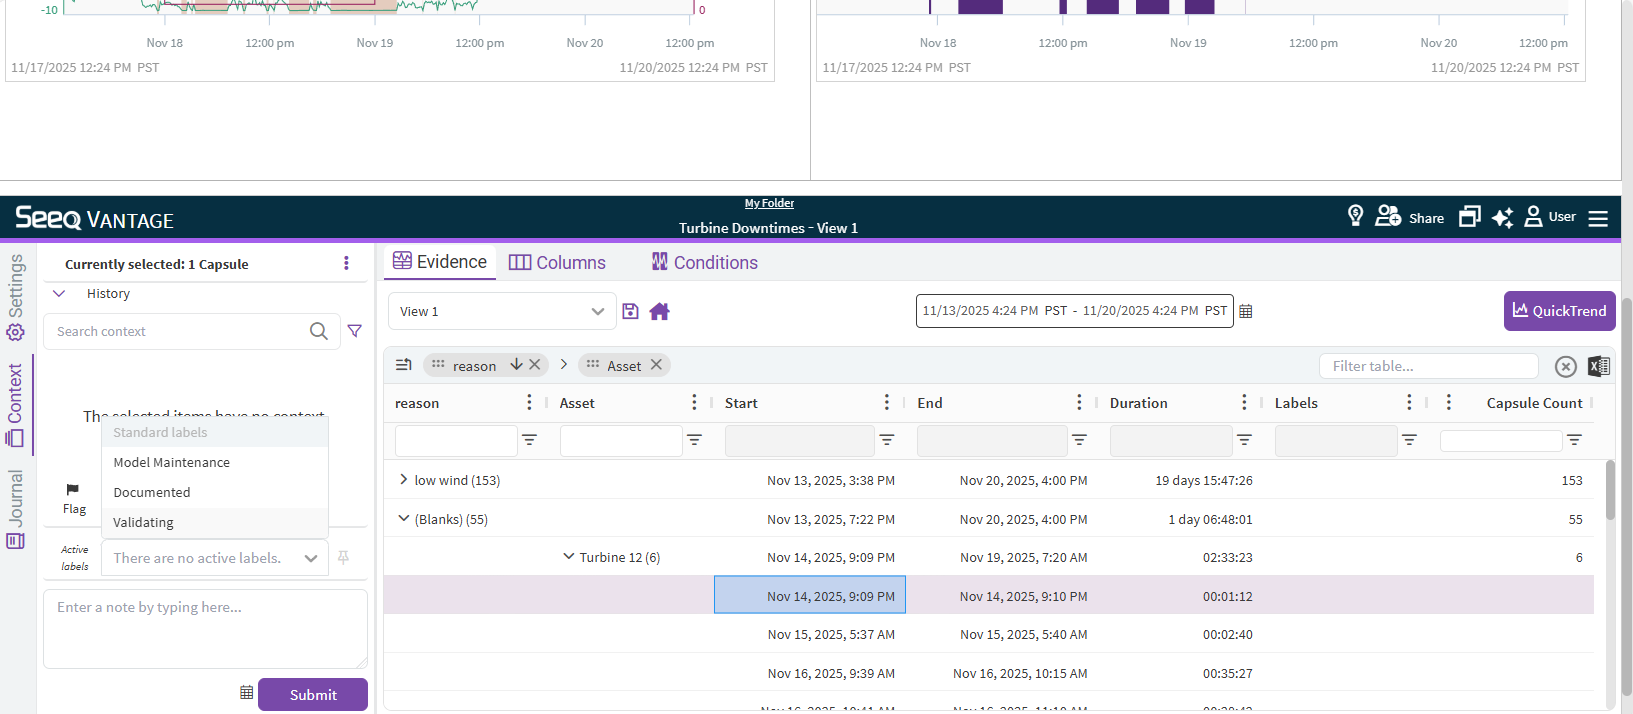
If your use case includes adding context from a presentation view Organizer Topic, you can use a relative URL to insert more than just the table.
Dashboards that pop with a bit more color
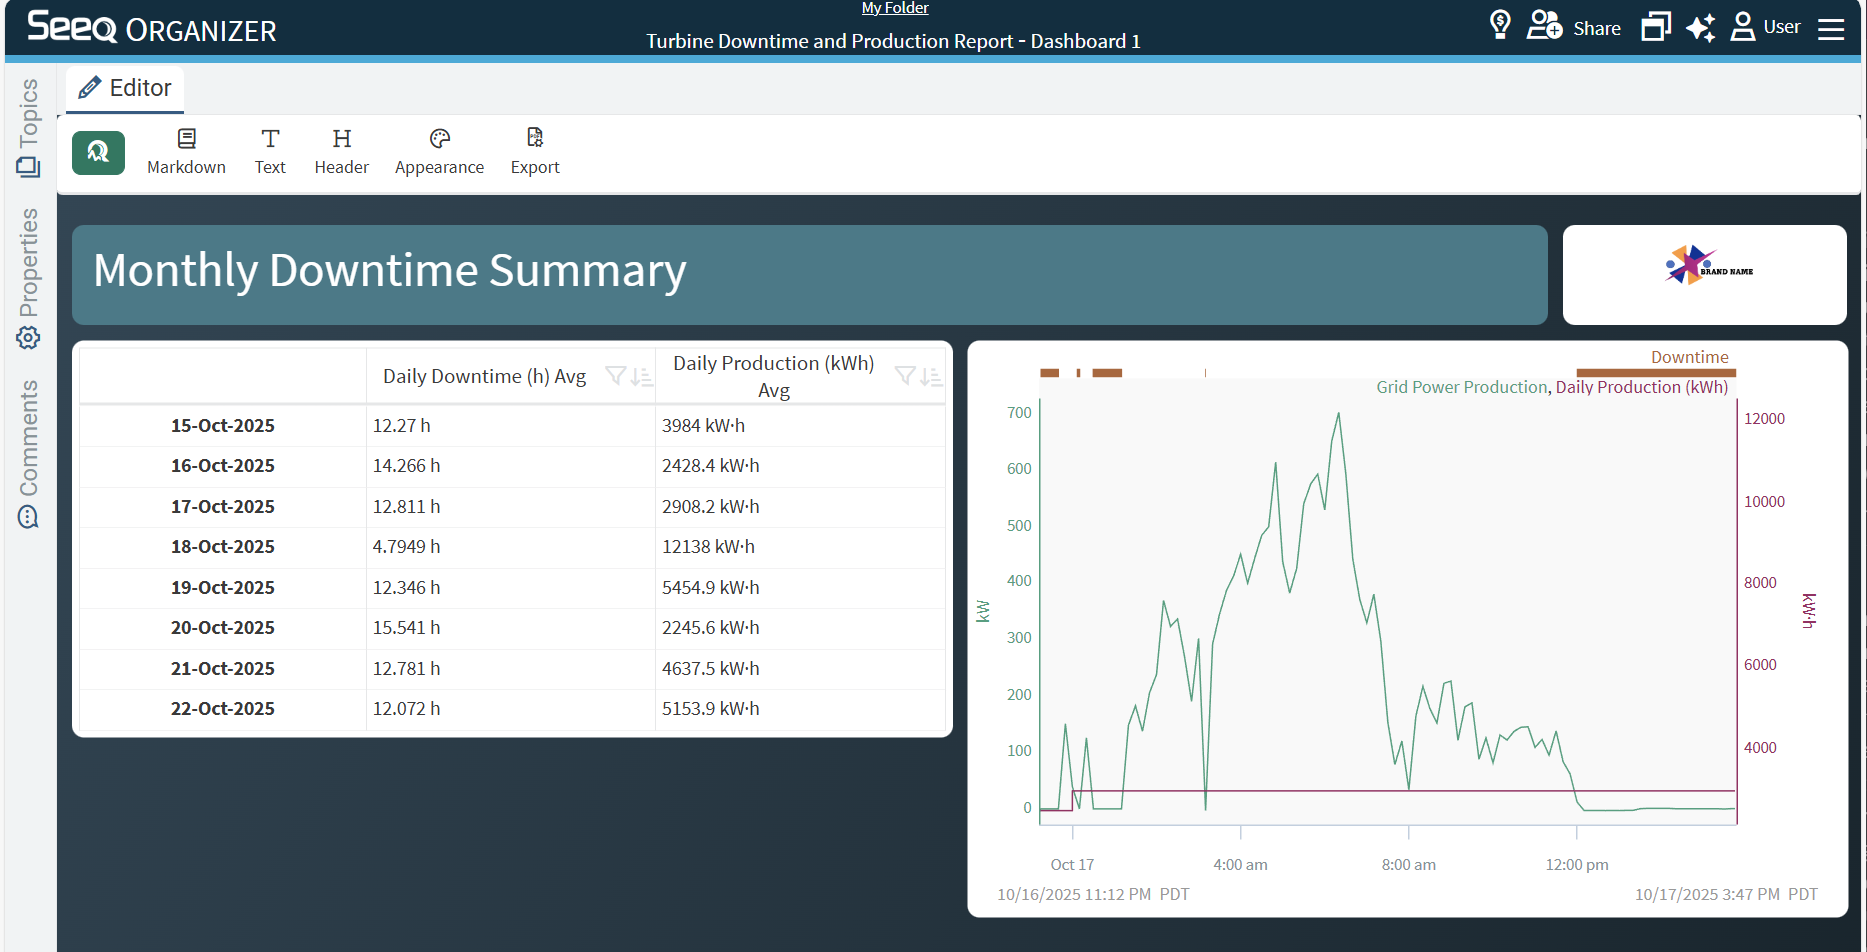
Further customize your Organizer Dashboards with background colors so they can fit your company colors or just make them satisfy your personal preference. Use the Appearance option in the Toolbar and in the menu for each piece of content.
Numeric context is now available in Workbench Analysis via context conditions
Numeric context created in Vantage are now part of the context condition and can be accessed in Workbench the same way label context is.
Introducing Python 3.13 kernel in Data Lab
Experience the latest from Python!
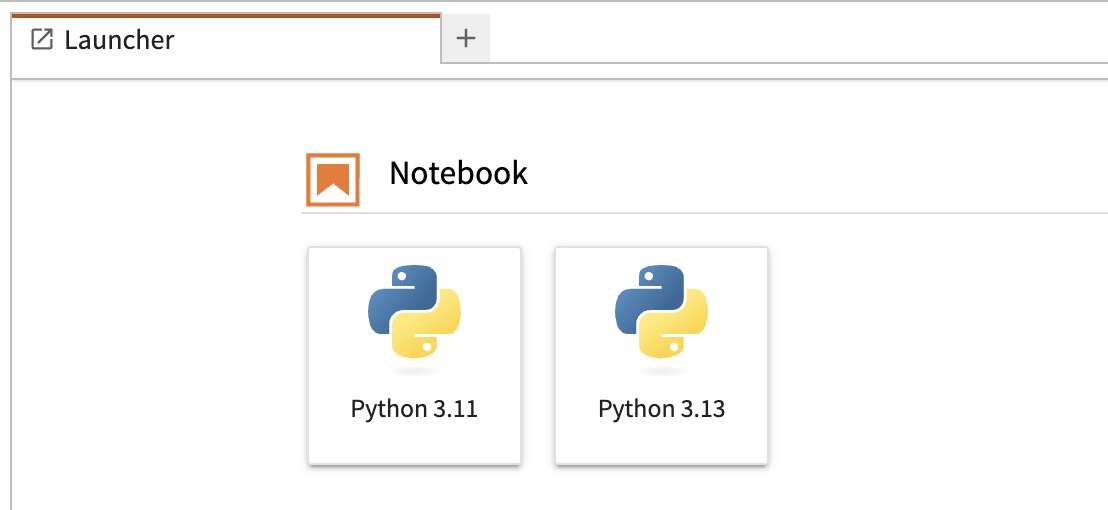
Python 3.13 is now available as an additional kernel in Data Lab. This brings access to the newest language improvements, better performance, the latest maintained packages, and an enhanced developer experience.
As part of this update, Support for Python 3.8 has been removed, and Python 3.11 now serves as the default kernel in Data Lab. For any compatibility issues, please see the Data Lab Python 3.11 Compatibility Guide for more information.
A picture is worth a thousand words
The AI Assistant now understands visual context, so you can use screenshots, photos, dashboards, or whiteboard sketches alongside your question to more efficiently communicate. The AI Assistant will consider the image to further inform its response. Here are a few reasons you may want to upload images to the AI Assistant, but we know you will dream up others:
Accelerate Actions Agent with multi-step instructions by annotating a diagram (see image).
Provide a sketch of a preferred report layout to minimize your manual efforts.
Inspire the Data Lab Agent when you are creating Add-ons with a preferred user experience.
Images travel with the chat and are provided to underlying LLM providers for response. Their presence in the chat makes it easy to revisit evidence or share outcomes with teammates. Read more at AI Assistant - Image upload - Seeq Knowledge Base - Confluence
.png?inst-v=3330414c-1d21-43cc-98d2-c157c084c7e8)
DataPARC connector
The dataPARC connector is now available. Previously, Seeq was able to access dataPARC data using the OPC-UA connector. This new connector allows Seeq to access data from the dataPARC PARCserver over gRPC which is significantly more efficient.
New connections to dataPARC systems that support this API should leverage this new connector. However, existing connections to dataPARC via OPC-UA will continue to work.
Improve performance with automatic disabling of unused Scheduled Organizer Topics
Some Seeq users schedule activities and then never come back to look at their reports! This creates unnecessary system activity that can slow things down for others. Now any Topics that are updating on a schedule and are not opened within 90 days will be disabled. This excludes Topics that have emails configured to send on a schedule. Read more at Scheduling Organizer Topic Documents .
More easily move and configure Organizer Dashboard Tiles
The look and feel of Organizer Dashboard tiles has been updated for consistent access to the edit menu. Read more at Inserting Content - Dashboards.
VANTAGE More easily Save and Overwrite Views
The “Save” button in Vantage now defaults to “Overwrite” for the View which you are on. Simply type a new name and see that the save text changes to “Create”, allowing you to create a new View.
Condition Monitor manual re-run enables cleanup and syncing Vantage table with the current state of the monitored conditions
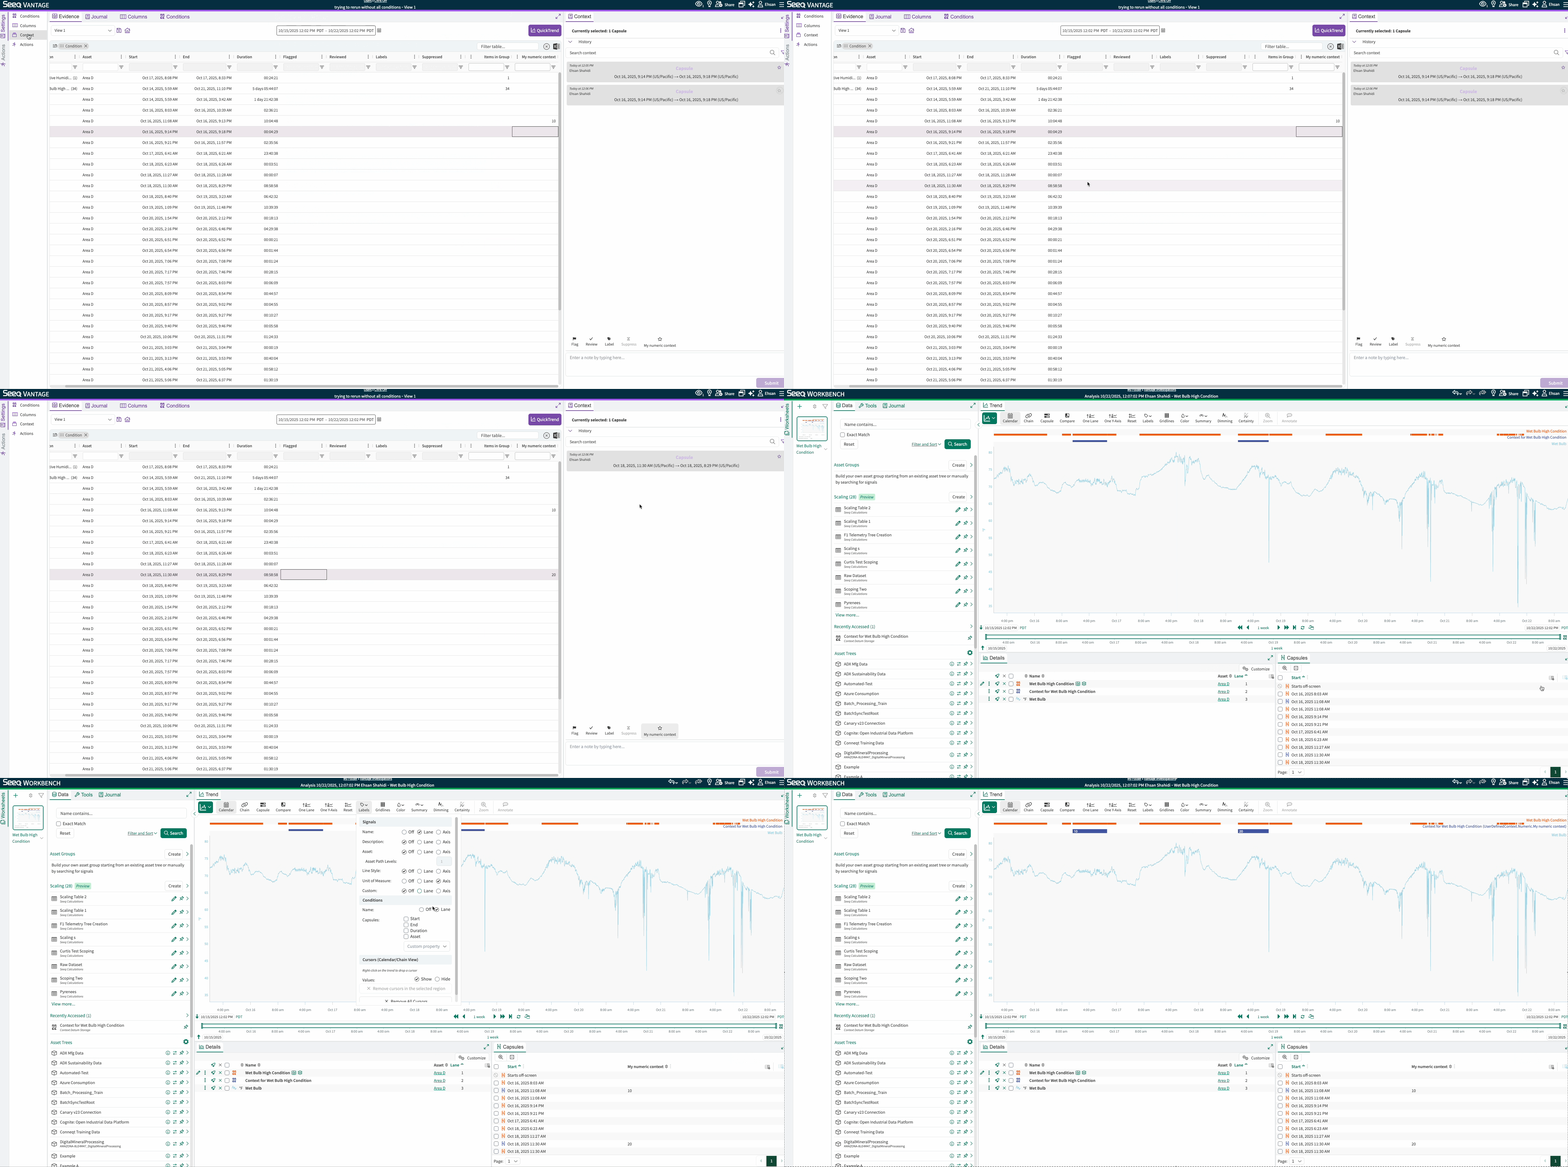
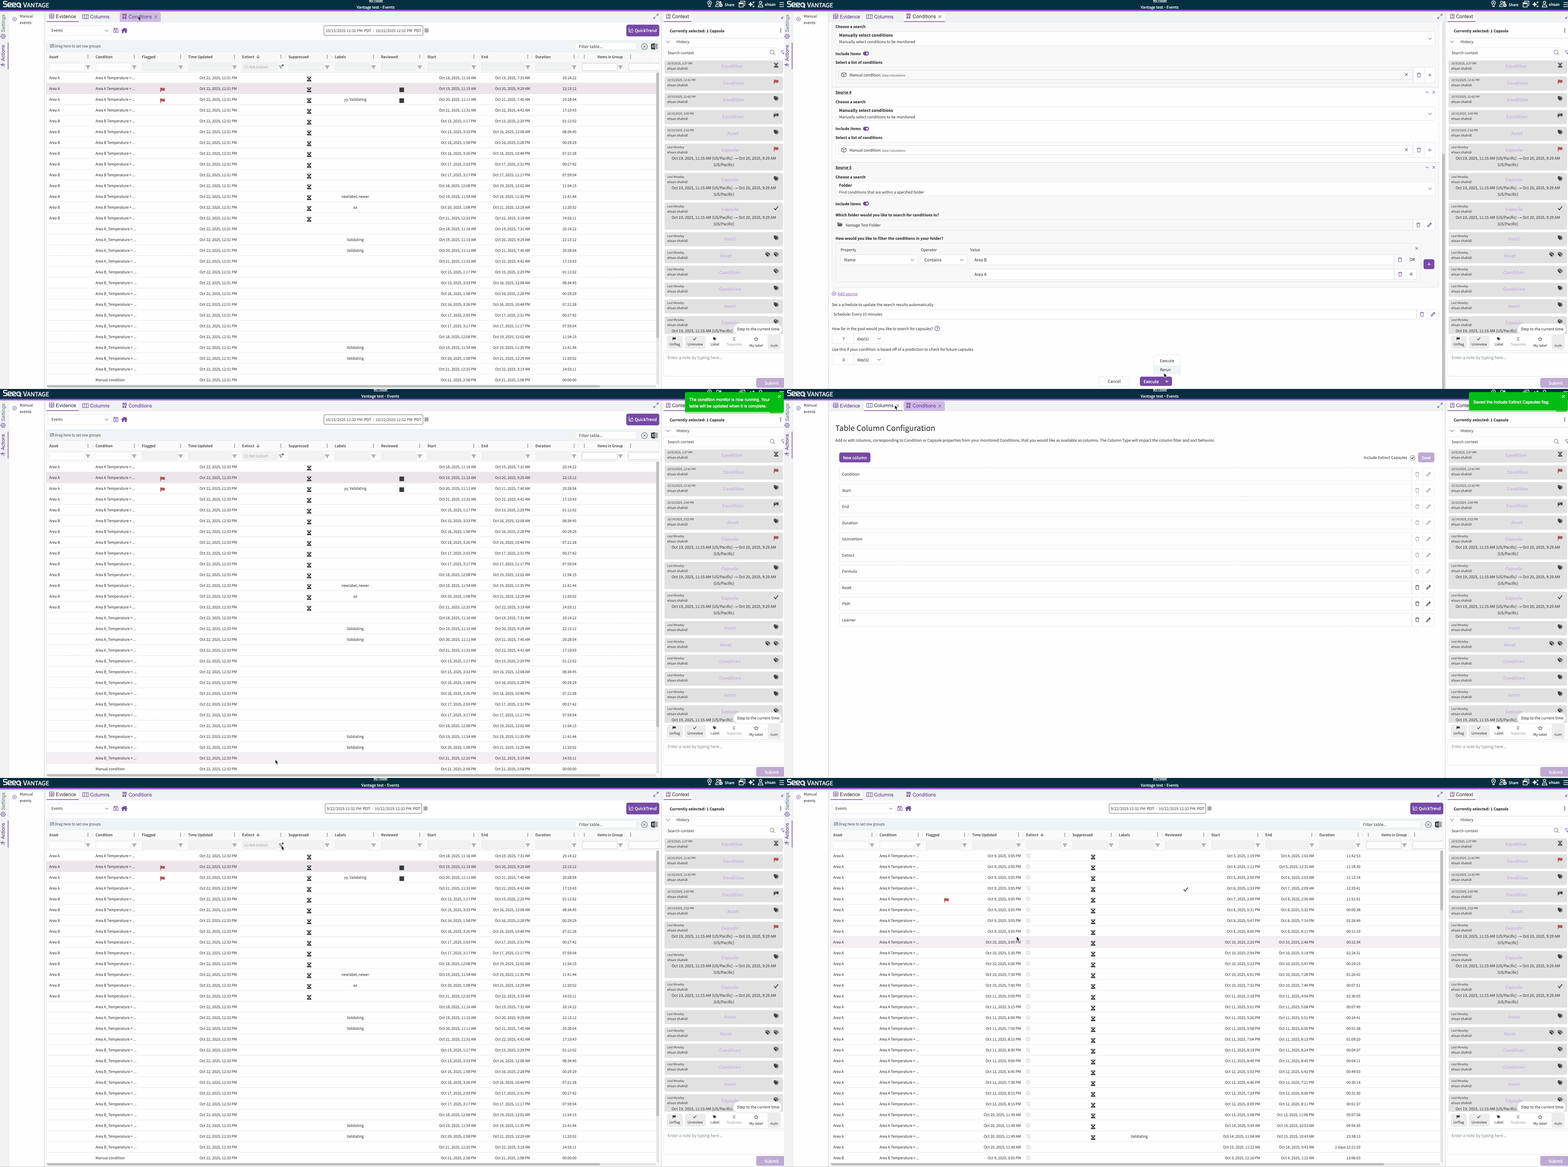
From the Conditions tab in Vantage UI, a dropdown appears on the Execute button after the initial run. Unlike the scheduled condition monitor runs and clicking the refresh button at the top right of the Conditions tab which don’t modify already-materialized capsules (except uncertain ones), the manual re-run executes the condition monitor with the given lookback and applies the desired action (either no action or marking extinct) to the existing capsules already in the table. It can be viewed as a hard reset. For instance if the monitored condition has been updated and the already-materialized capsules are no longer valid, the user may execute a manual re-run and mark existing capsules as extinct. By default, extinct capsules are not brought to Vantage, but that can be enabled from the Columns tab if desired.
Centralized information on Data Lab Notebooks
We’ve added the new Data Lab Management page — your central hub for overseeing Data Lab projects. Currently, you can:
View all scheduled notebooks in one place
Monitor run status, duration, warnings, and errors
Terminate currently running notebooks if needed
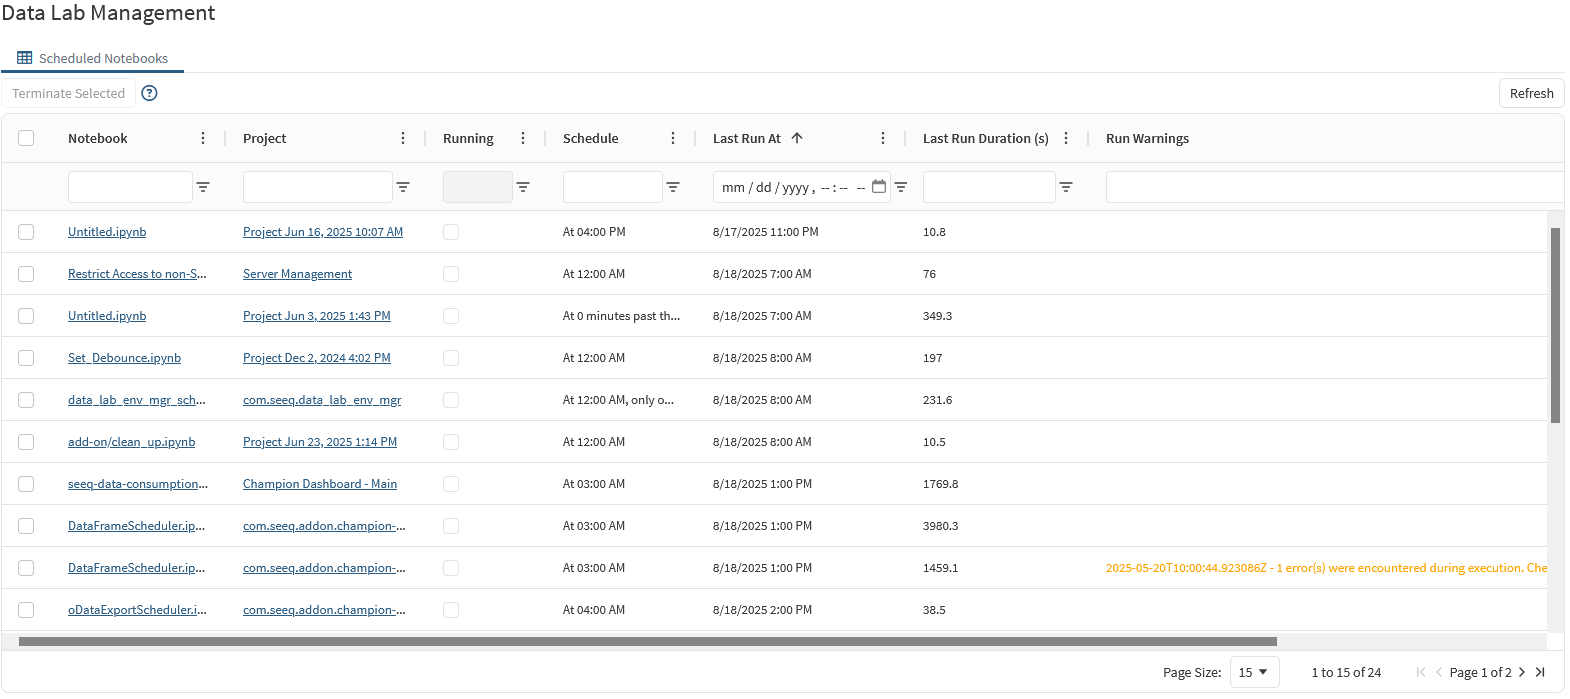
Scheduled Notebooks tab of the Data Lab Management Page
This is just the beginning — more features will be added over time, making this the go-to place for all your Data Lab management needs.
Learn more in the Knowledge Base article
Reply To in Notifications
We've added a Reply To field to email notifications. This lets you specify a different email address for recipients to reply to. Now, when a recipient gets an email from Seeq, they can simply hit "reply," and their message will go to the user or distribution list you configured, instead of the default Seeq notification address.
Improved OData Export Performance
The modern OData service now fetches data in parallel, which can greatly improve performance when exporting several items with long loading times. This also introduces a timeout per data request so stalled calculations do not occupy the worker threads indefinitely. The parallelization and timeout options can controlled at the server level or per export request.
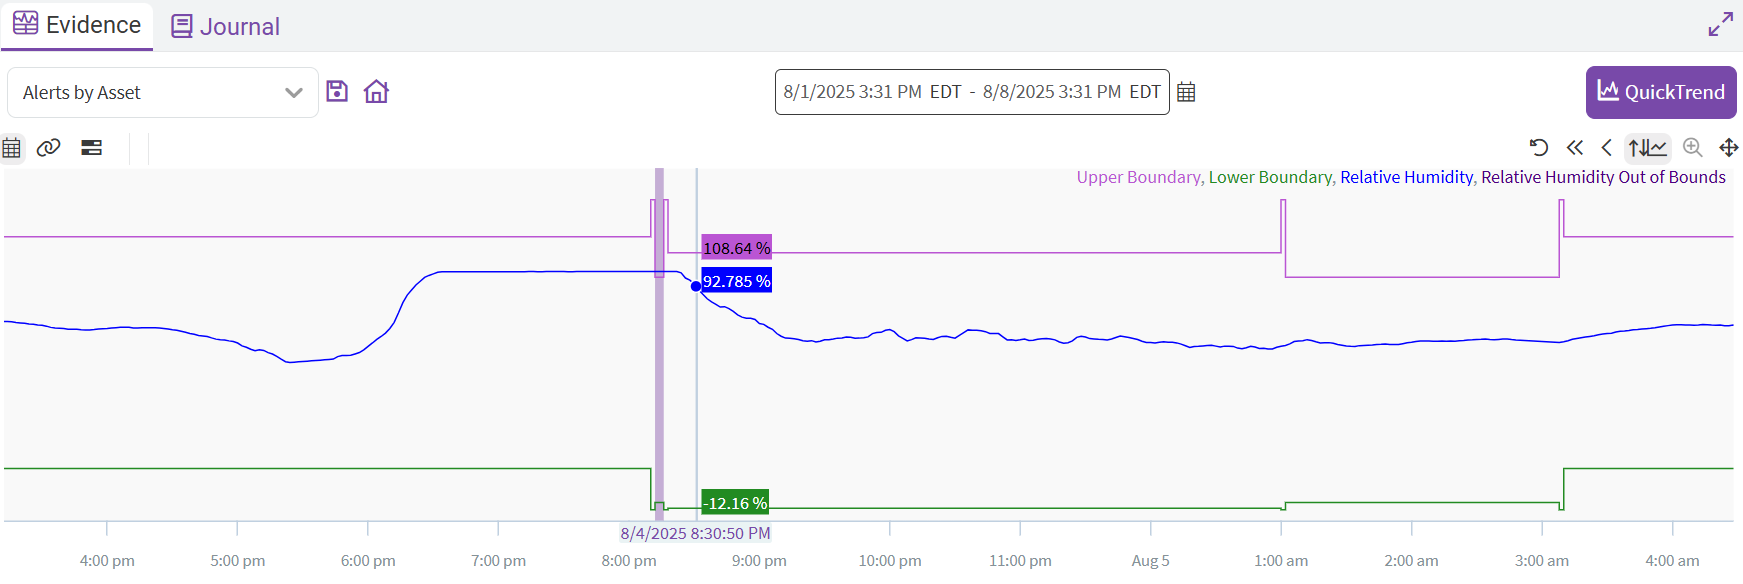
VANTAGE QuickTrend Coloring Consistency
Now, QuickTrend signals and conditions are presented in a consistent and predictable color scheme. The color scheme is also adapted appropriately between dark and light mode:

New AI Assistant Memories
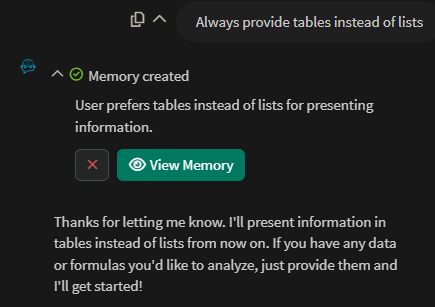
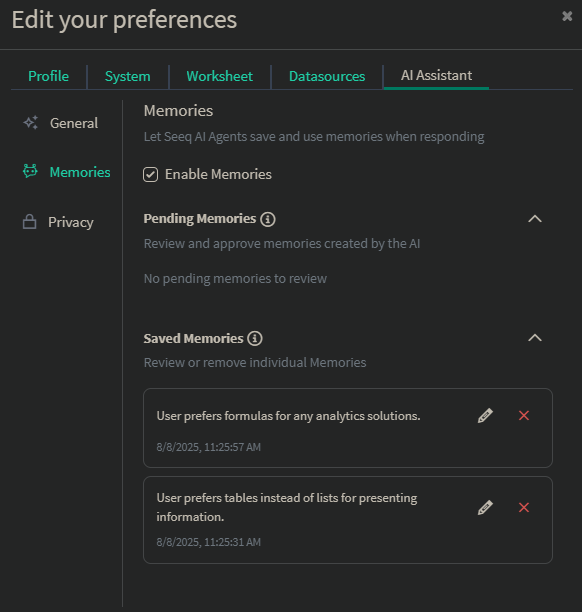
The AI Assistant now features User Memories - a powerful new capability that enables your AI assistant to remember important information about you, your preferences, and your work context across conversations. This creates a more personalized and efficient experience as the AI learns and adapts to your specific needs over time.
Read more at AI Assistant Memories.
Administration: Streamlined Vertical Navigation
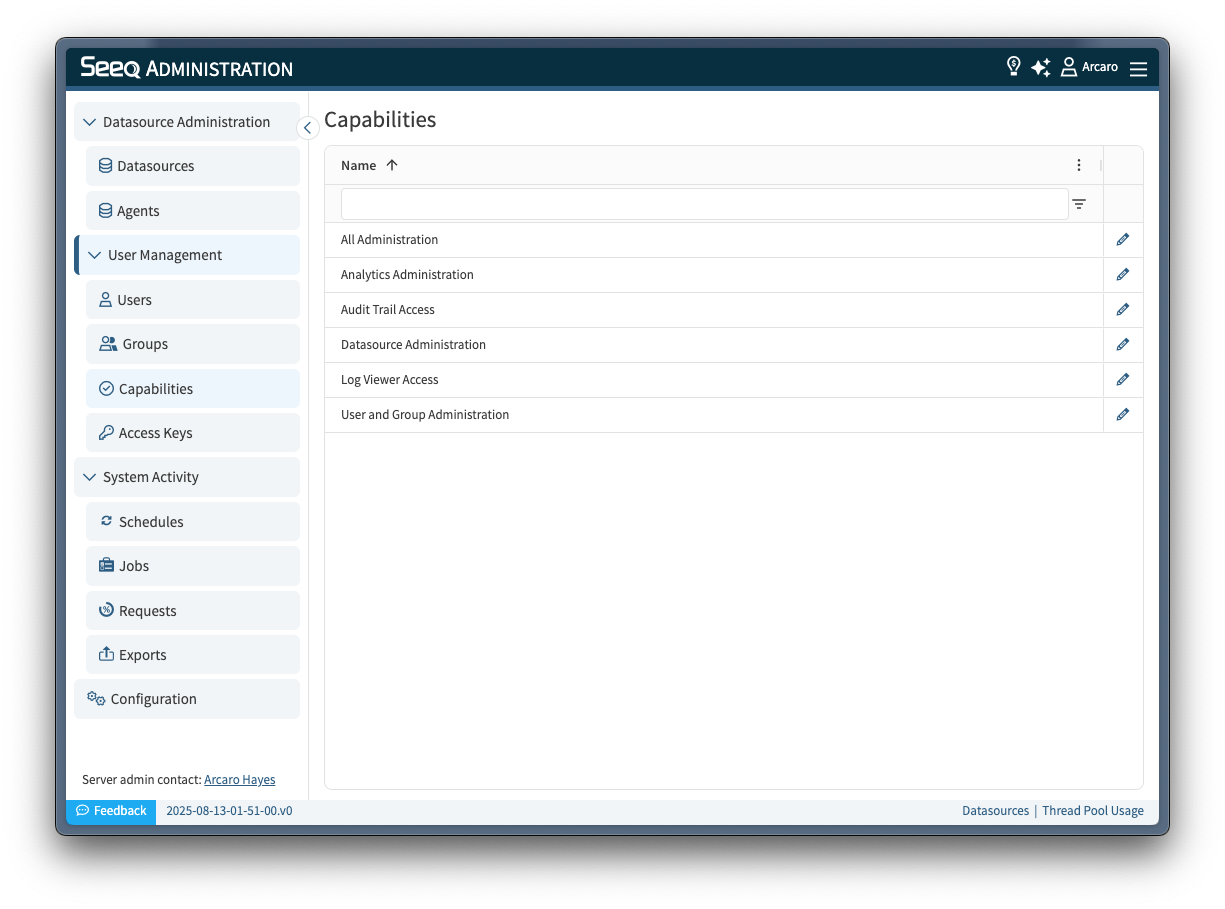
The new administration experience
The Administration page has a fresh new layout! The old horizontal tab navigation has been replaced with a grouped, vertical tab design, making it easier to find what you’re looking for and switch between sections.
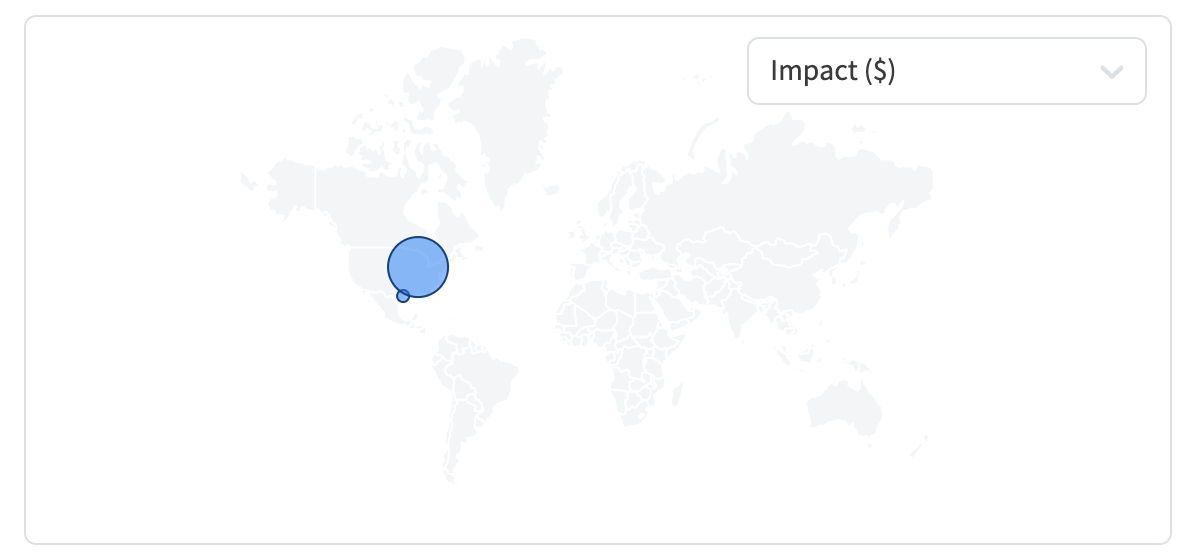
Map for Impact Reports
Visualize your Impact (and KPI) geographically!
A map can now be added to the Impact Reports Dashboard and show your Impact by location.
To take advantage of this feature add a “Map” component to your Impact Reports Dashboard:
- click the “Edit” button
- select “Add Map”
- arrange your Map as desired
- edit your existing Impact Reports to include a “Location”
- visualize your impact
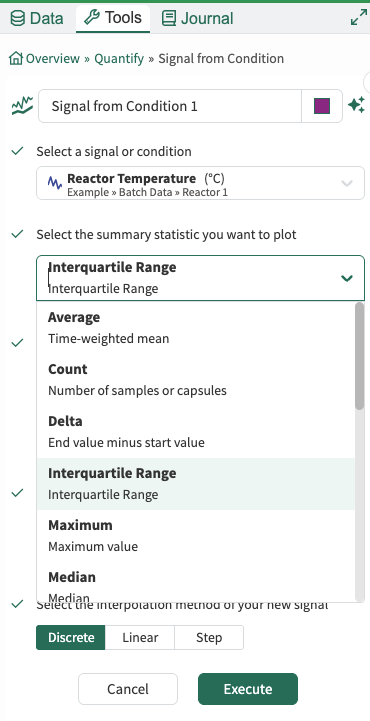
New Summary Statistic available: Interquartile Range (IQR)
The new Summary Statistic Interquartile Range is available to use. It is defined as the 75 percentile less the 25 percentile, or Q3-Q1. It is also available on the formula editor as iqr().
New search filter - limit results to locally scoped items
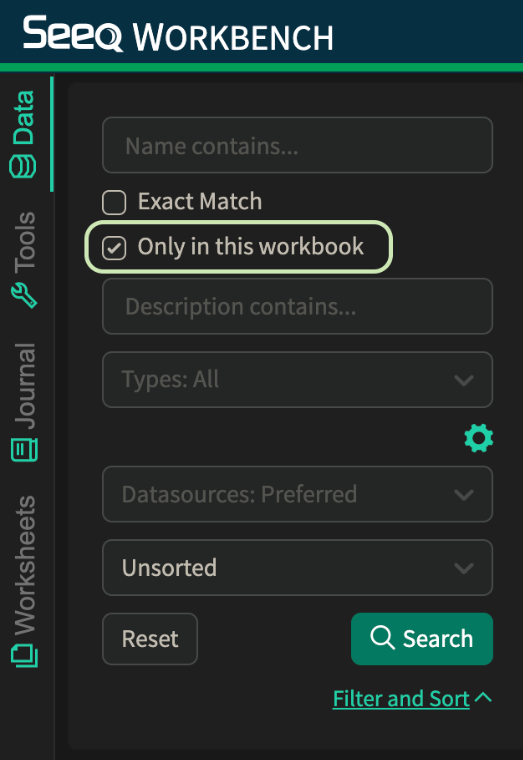
With the new checkbox in the “filter and sort“ section of the data pane, limit the search results to only items that are scoped to the current workbook. Results will include items created in this workbook and exclude items that are globally scoped.
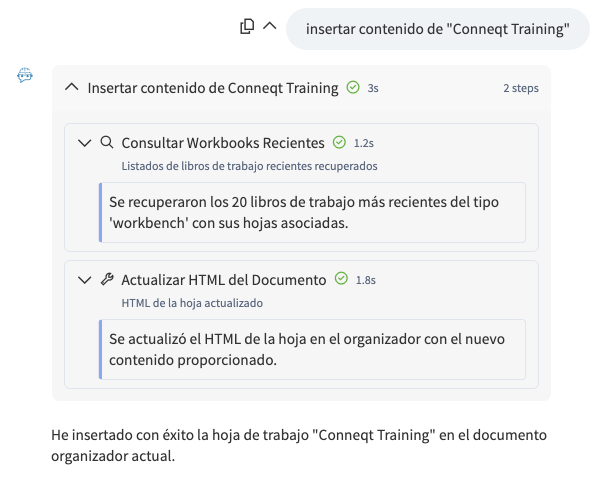
New & Improved Actions Agent
The Actions Agent has been updated to:
Be more conversational: You can speak directly to it as you would other agents, ask questions such as what it can do, what types of analyses you may consider according to what’s in your display, and more!
Be multi-lingual: The Actions Agent is now 100% multi-lingual! Depending on your set language in Seeq, the Actions Agent will respond in that language!
Expose what’s going on under the hood more with new UI components. This helps gain insights to any planning the Actions Agent does, or any specific steps it takes to arrive at an answer or completed actions.
Custom KPIs for Impact Reports
Impact Reports can now be customized to include custom KPIs that matter to your company. Admin users can access the newly added KPI configuration after clicking the “Edit” Button on the Impact Reports Page.

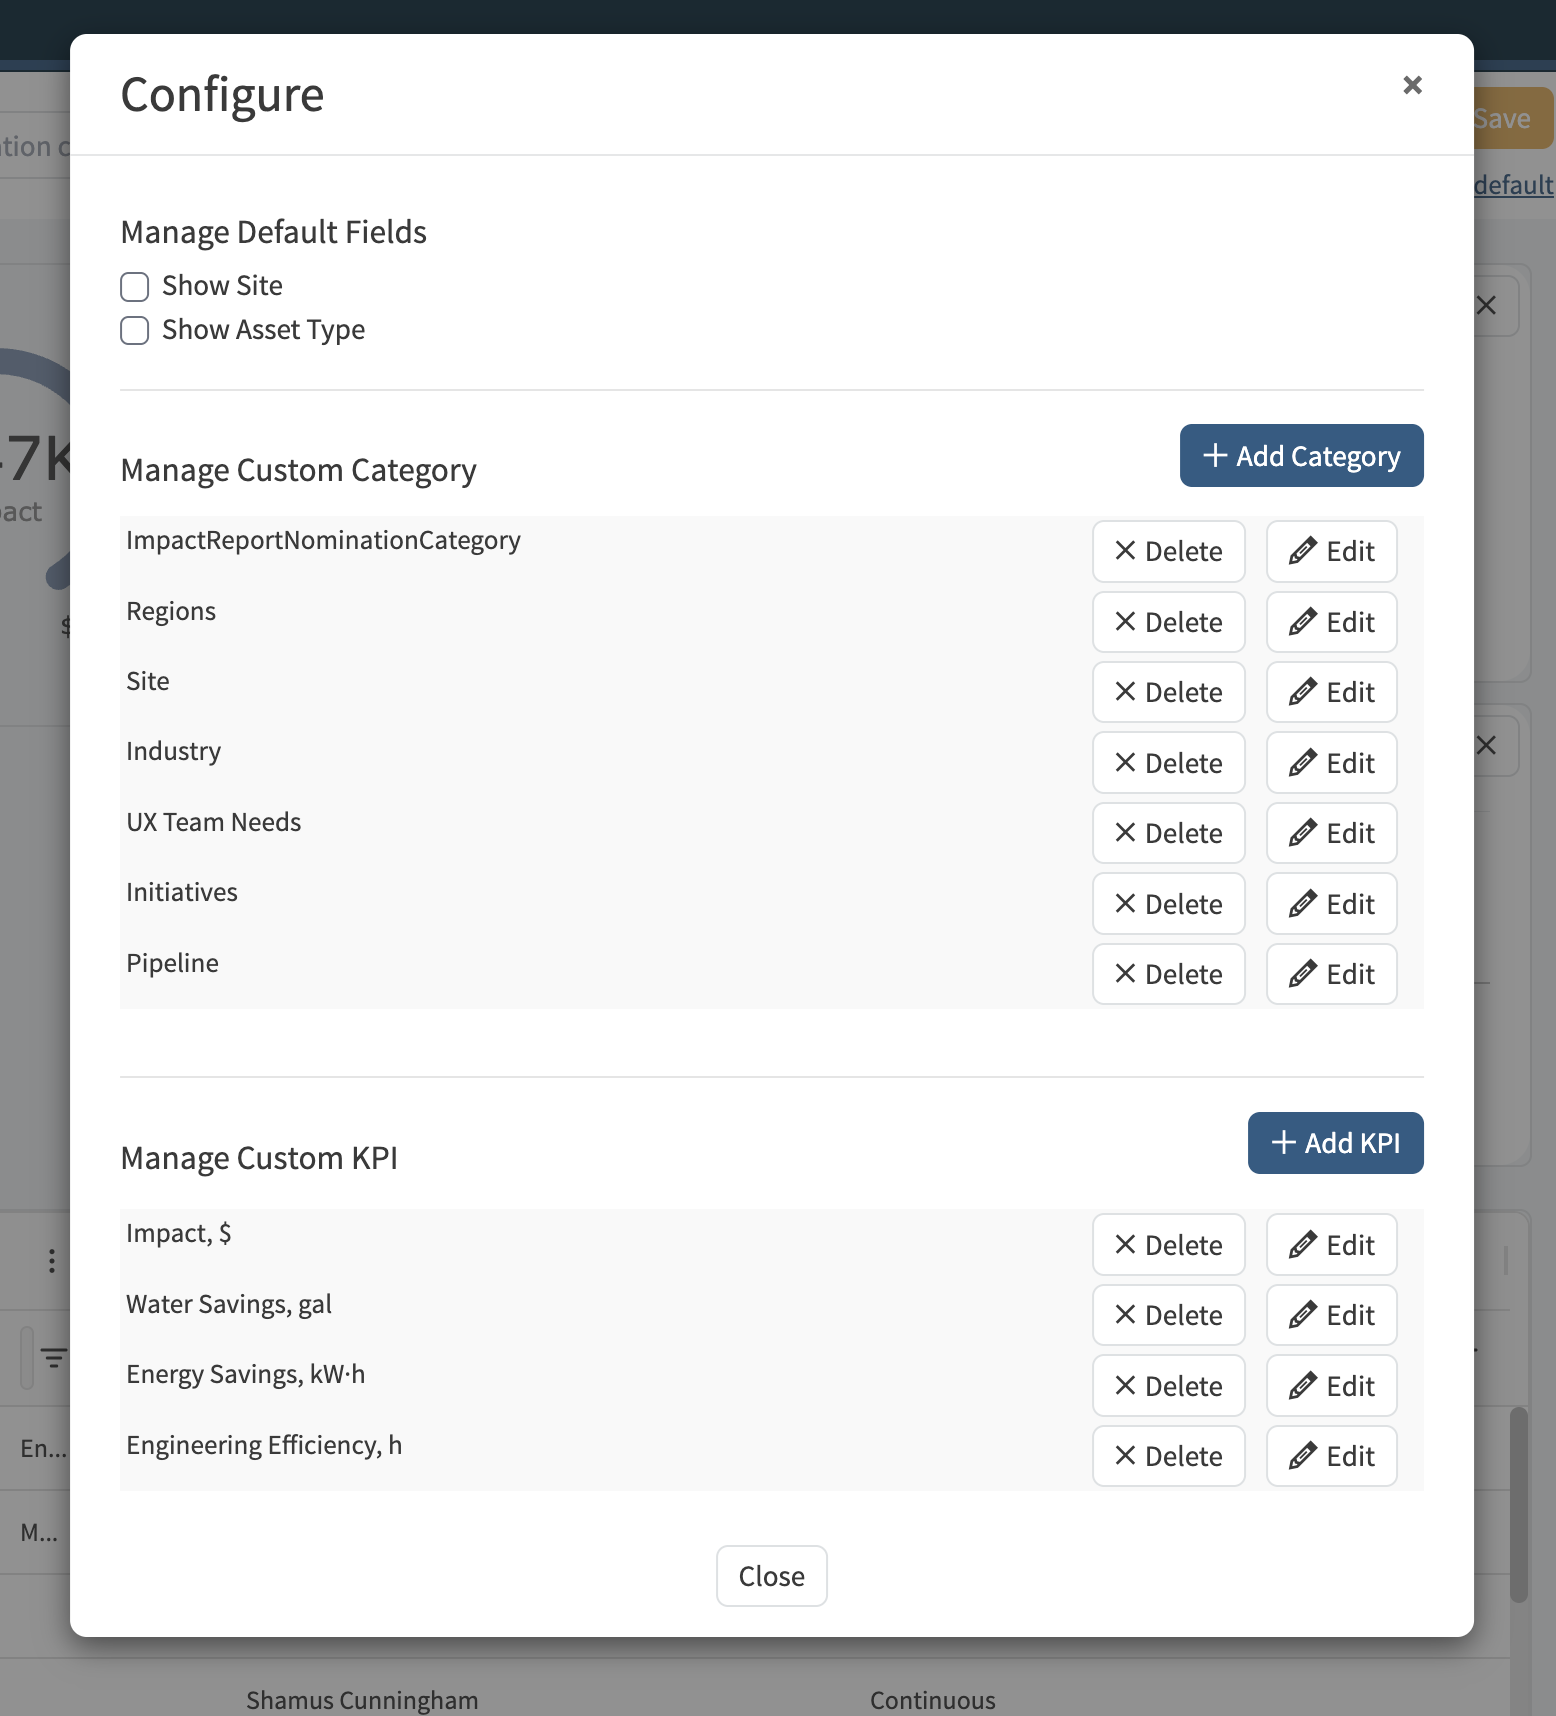
As part of this effort the management of custom categories has also been moved to this new central configuration window.
KPIs will show as inputs in the “Quantify” section when creating your Impact Reports and will be displayed on the Details Pages as well as part of the table display. Additionally KPIs can be used to create custom chart displays.
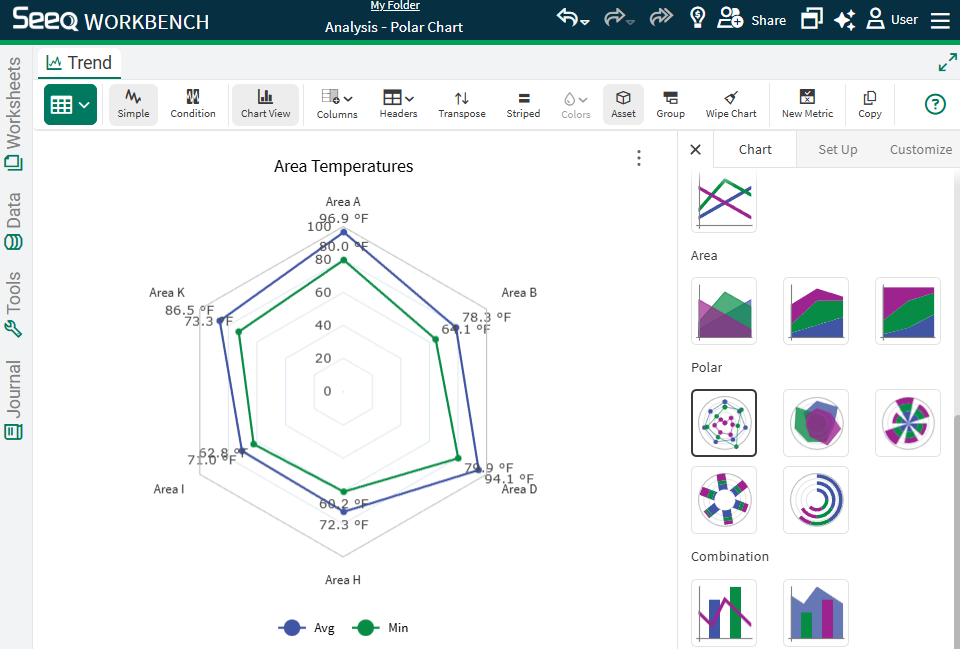
Polar Charts
Tables & Charts have a Polar Charts section in the Chart menu, giving you access to more chart types to visualize data. The Radar Line option allows you to create spider plots for clear comparison of multiple variables on a circular axis, but you can also choose from Radar Area, Radial Column, Radial Bar, and Nightengale charts. These chart options are especially useful for representing radial data, such as temperature distributions in turbine exhausts, reactors, and other equipment where data varies by angle or position.
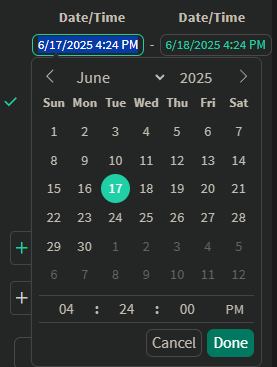
Calendar Date Picker
Anywhere in Seeq where you have been typing in a date (Workbench Trend, various tools, Organizer and Vantage Date Ranges), you now have access to a calendar date picker. This should make it easier to configure dates you want, but you can still type a date/time instead of selecting.
Organizer Data Lab and IOTA Content size option
If you use Data Lab Functions to insert custom visualizations in Organizer, you can now specify a percent size instead of pixels. Read more at Inserting Content - Documents | Data-Lab-Content-in-Organizer.
Principal Component Analysis
Principal Component Analysis (PCA) is a powerful machine learning technique designed to simplify complex datasets by reducing their dimensionality while retaining the most significant patterns. This method is particularly effective for identifying trends, detecting anomalies, and revealing the underlying structure within process data.
Key Features of the PCA Tool:
User-friendly interface – Begin your analysis swiftly, with no coding required.
Preview results before execution – Gain insights into the model with a preview prior to finalizing.
Interactive model view – Delve into essential properties such as component loadings and explained variance.
This tool is perfect for engineers and analysts who aim to interpret large multivariate datasets without necessitating an extensive background in data science. For further details, please refer to the KB article: Principal Component Analysis.
AI Assistant Prompt Library
If you are new to working with Generative AI and aren’t sure what to ask the Seeq AI Assistant, check out the library of prompts for inspiration!
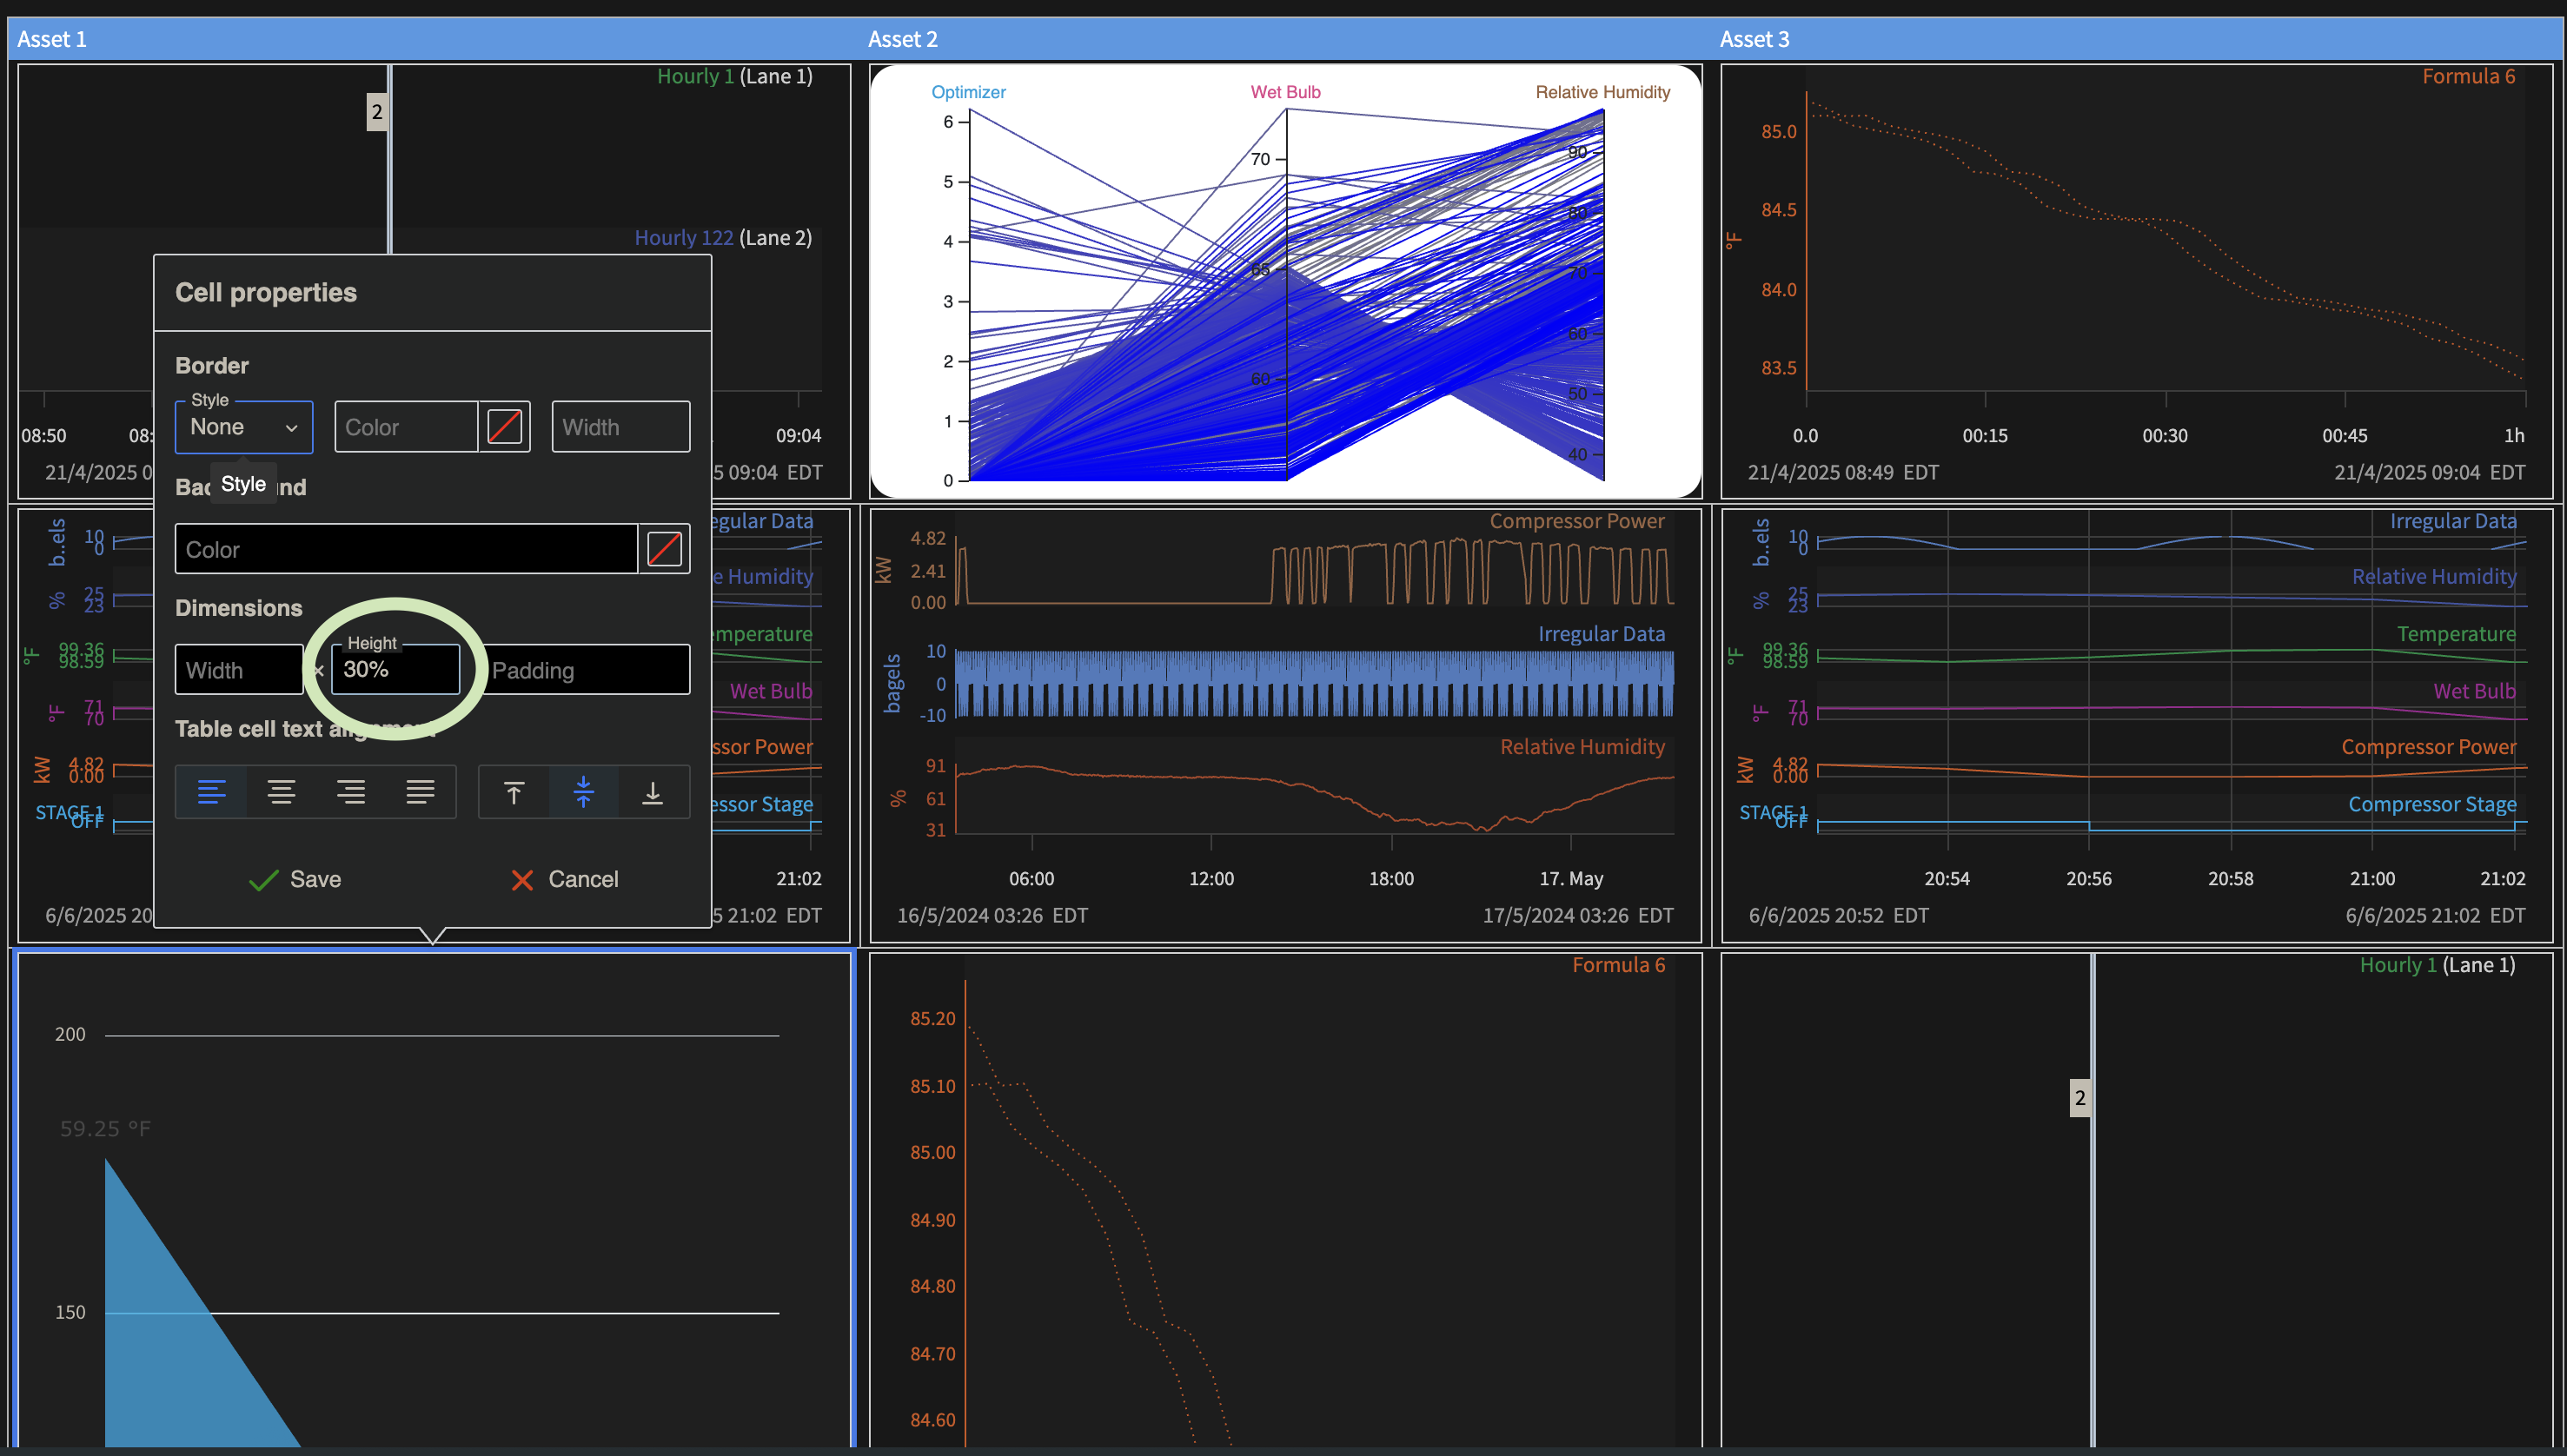
Organizer Topic as a resizable dashboard
Organizer Topic Document content has a new sizing option “Fill to fit container”. This can be used to let content fill the cell of a table regardless the dimensions of the page. To get the best use of the functionality, set table height to 100% of the page height by configuring the table style. Switch all content in table cells to use the new sizing option. This produces a single page dashboard-like layout that resizes and scales to different screen sizes making best use of the available space (video below). Cell styles can be configured individually to take up desired proportion of the full-page table such as 30% for one and 70% for the other (screenshot below). Read more at Inserting Content - Documents | Set-Content-Properties[inlineExtension].
Note: New sizing option best works with the interactive content. The table cell should only include a single piece of content, any additional information can go into a separate row, when resizing the window may need a page reload for the height to adjust.
VANTAGE Visual Indication when you are on your “Home” View
The Vantage Home icon now is colored purple when you are on your Home View.
When you on any other View, the Home icon will have no shading, and pressing the Home icon will navigate you to the Home view, and shade the icon.
VANTAGE More intuitive date filters for “Start” and “End” columns
You can now leverage custom filters for your “Start” and “End” column to only show events before or after a particular date and time.
Support for Externally Trained ML Models (ONNX)
Users can now register externally trained ONNX-formatted machine learning models and execute them directly within Seeq. This licensed feature simplifies integration with external ML workflows , enabling seamless inference within Seeq. A key component of this update is the External ML Tool, a dedicated interface in the Tools Pane that streamlines signal mapping and model execution.
Key Features:
Register ONNX models trained outside of Seeq for use in your workflows.
Use the External ML Tool to list, configure, and execute registered models.
Map model inputs to signals using an intuitive interface, aligning external models with your data sources.
Run inference directly within Seeq, leveraging pre-trained models for actionable insights.
Reuse and scale models across multiple assets or processes, accelerating deployment.
This update bridges the gap between external AI development and operational analytics, empowering users to apply advanced ML without leaving the Seeq platform.
For more information, please visit the External ML Knowledge Base page.
Machine Learning Tools - Clustering
The new Clustering ML Tool has been introduced to enhance our Machine Learning capabilities within Seeq. This tool utilizes the K-Means algorithm and features a backend ml-service designed to streamline data clustering tasks.
For further details, visit the Clustering Knowledge Base page.
Machine Learning Tools
We’ve enhanced our Machine Learning (ML) suite with integrated, user-friendly tools designed for self-service, enabling you to create capsules and make predictions. The initial tools deployed are Self-Organizing Maps (SOM), Isolation Forest (IF), and Partial Least Squares (PLS).
The Self-Organizing Maps tool is perfect for detecting anomalies in time-series data with an intuitive and visual approach. Isolation Forest provides a fast and efficient tool for identifying outliers across complex datasets. Partial Least Squares is ideal for building predictive models from high-dimensional data.
For more details, visit the Knowledge Base pages:
Updates to Table & Charts
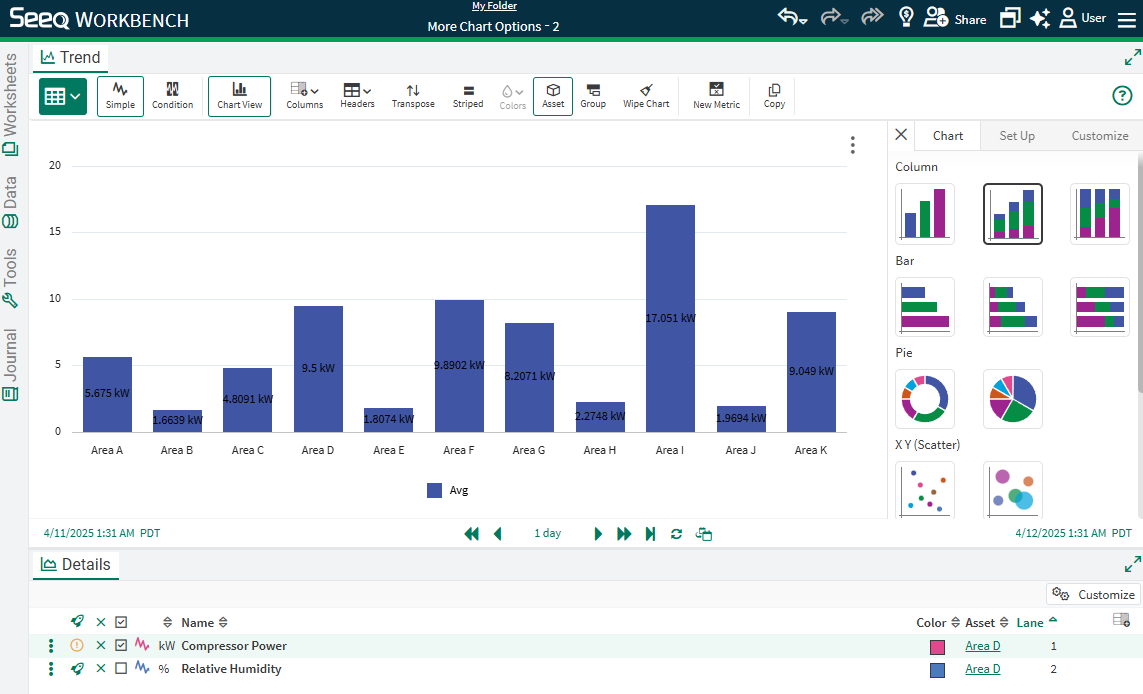
More chart customization is available for Tables & Charts in Workbench, including availability of Charts for Condition Tables. You have access donut and area chart options, as well as the ability to add titles and further customize the axes and legend. Read more at Tables & Charts | Charts.
Impact Reports
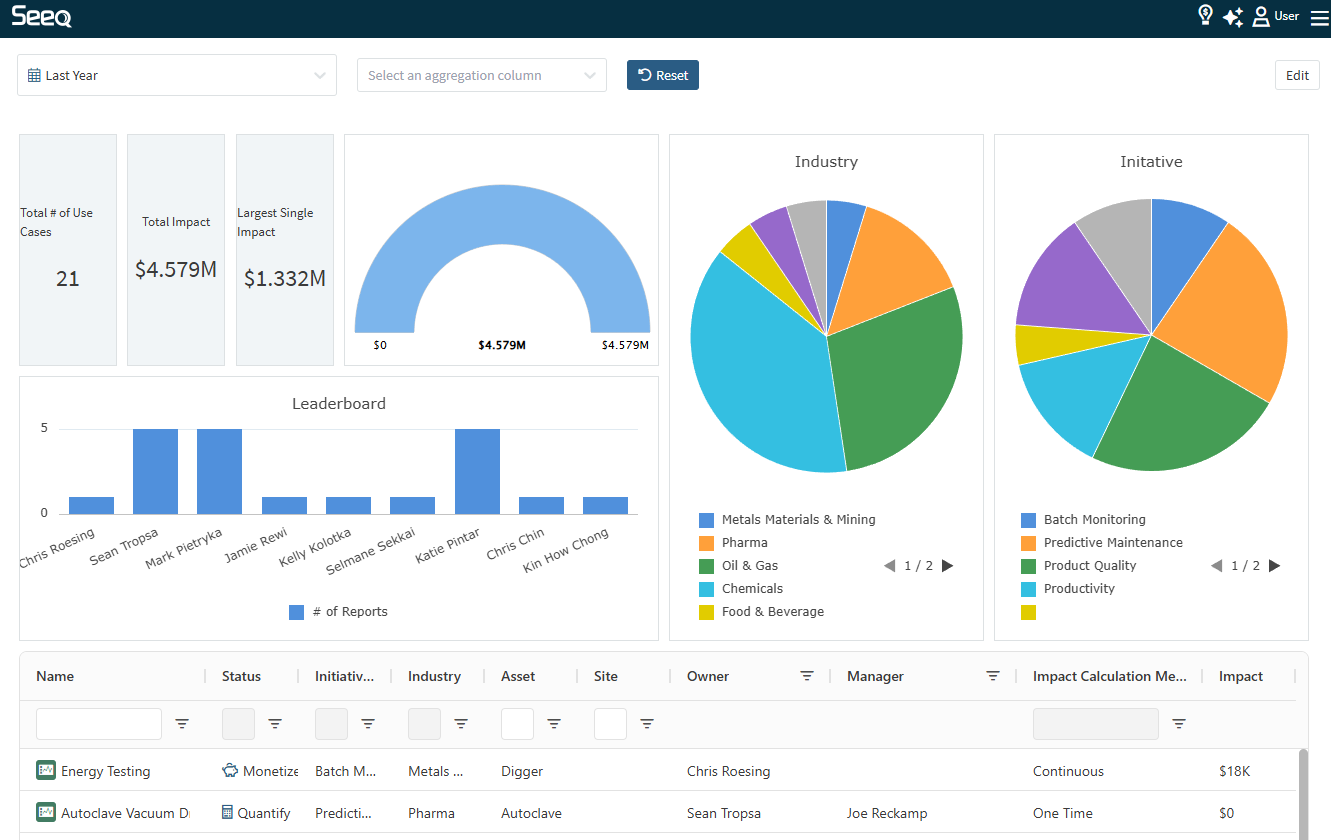
Seeq users are innovating in their organizations every day by identifying bottlenecks, improving quality, and avoiding process upsets. Any use case can be elevated across the organization through Impact Reports to spread awareness. The AI Assistant can help document the use case, and administrators can configure categories to allow aggregating impact by type. Impact reports are elevated in a single view across the enterprise to inspire collaboration and continuous improvement. Read more at https://support.seeq.com/kb/latest/cloud/impact-reports.
Signal Forecast Tool
A new tool under Model & Predict simplifies the workflow to forecast signal values into the future. This can be helpful for predictive maintenance modeling, identifying when vessels may fill or empty given their current rate of change, and modeling future cycles given those that completed in the past. Forecast Linear, Forecast Constant, Forecast ARIMA, and Forecast Splice have been available through Formula, but this tool makes it easier for anyone to extrapolate data forward given their use case. Read more at Signal Forecast.
Audit Trail: Print to pdf, Formatting Improvements, and Ability to Hide System Entries
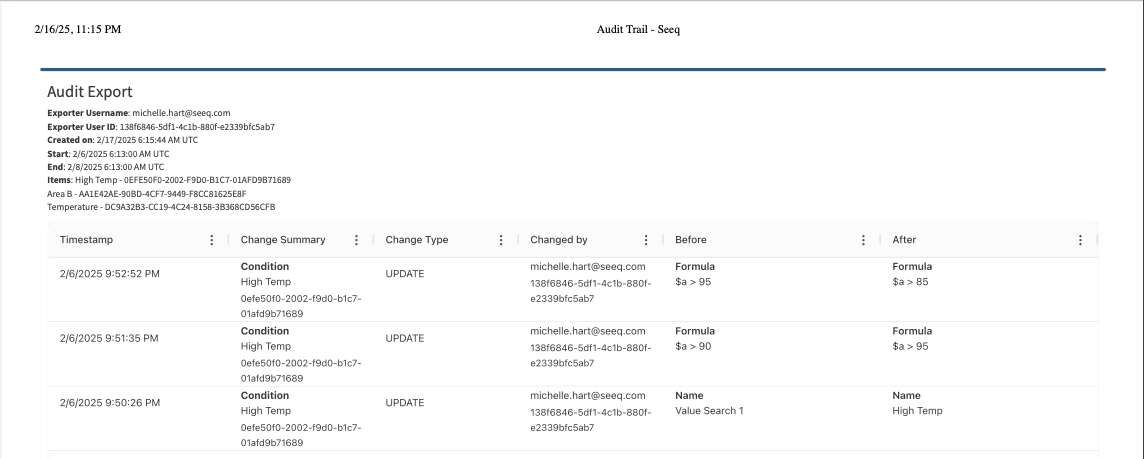
Audit Trail now has a button to print your current view to a pdf. The pdf will include critical information such as who printed it and when as well as what time frame and items are included in the printout. We’ve also added a few formatting improvements such as the ability to resize and reorder the columns. You can also choose whether to show or hide system actions which were not done by a user.
New Machine Learning Tools in Preview
All users will soon have access to three new Machine Learning Tools available in Seeq Workbench.
Self-Organizing Maps can be perfect for detecting anomalies in time-series data with an intuitive and visual approach.
Isolation Forest provides a fast and efficient tool for identifying outliers across complex datasets.
Partial Least Squares is ideal for dimensionality reduction and building predictive models from high-dimensional data.
These tools are currently in Preview and can be enabled by an Analytics Administrator. Read more at Machine Learning Models.
AI Assistant Quick Links in Journal
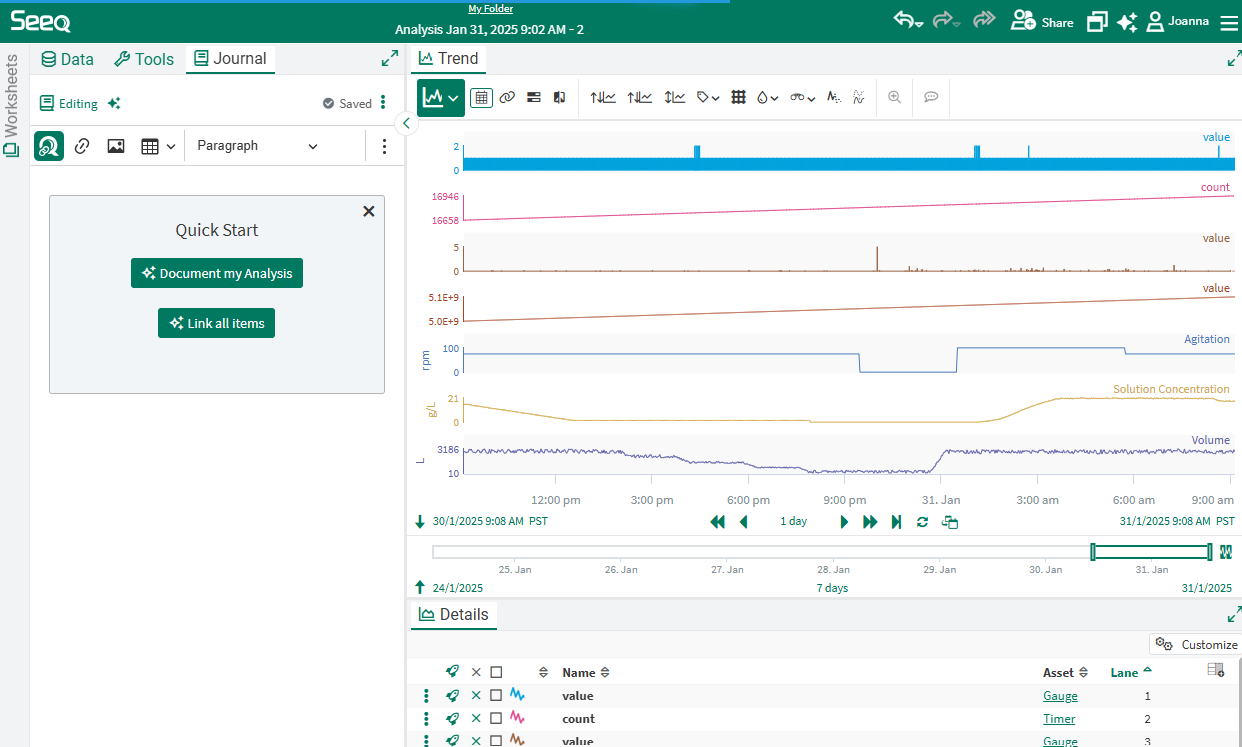
Users often have a hard time remembering to document their approach in a journal, or it can be a difficult task to do after the fact. The AI Assistant is here to help with that and there are two Quick Links available in any empty Journal to make it even easier to document your approach. This documentation is very helpful when collaborating with a team or preparing the next person in your role to learn quickly. Read more at Creating a Journal Entry.
Impact Reports in Preview
Seeq Champions across our customer base have been asking for insight on the value end users create in Seeq, so we have created Impact Reports to serve this purpose. Users can document the value they bring to the enterprise through Impact Reports. The reports are elevated in a single view across the enterprise to inspire collaboration and continuous improvement. This new capability is currently in Preview and can be enabled by an Analytics Administrator. Read more at https://support.seeq.com/kb/latest/cloud/impact-reports.
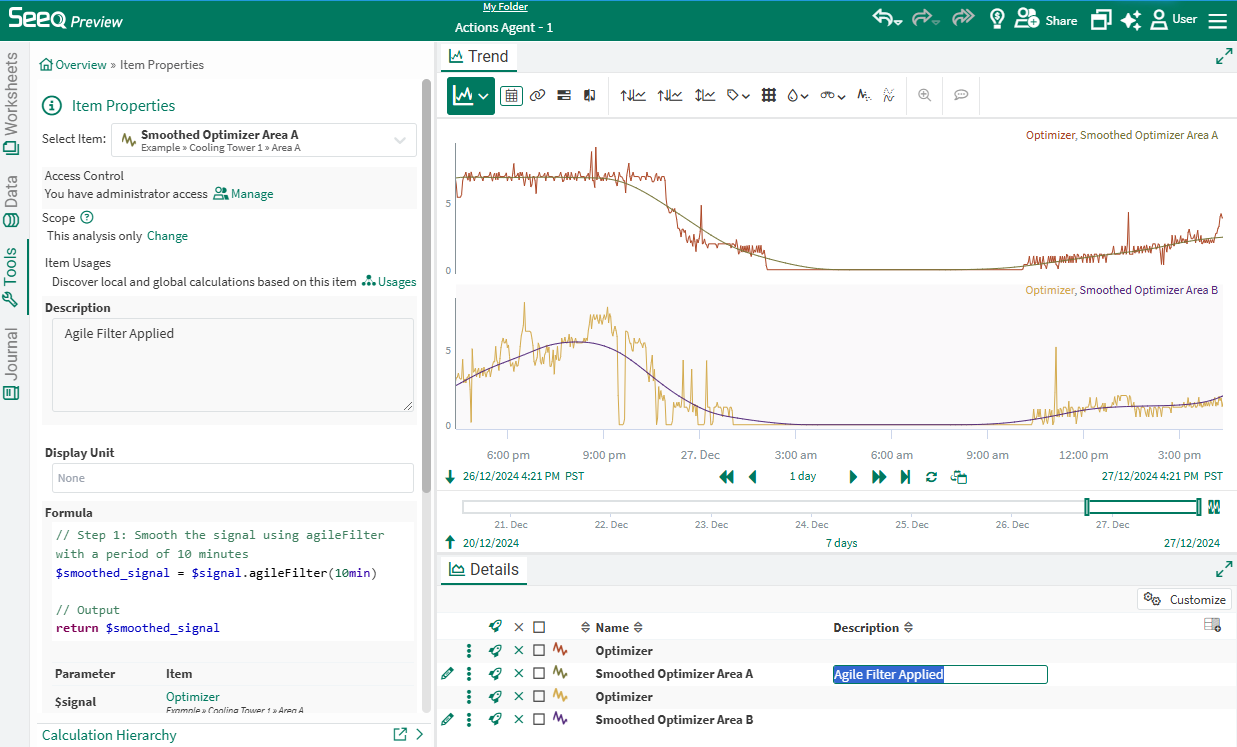
Change Description in Details Pane
When a description already exists on an item and it is displayed in the Details Pane, you can click to edit the description without opening Item Properties.
AI Assistant to Create and Update Organizer Topic Documents
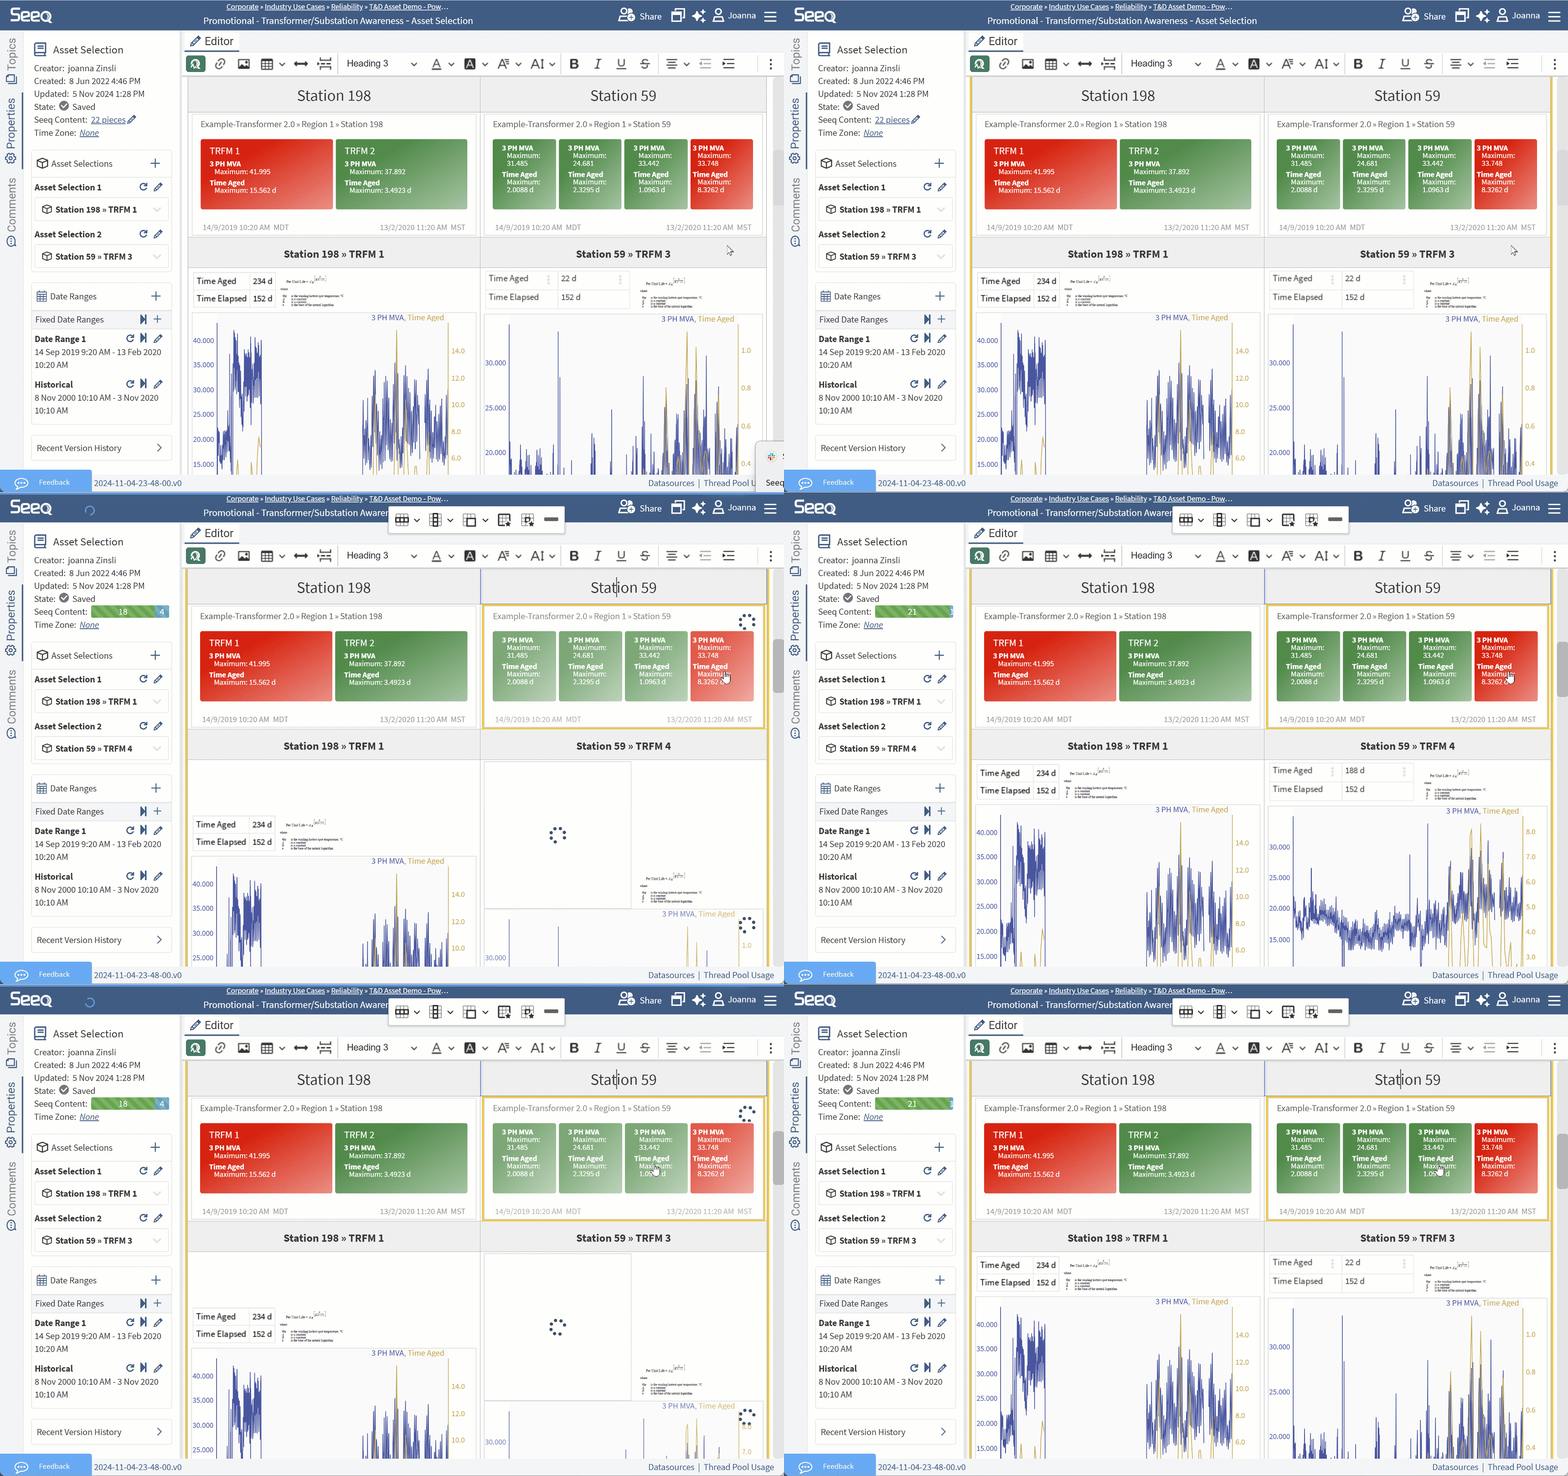
The Actions Agent continues to expand to help users Do More! Now you can ask the Actions Agent to insert content into a new or existing Organizer, modify the document formatting, create or update date ranges or asset selections, and even copy an existing document to apply to each asset in a hierarchy. Using the Actions Agent in this way can minimize the time you spend on mundane things to allow more time to analyze and optimize your process. Read more at Seeq AI Assistant | Take-Actions-in-Seeq-for-you.
VANTAGE Journal is now available per View
Vantage now offers a Journal, accessible through the left-hand side’s Settings panel. The Journal, just like Workbench, can be used to document your findings, purpose of the View, and also give more details about how you are utilizing the View - to improve the AI Assistant responses. Use this icon [![]() ] to fill in a template to get started.
] to fill in a template to get started.
Home Screen Updates
The Custom Links were moved on the home screen from the right side of the page to the left side to better use available room. Several helpful links (like Get Started, Link to Training, and Office Hours) were moved to the hamburger menu in the upper right hand corner of the page. If you want to add custom links to every user’s home screen, see Add Home Screen Links.
VANTAGE Initial and On-demand Condition Monitor Run
When setting up your Condition Sources in Vantage, Seeq will run the initial backfill immediately to provide events so you can start investigating. The Conditions tab now shows indication of the “Last Run” and “Next Run” statuses in the top-right corner, where you can initiate a manual run, if you want to execute your search off-schedule. The defined schedule is maintained and will run again at the next scheduled time.
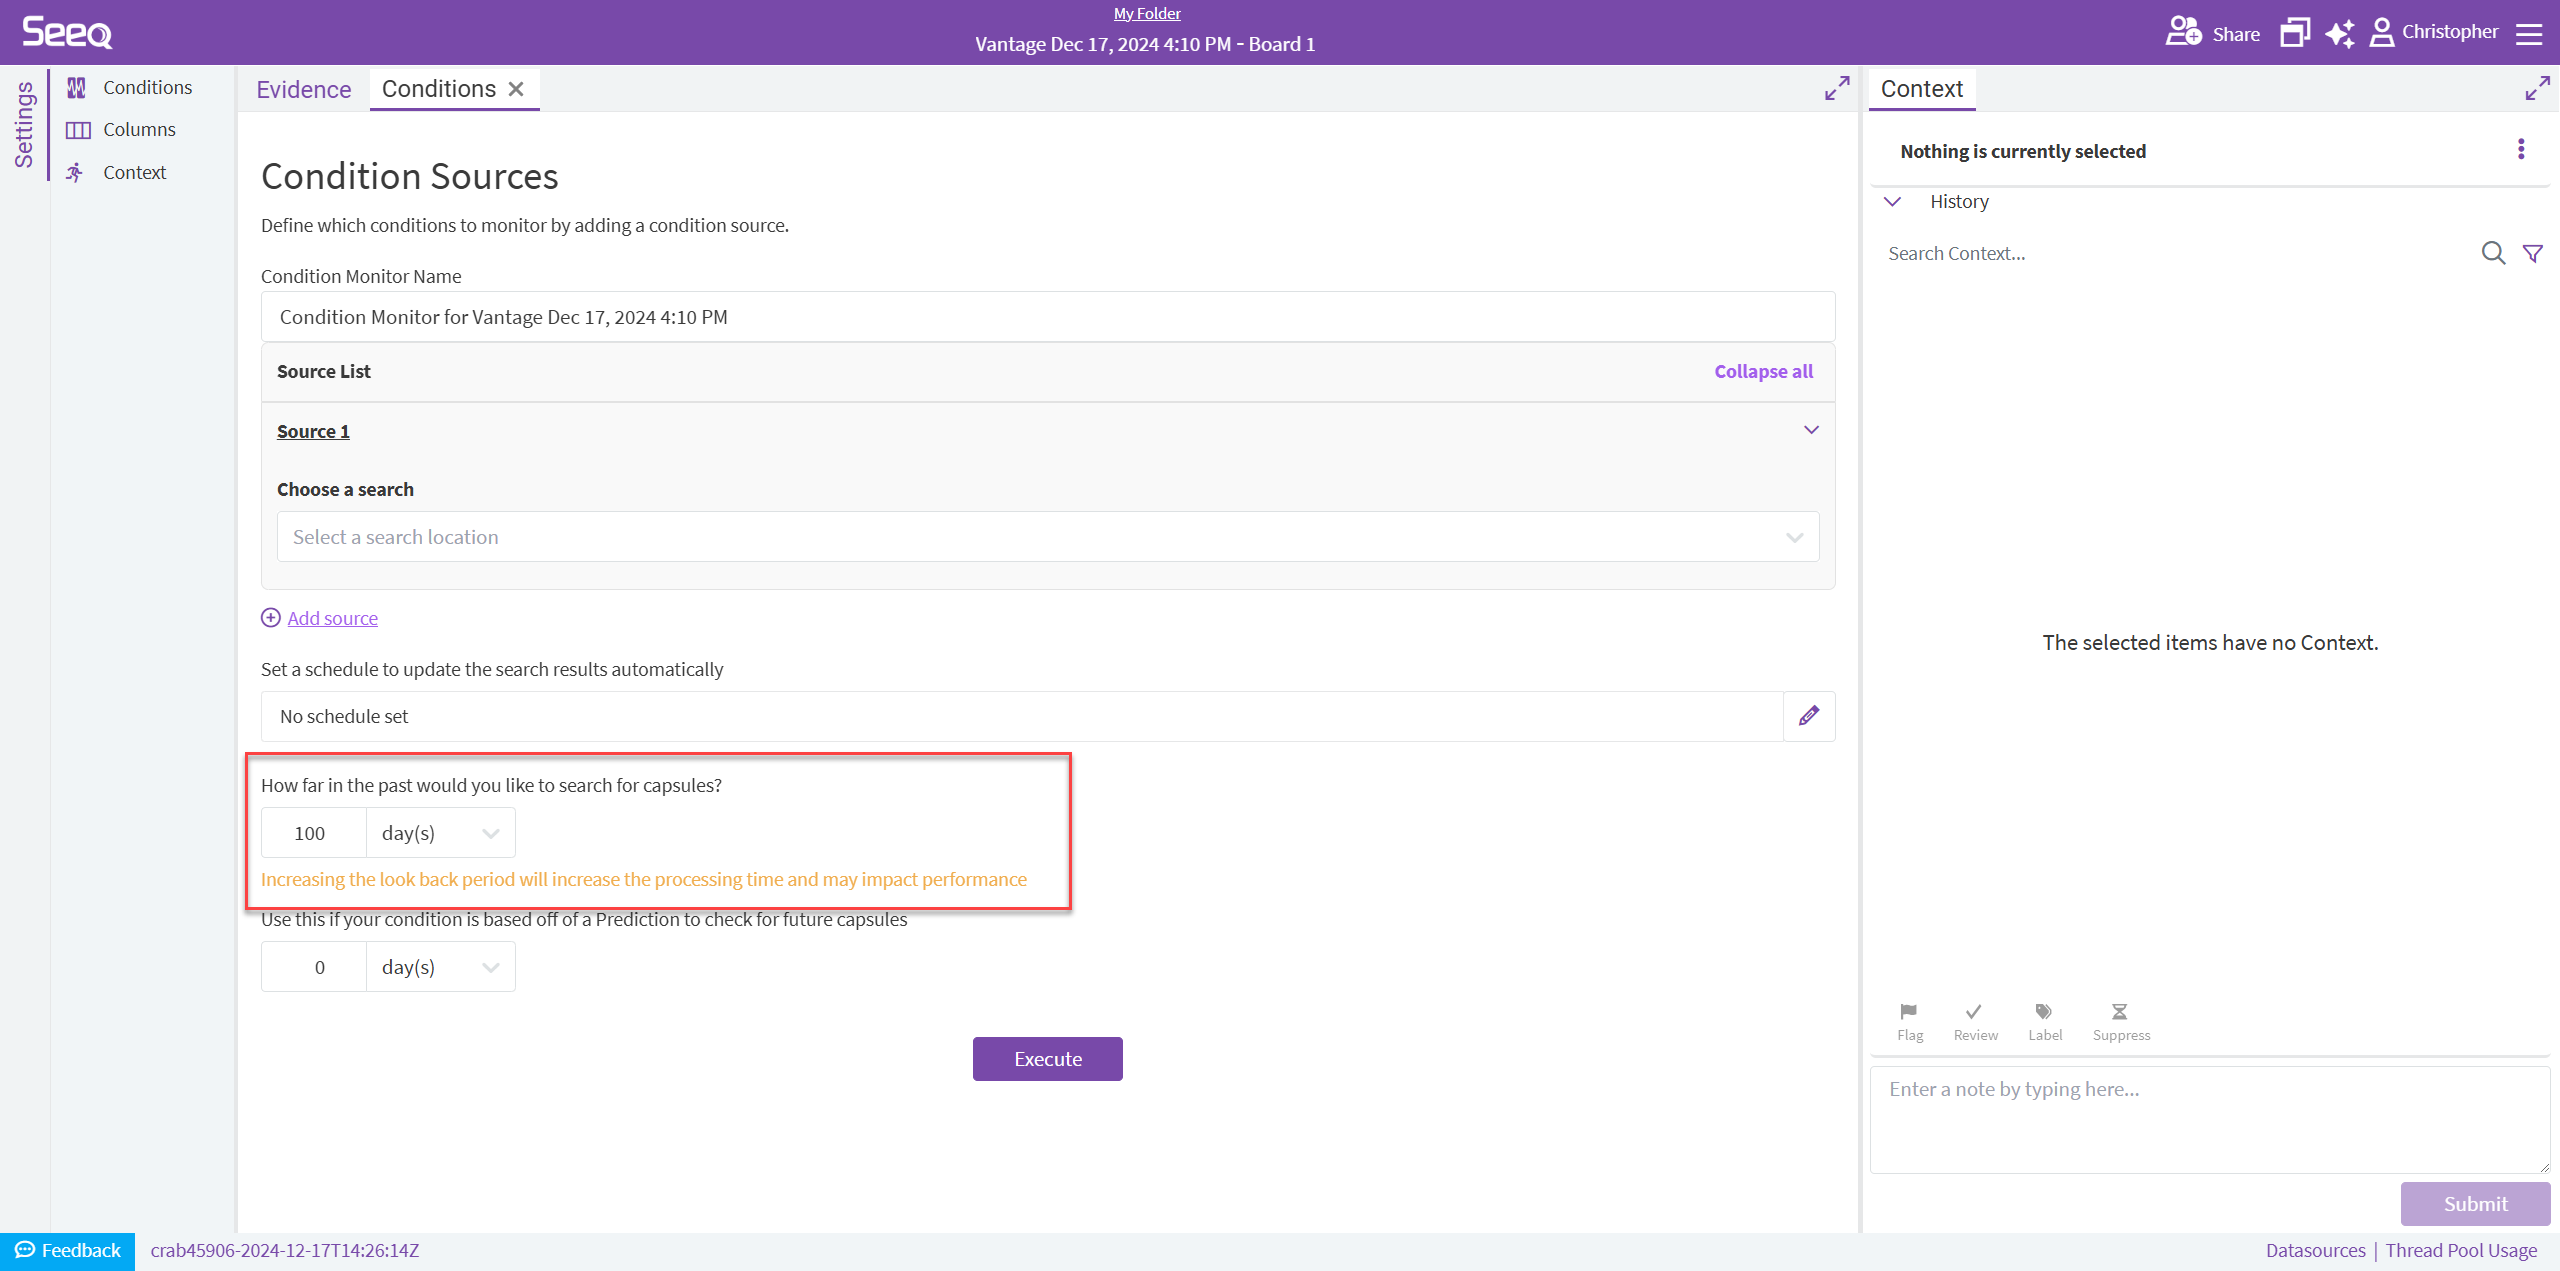
VANTAGE Condition Monitor Lookback more than 28 days
Both Lookback and Lookahead durations during configuration of your Condition Sources are now free-form, allowing you to enter the duration that fits your use case.
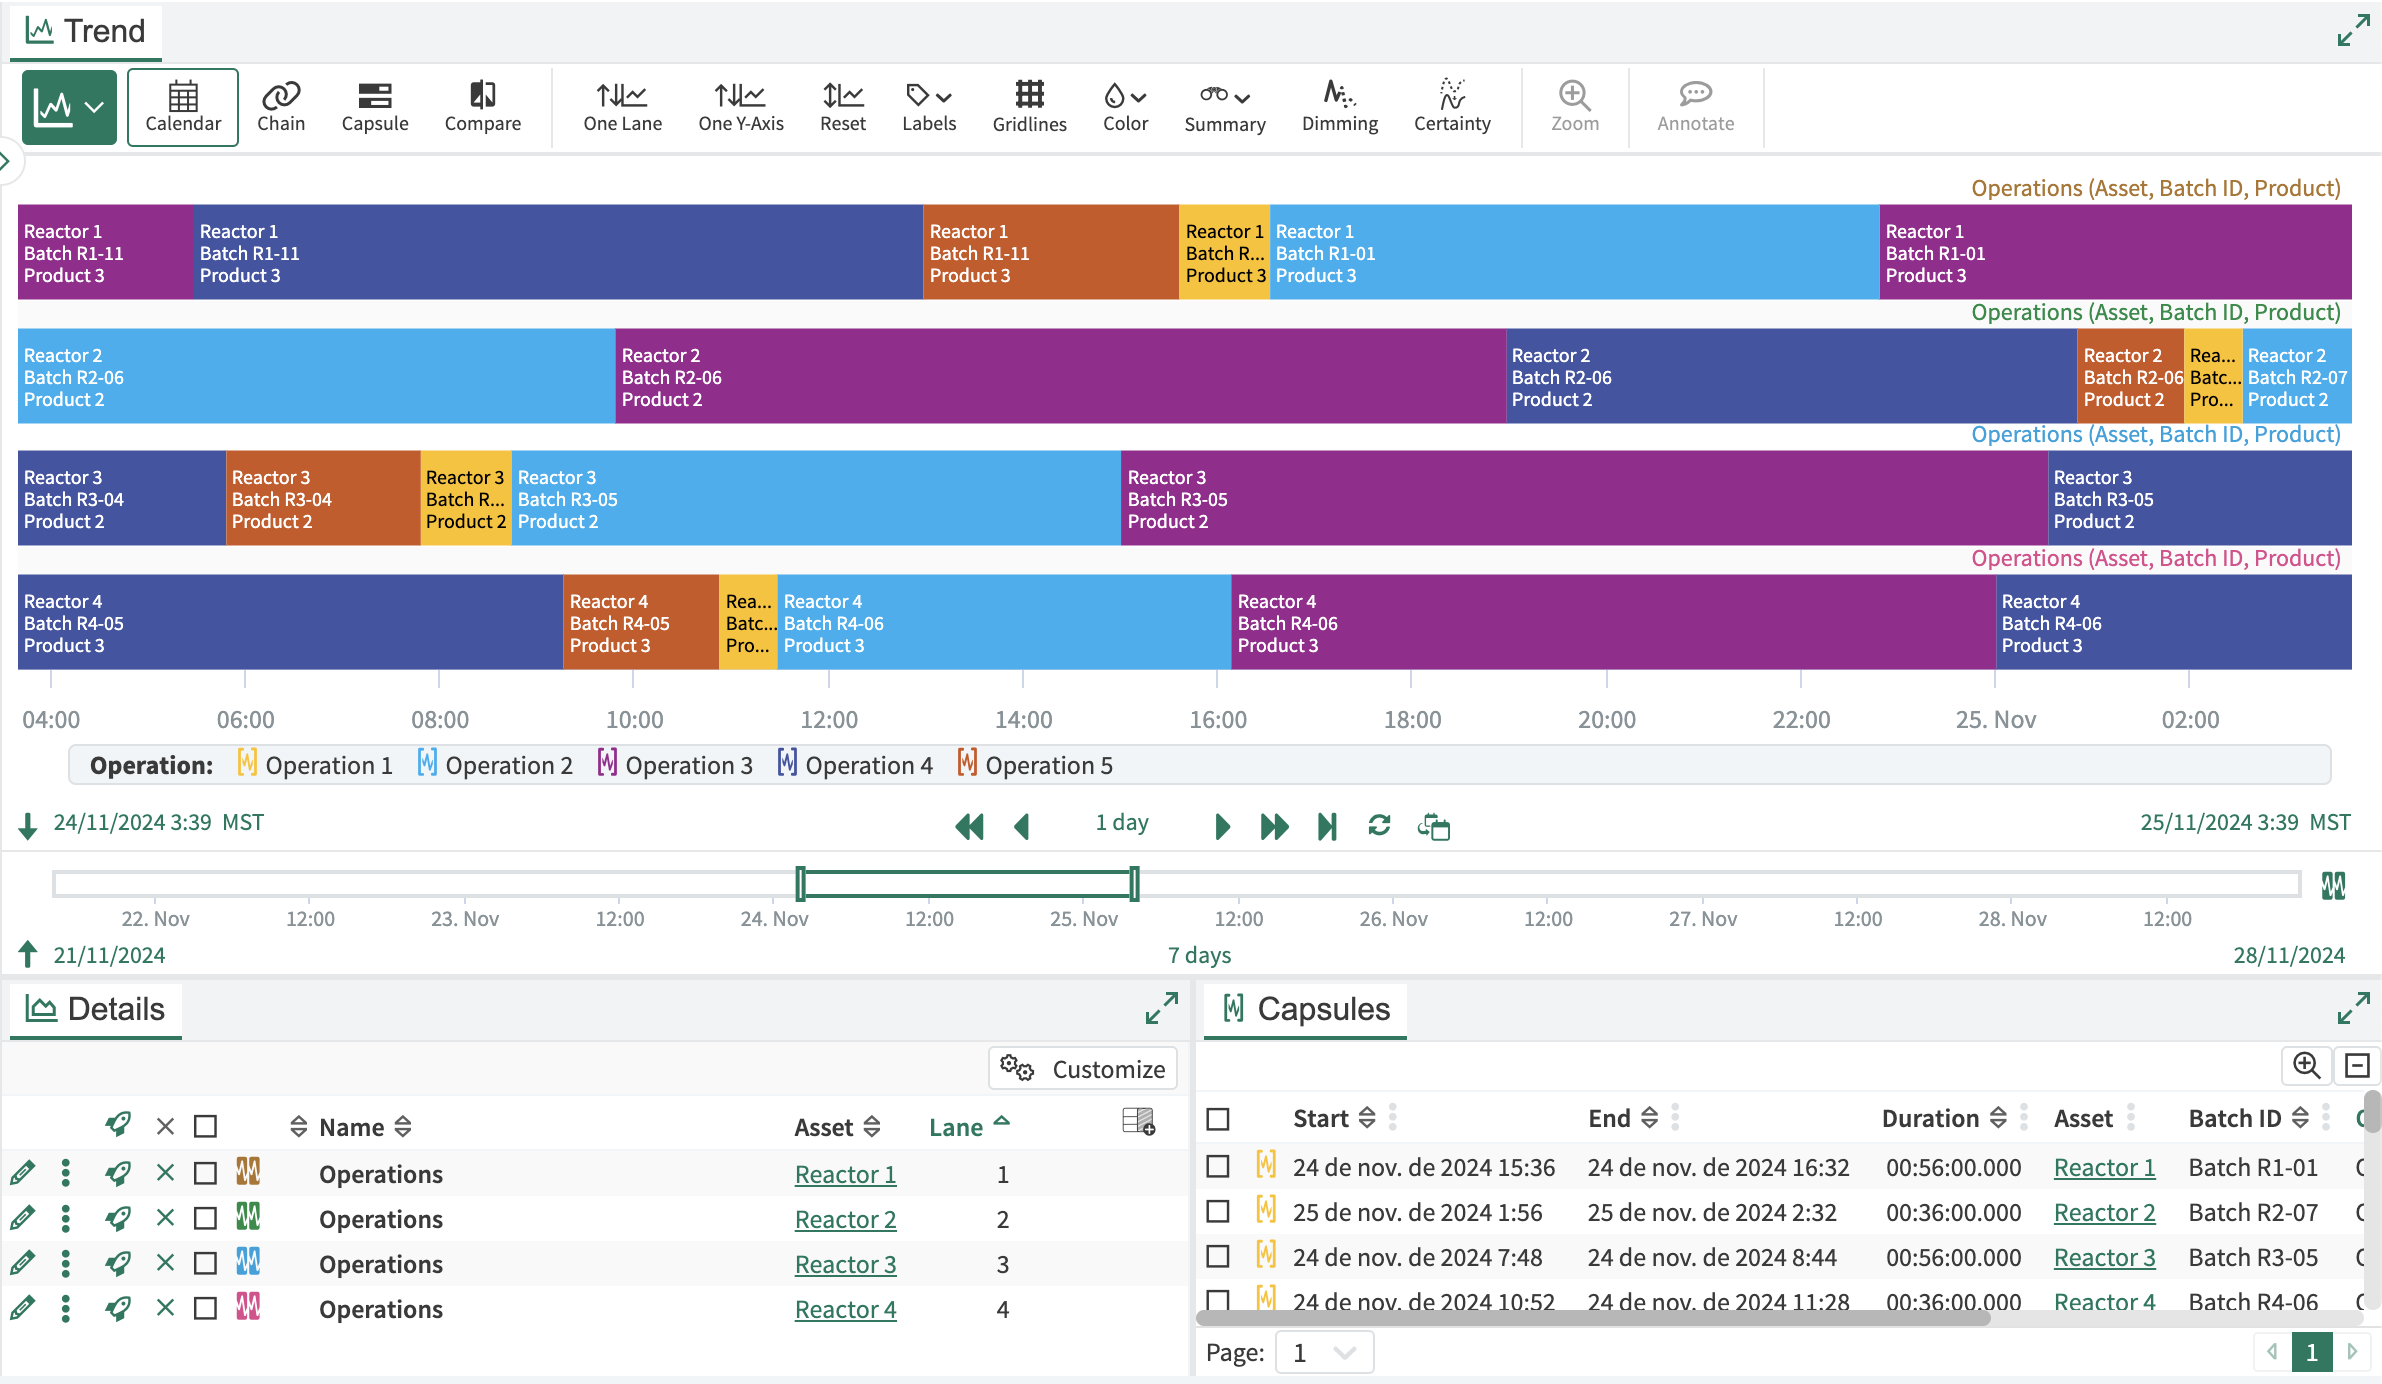
More Options for Coloring in Trend View
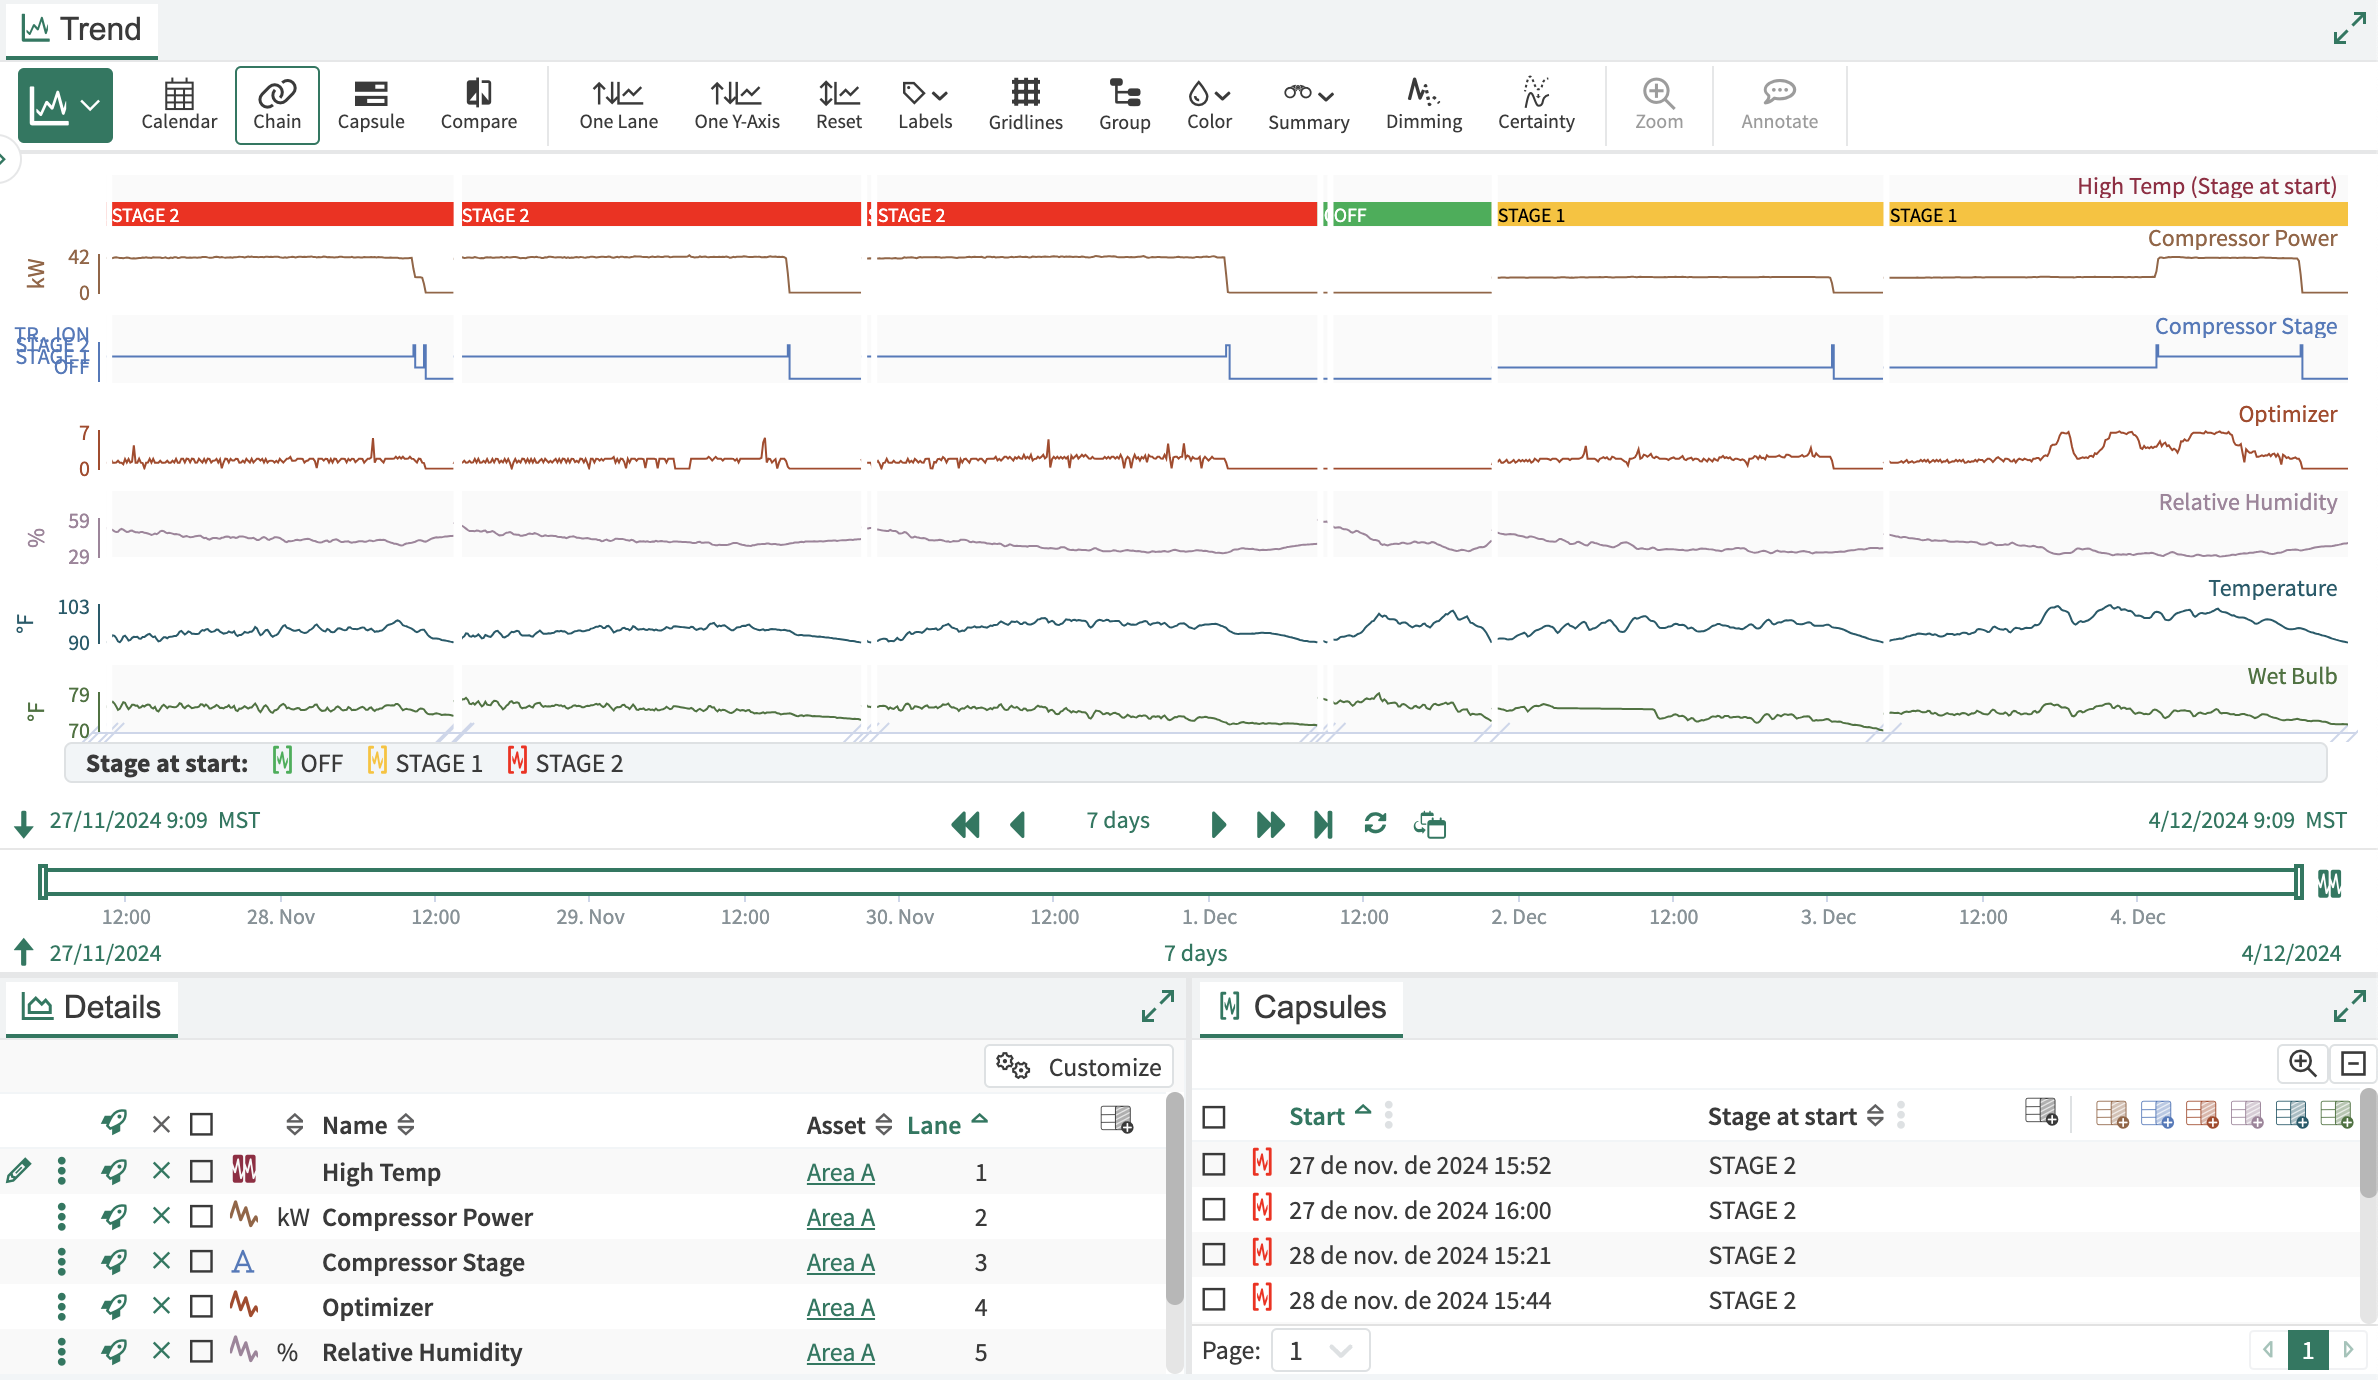
Calendar and Chain View now have a Color button in the Toolbar. This will look familiar if you have used Capsule view, Compare view, or XY Plot. Now you can change the color of signals, conditions, and other items right from the toolbar. In addition, you can do “conditional formatting” or color capsules by capsule property. This allows for additional visual information on the trend. This could be useful to color all capsules by Operation, color capsules that are longer than expected differently, or show some important contextual information to differentiate between High Temperature events.
Ask the AI Assistant to Document your Analysis
The Actions Agent in the AI Assistant can help you document your analysis! Everyone loves the idea of journaling so their colleagues can understand, but it can be hard to put into practice. You can give it prompts like “document my analysis” or “add a workstep at the top of my journal”. The analysis documentation is based on the items currently displayed and their calculation hierarchy.
Organizer Dashboard Improvements
Dashboard content can be sized from any side instead of just the lower right corner. Content can optionally be overlaid over other content if desired to get your content into just the right place.
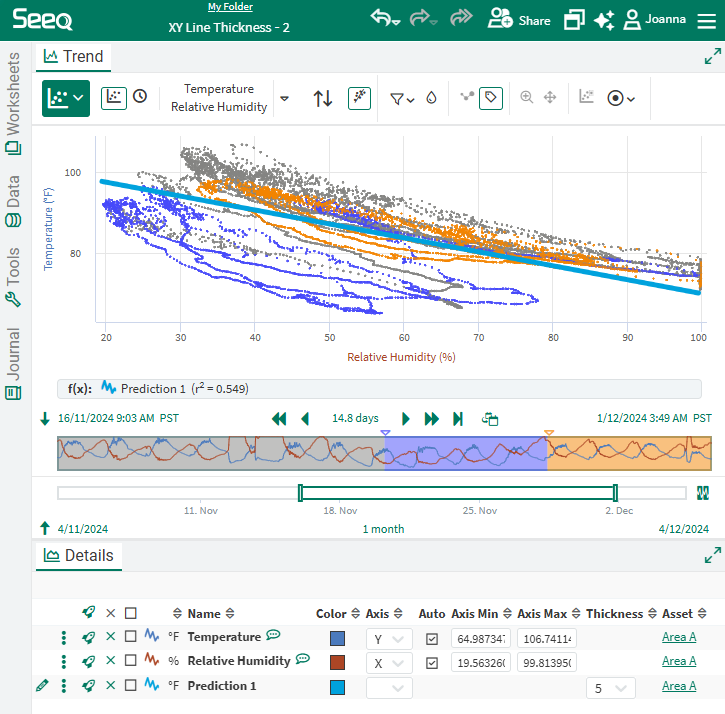
Configure Scatter Plot Line Thickness
A thickness column in the Details Pane allows you to configure the width of lines drawn on the scatter plot.
VANTAGE Group by Day, Week, Month or Year
You can now group by various date aggregations, like Day or Week, to more easily bucket events with Datetime columns, like Start and End.
VANTAGE Indication in Workbench that a Condition is monitored in Seeq Vantage
A small, clickable Vantage icon is now visible in your Workbench Details Pane, indicating a Condition is being monitored in a Vantage Room. When clicked, this icon will open a modal with details about the Vantage Room and a link to open it.

AI Assistant responds with Seeq YouTube Videos
The AI Assistant can now also provide helpful Seeq videos from the Seeq YouTube channel in case you prefer learning a video over reading instructions.
Audit Trail legibility improvements for Capability User Groups
Capability User Groups names replace GUIDs in the Audit Trail.
Interactive Treemap can Select Asset in Organizer Documents
Treemaps can now be inserted in Organizer Documents as interactive content. When attached to an asset selection, selecting a box on the Treemap will update that asset selection and any content associated with it. When viewers have the appropriate permissions to content in the Organizer, this asset selection from Treemap will work in Edit, View Only, and Presentation views, but it will only persist in Edit view. Asset selection from the Treemap is currently limited to assets that do not contain any asset children. Read more at Inserting Content - Documents | Set-Content-Properties[inlineExtension] .
Separable Administrator Capabilities
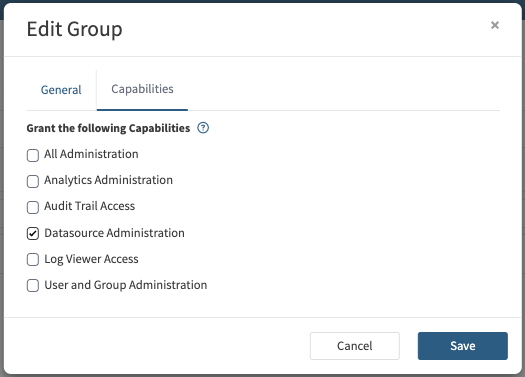
Previously, each individual was either a “user” or an “admin” in Seeq. Now, there are various administration capabilities that can be given to other users without making them a full Seeq Administrator. This allows users to have the capabilities they need without giving them unnecessary capabilities. Read more at https://support.seeq.com/kb/latest/cloud/administration-capabilities.
New bitwise functions in Formula
There are several new Seeq Formula functions for performing bitwise arithmetic. Added functions are bitwiseAnd, bitwiseOr, bitwiseXor , bitwiseShiftLeft and bitwiseShiftRight. These can be used on pairs of scalars or on a signal and a scalar. These signals and scalars should be decimal representation of integers. The signals need to be discrete or step interpolated.
For example, if you have a control signal indicating system state and want to check when the fourth bit is on, you can use bitwiseAnd($signal, 8) > 0 to create a condition for when that bit is active. See Formula Documentation for more examples.
More easily create Notifications
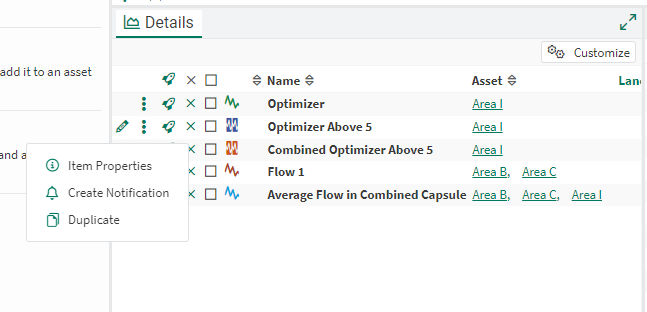
The first workflow for creating Notifications required you to know about item properties. Now you can create a notification from the three dot menu next to any condition in the Details Pane.
Flexible SCIM Token Validity
SCIM token validity can now be configured when generating a token from the Datasources Tab of the Administration Pane. Read more at SCIM.
Usage
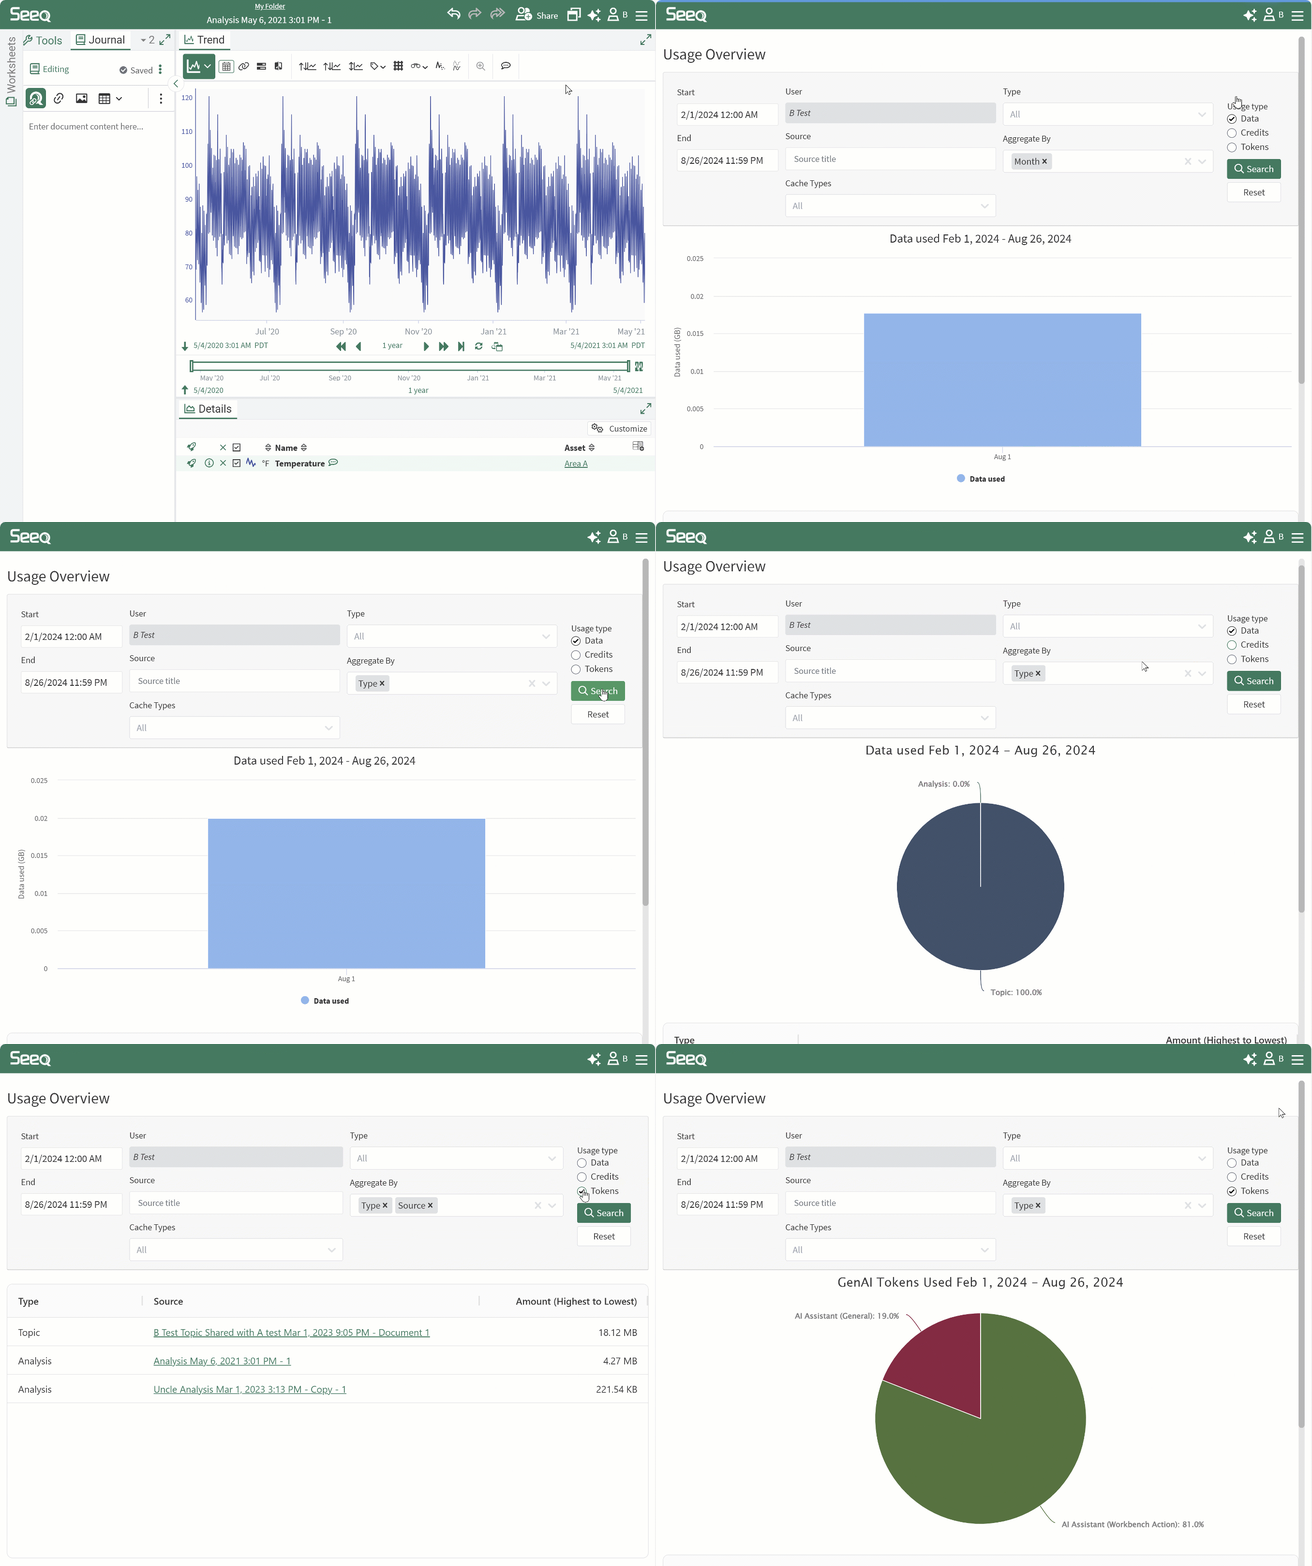
All users can now view their usage by selecting "Usage" from the dropdown menu in the upper right corner. This interface shows a variety of user activity, including workbooks accessed, projects run, and AI Assistant agents interactions. Analytics administrators are able to see this information for all users. Read more at Understanding Usage Data.
Filtering Tools
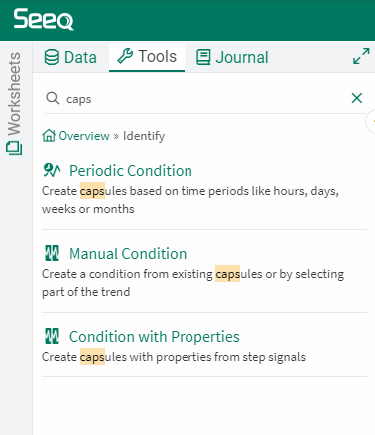
Now you can use the filter in the Tools Pane regardless of which level of Tools you are on. Previously this was only available at the highest level. You might find this particularly helpful if your organization has many Add-ons available.
Display Units
Seeq supports many units of measure, but there are still some units we do not yet support. Any user can add optional Display Units to any signal via the item properties. These will display in the trend and in the Details Pane. Read more at Display Units.
Seeq Directory Authentication Options
Many customers take advantage of Seeq’s OAuth 2.0 connectivity for end user authentication. But there are times when you need to collaborate with colleagues who may not be able to use that form of authentication.
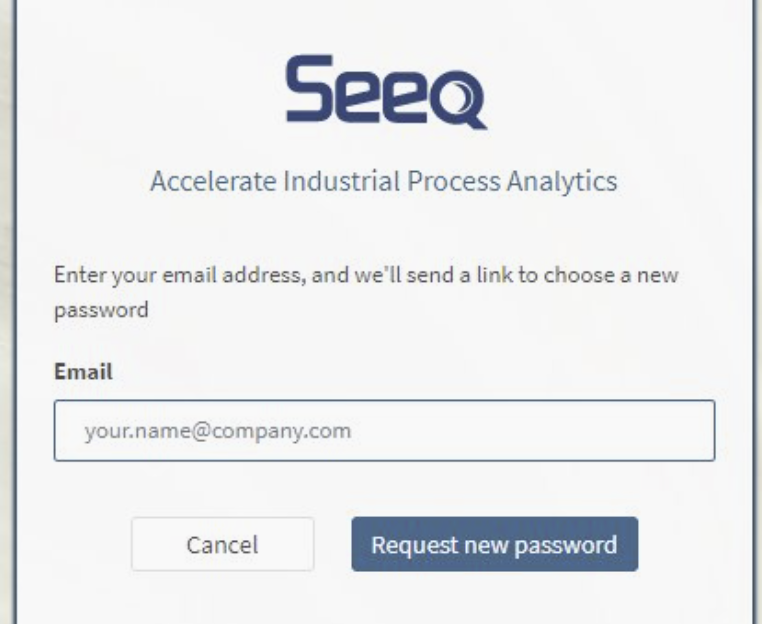
When the Seeq Directory is used, administrators can now require more advanced passwords and require users reset their password on the next log-in. See Enabling Seeq Directory Self-Service Password Reset for more details.
Intro video on home screen
Users who have been around for a while may remember we used to have an orientation video on the home screen. It is back, new and improved! This can help orient new users onboarding to Seeq before they have access to training.
AI Assistant for Formula Help
Where you used to get help directly in Formula from the AI Assistant, now there are sparkles that will launch the AI Assistant side panel with the Formula Agent active.
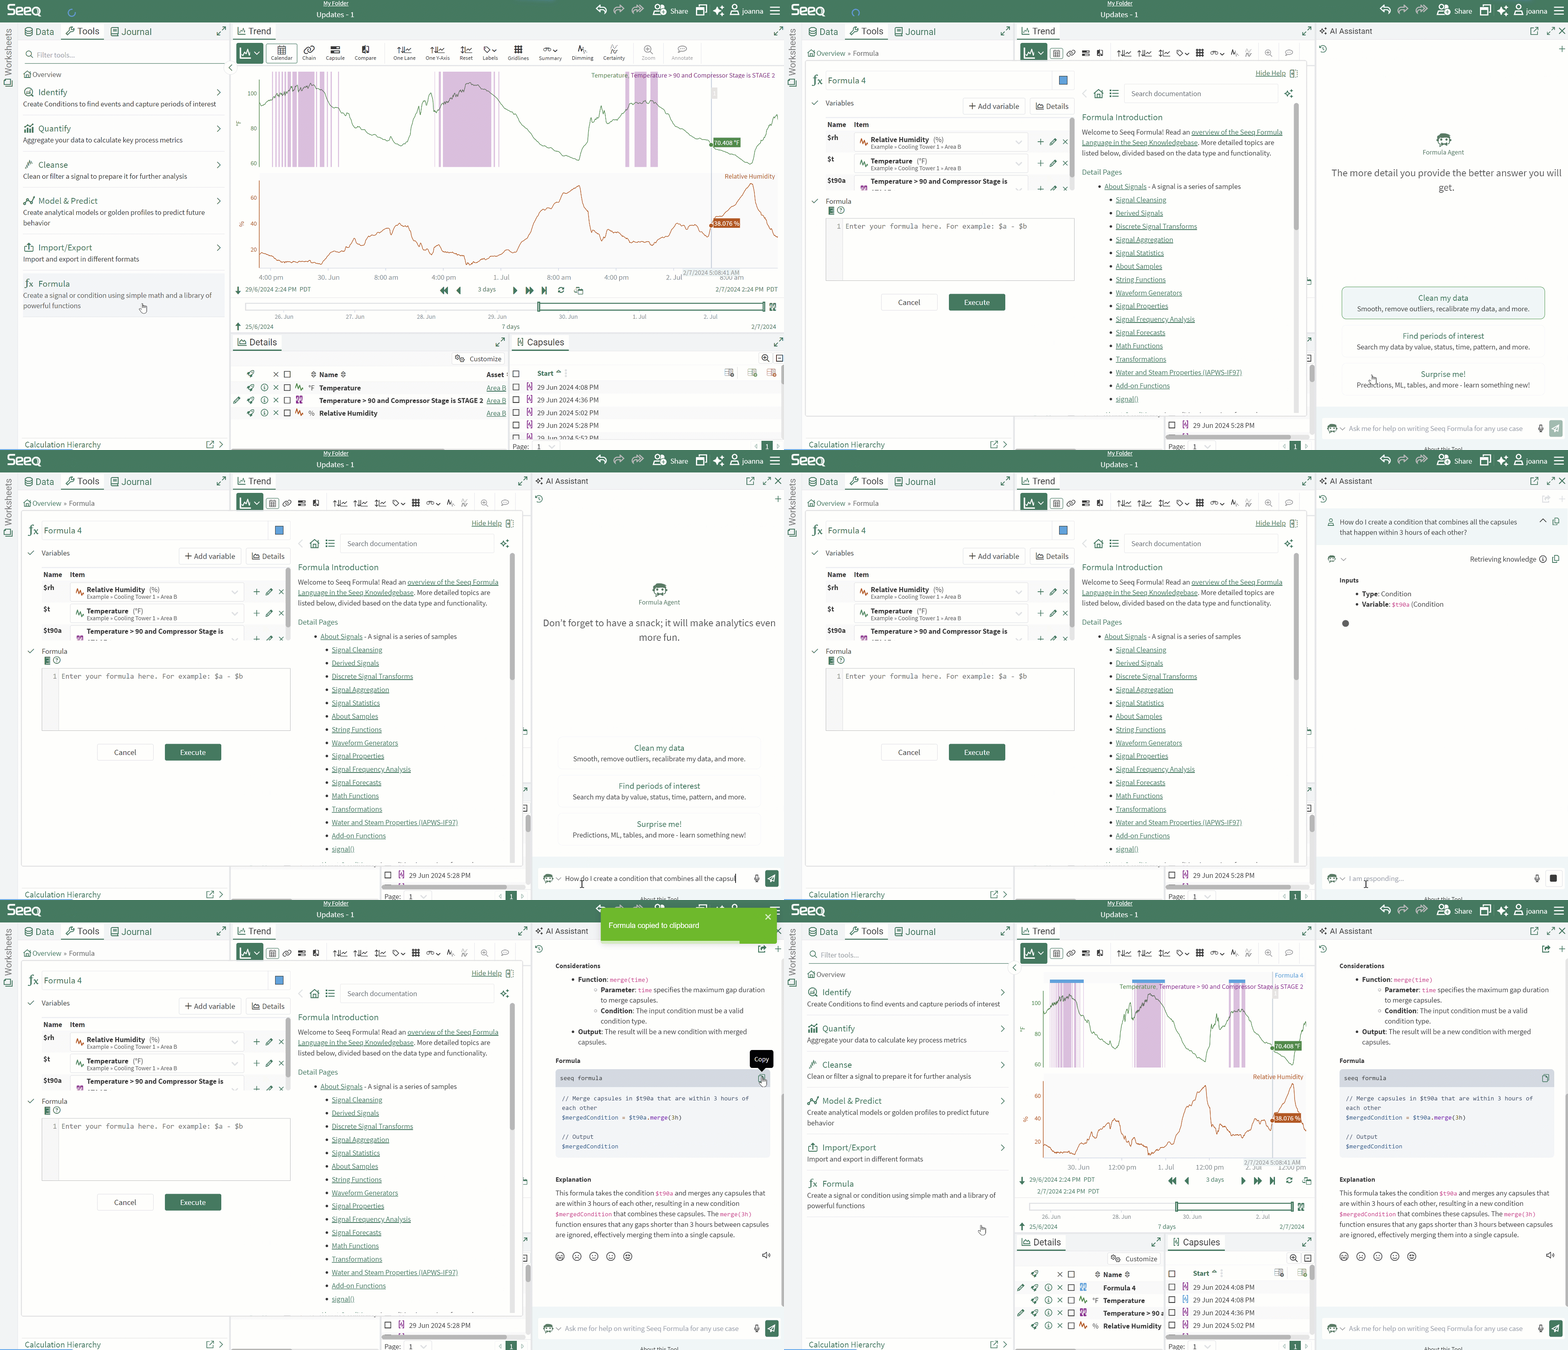
Convert to Formula
Part way through an analysis, you may want to make more complicated changes to a calculated item that you originally created with a tool. There is a new option in the Item Properties to allow any item that was created by other tools to be opened in the Formula tool for further editing. This makes it easier to continuously improve your analysis by seamlessly transitioning from a simple tool to a more complicated Formula based solution without creating a new item and mapping any other items that depend on the original item. This change cannot be reverted. Read more in Item Properties.
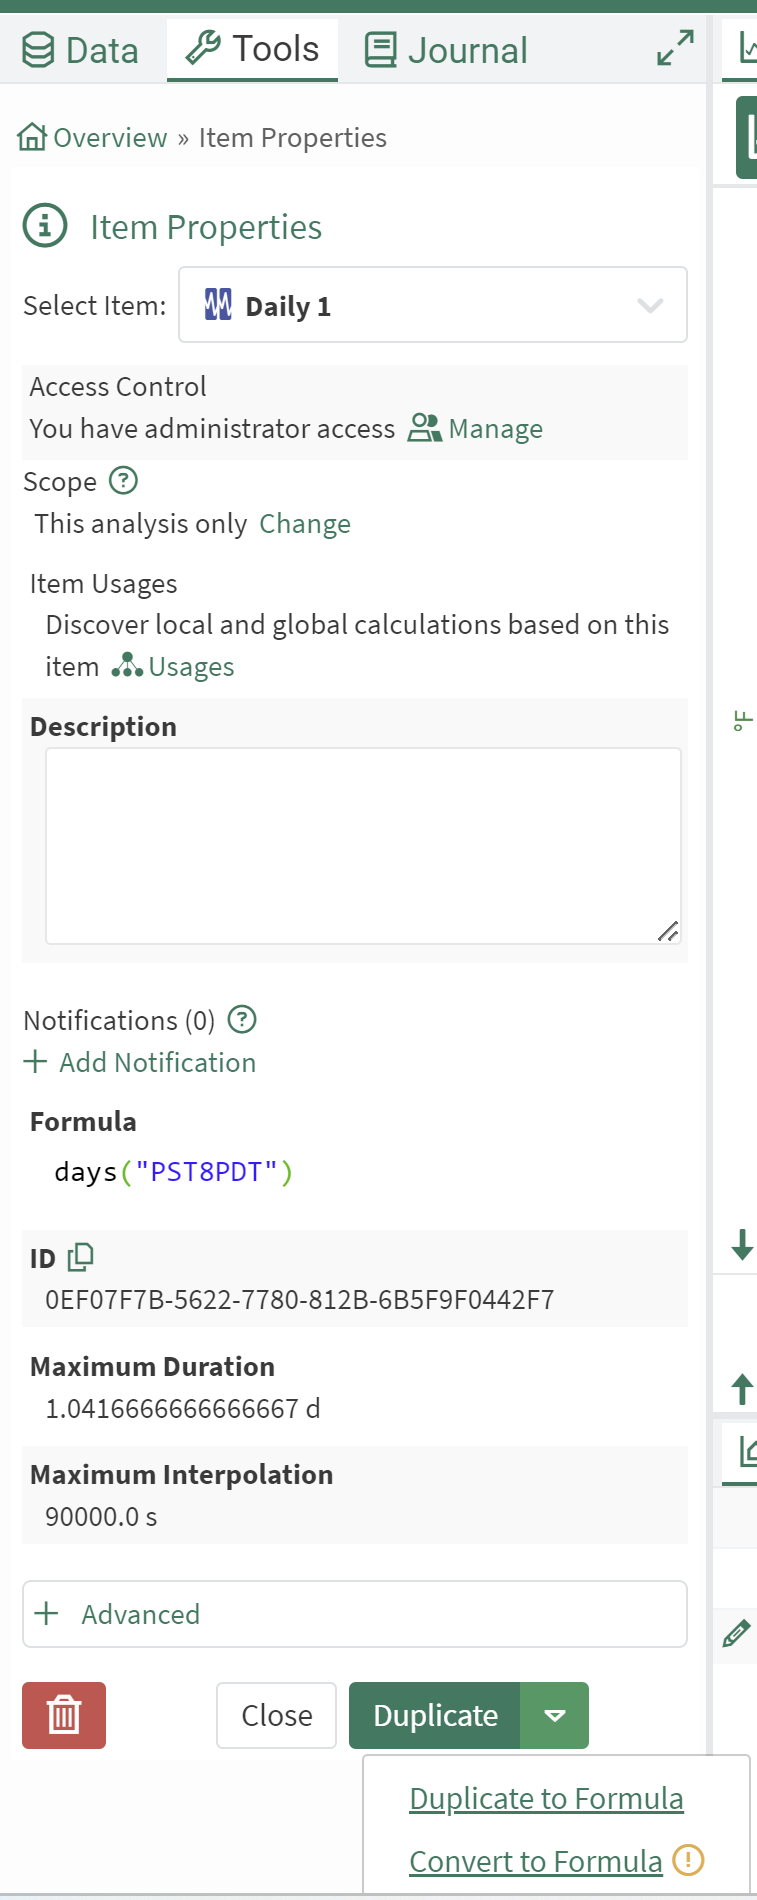
User Datasource Preferences
Some global customers have many datasources connected, but an individual working at a single site may not need to access all data. One way to manage this so individuals have less to search through is with access control. If your company has an open policy with access control but you are tired of sorting through datasources you have no interest in, navigate to the User menu in the upper right corner and modify your Preferences. There is a new tab to select datasource preferences. After selecting datasource preferences, any searches performed in Workbench will only be applied to the datasources selected. Read more here.
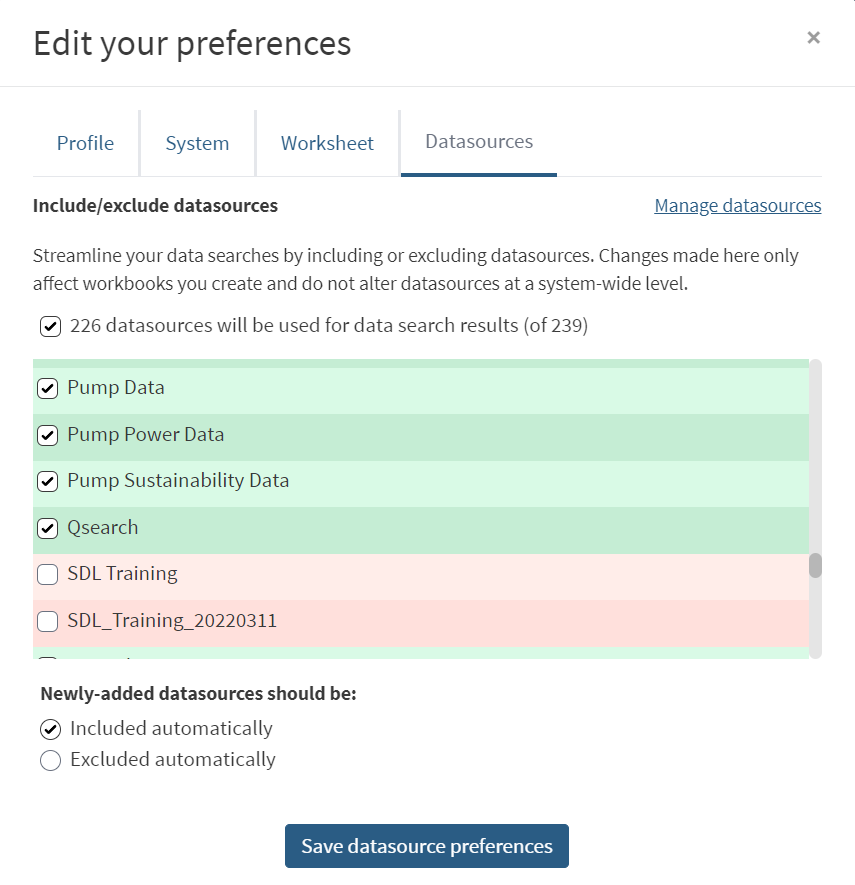
Flexible Layouts
We have introduced more customization to Workbench and Organizer layouts. You can move different parts of the interface around so that Journal can always be open, or the Details Pane can be somewhere else to maximize room for a trend. These layouts are saved for each user per application, so your Organizer layout might be different from Workbench. You can reset the layout to default from the User menu in the upper right corner.
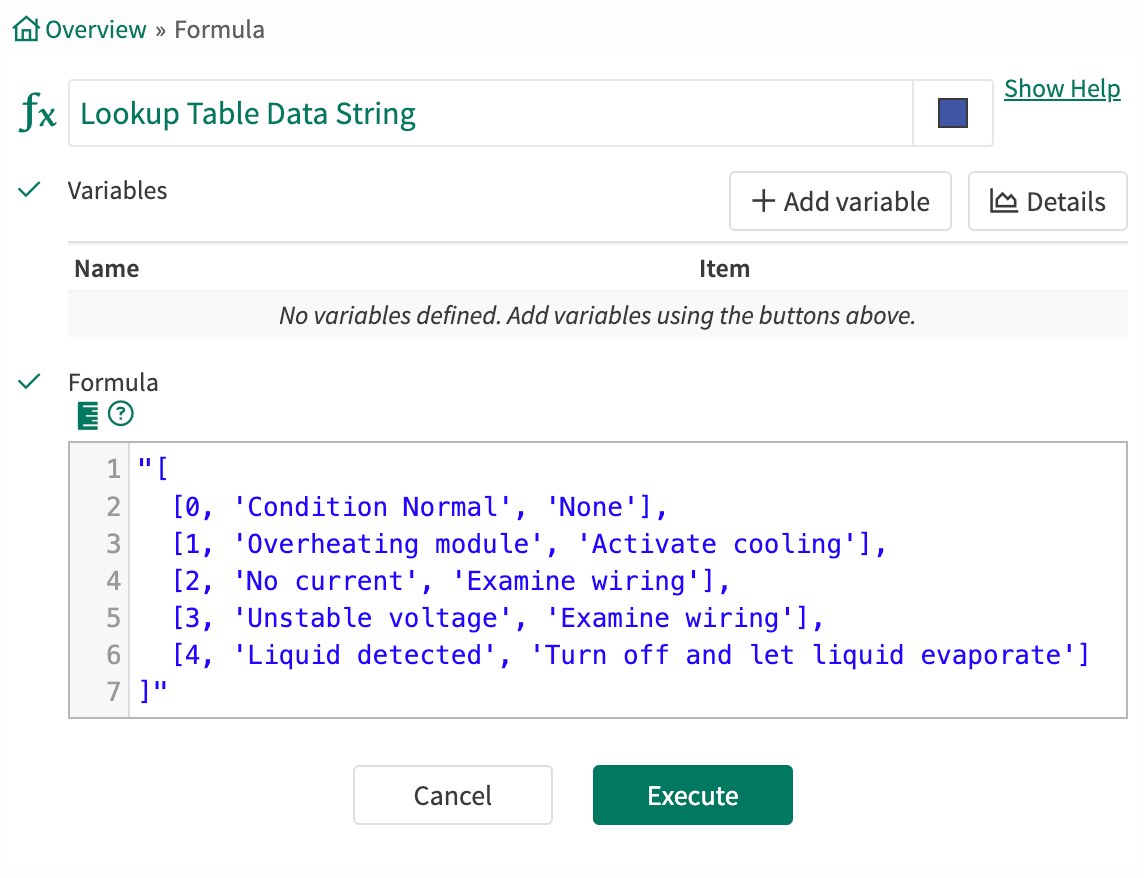
Multicolumn Lookup Tables
Now a single table can have multiple columns to lookup against. Additionally, the “experimental” name has been dropped from these operators.
Read more here.
Option to talk to the AI Assistant
Use the microphone icon in the AI Assistant to ask your question verbally instead of typing!
Overriding dashed lines in charts
We've heard from many of you that the hollow capsules and dashed lines lead to questions from your audience. While advanced users should probably understand the nuances of certain and uncertain data for performance, you can choose to not reflect uncertainty in the trend by using the Certainty button in the toolbar. Seeq will still correctly update values that may change, but you will no longer need to explain why a monthly average calculation becomes dashed part way through the trend.
You can also apply this when inserting content in Organizer.
