Clustering
What is Clustering?
Clustering is an unsupervised machine learning technique that groups similar data points together while keeping dissimilar data points in different groups. Unlike supervised learning methods that require labeled data, clustering algorithms discover patterns and structures in data without prior knowledge of group assignments.
In the context of time series data, clustering helps identify:
Similar operating regimes or modes in process data
Natural groupings of process behavior
Segments of data with common characteristics
Anomalous periods that differ from normal operations
How Clustering works with Time Series Data
The Clustering tool in Seeq implements K-means clustering, which partitions your data into a specified number of clusters (K), where each data point belongs to the cluster with the nearest mean (cluster center).
Using the Clustering Tool
Find the Clustering Tool under the Machine Learning section of the Tools Pane, or use the “Filter Tools” text box.
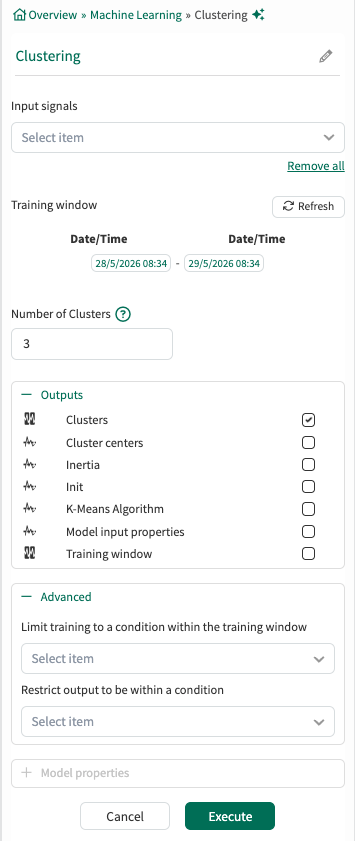
Input signals: From the dropdown menu, select one or more signals to cluster.
Training window: Select the fixed window of data on which the model will be trained. This defaults to the display range but can be modified.
Number of Clusters: Specify how many clusters to identify (default is 3).
Outputs:
Lists all outputs available for the current tool configuration. Choose which outputs the tool should generate and add to Trend. Default outputs are preselected, and additional supported outputs can be selected as needed. For detailed descriptions of each output, see the output documentation.
Advanced Options:
Limit to condition within training window: You can choose to limit the data supplied for training to data from within the training window and within a condition. For example, choose a condition that identifies when an operation is running and all data outside of the condition (when the unit is not running) will be ignored for the model training.
Restrict output to be within a condition: You can limit the data displayed to only show results within a relevant condition. If you limit the model to periods of time when the unit is running, you would likely want to restrict the output to the same running condition. You can use different condition here than the training window if appropriate.
Click Execute to execute the tool.
The tool will create a condition with capsules representing different clusters. Each capsule will have a capsule property named “Cluster” with a value "Cluster X" where X corresponds to the cluster number.
Visualizations
Trend View
In the Trend View, you can create a view of the clusters by putting the clustering condition on the same axis as the signals, clicking on the “Color” toolbar button, and coloring the capsules by the “Cluster” capsule property.
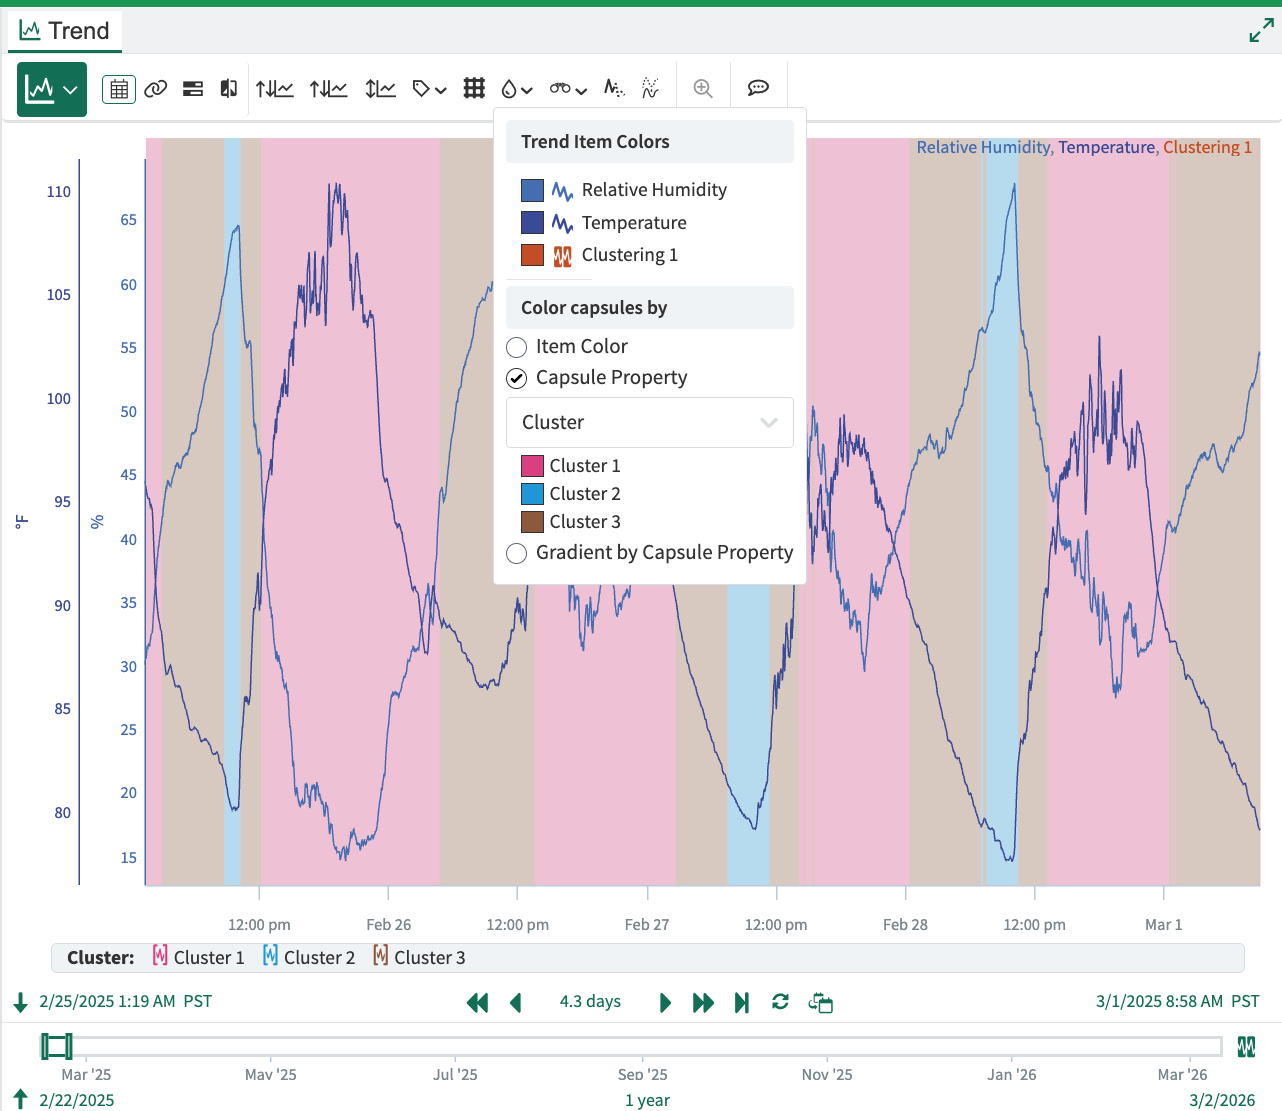
Example Trend view with clusters
XY Plot View
In XY Plot View, you can create a view of the clusters by clicking the “Color” toolbar button and selecting the “Cluster” checkbox under the “Color based on a capsule property” heading.

XY Plot Color modal
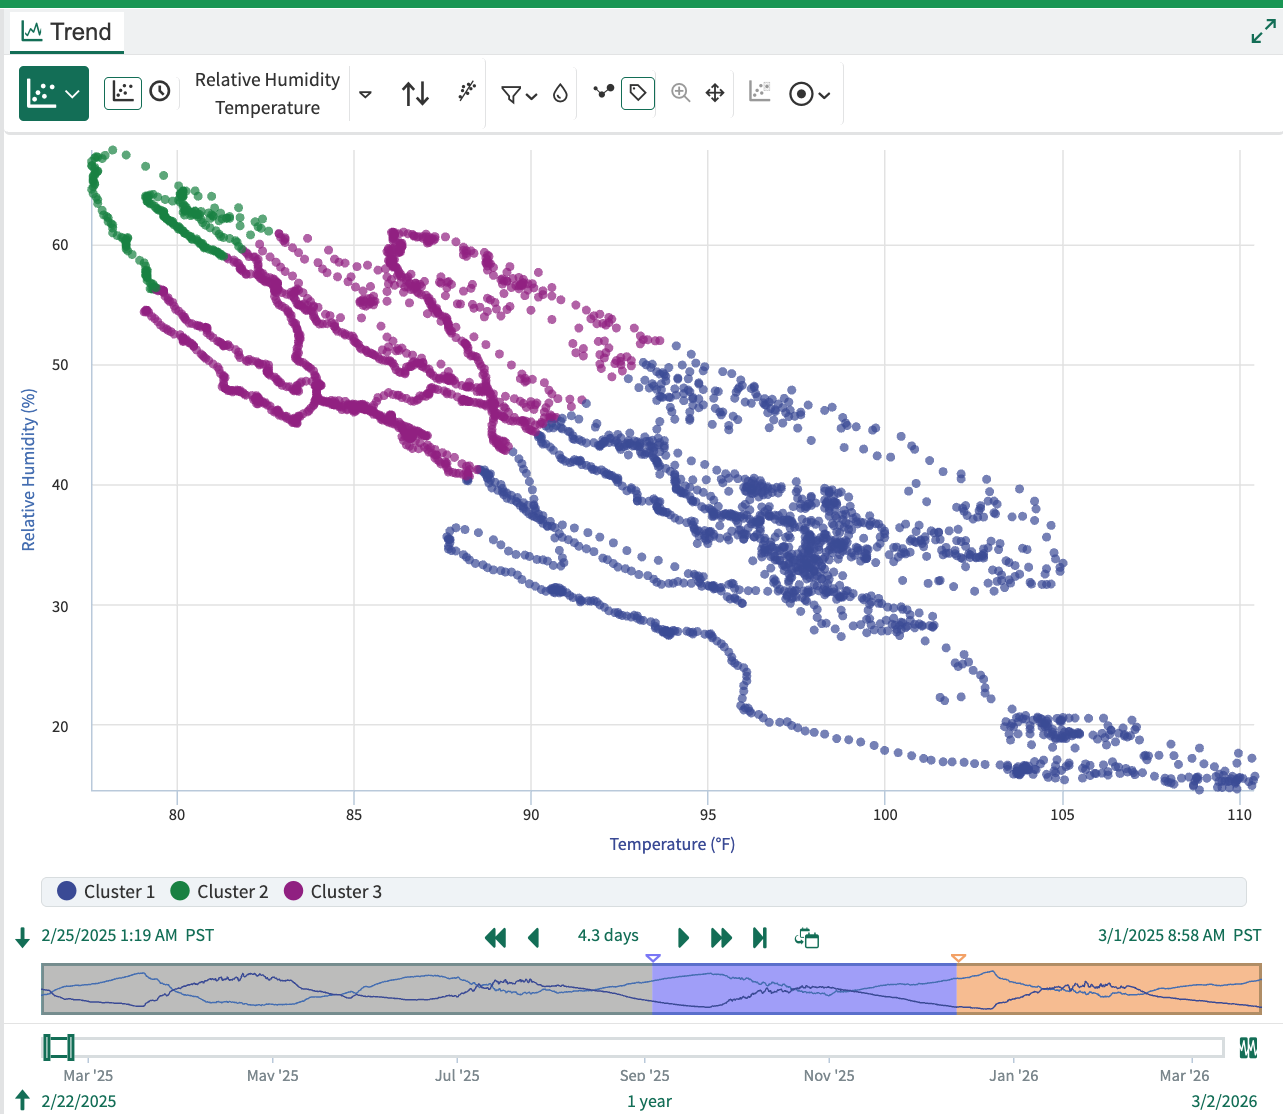
Example XY Plot with colored clusters
Model Properties
The Clustering tool provides detailed model information that can be viewed by expanding the Model Properties section:
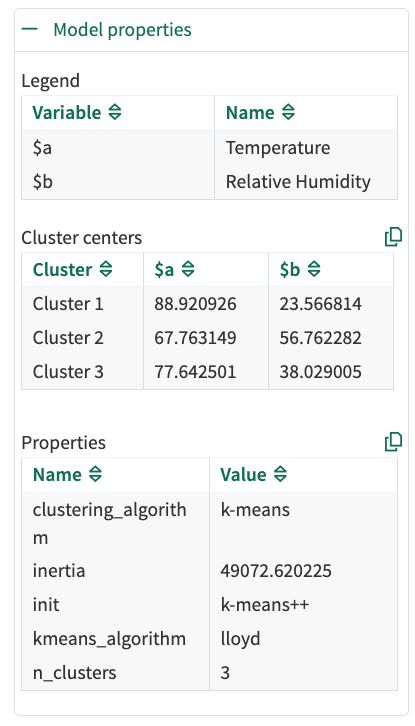
Clustering Model Properties
Legend: Maps input signal names to short formula variable names.
Cluster Centers: Shows the centroid coordinates for each cluster in the feature space.
Properties: Displays model metadata including:
Inertia: A measure of how internally coherent clusters are (lower values indicate better-defined clusters)
Clustering algorithm: The algorithm used (K-means)
K-Means algorithm. Lloyd’s K-Means is the standard form of the K-Means clustering algorithm.
Initialization method: How initial cluster centers were selected (the tool uses “k-means++”)
You can copy both cluster centers and model properties to the clipboard for further analysis.
Examples
Example 1: Identifying Operating Modes
Select process signals like temperature, pressure, and flow rate.
Set the training window to cover a representative period of operation.
Choose 3-5 clusters to identify distinct operating modes.
Run the clustering tool to create a condition with capsules for each operating mode.
Analyze the cluster centers to understand what characterizes each operating mode.
Example 2: Detecting Batch Similarities
Select quality parameters from multiple production batches.
Set the training window to cover all batches of interest.
Choose the number of clusters based on expected batch types.
Run the clustering to group similar batches together.
Use the resulting clusters to identify batch patterns and potential quality issues.
Tips and Best Practices
Signal selection: Choose signals that are likely to differentiate between different operating states or patterns.
Number of clusters: Start with a small number (2-5) and adjust based on results. Too many clusters can lead to overfitting.
Data preparation: Consider using Cleanse tools to remove outliers before clustering.
Interpretation: Use the cluster centers to understand what characterizes each cluster.
Validation: Compare clustering results with known process states or events to validate the identified patterns.