Understanding Usage Data
Users are interested in how much data is flowing through Seeq from their work and gain insight on which sources are driving traffic by exploring the Usage page.
Searching Usage Data
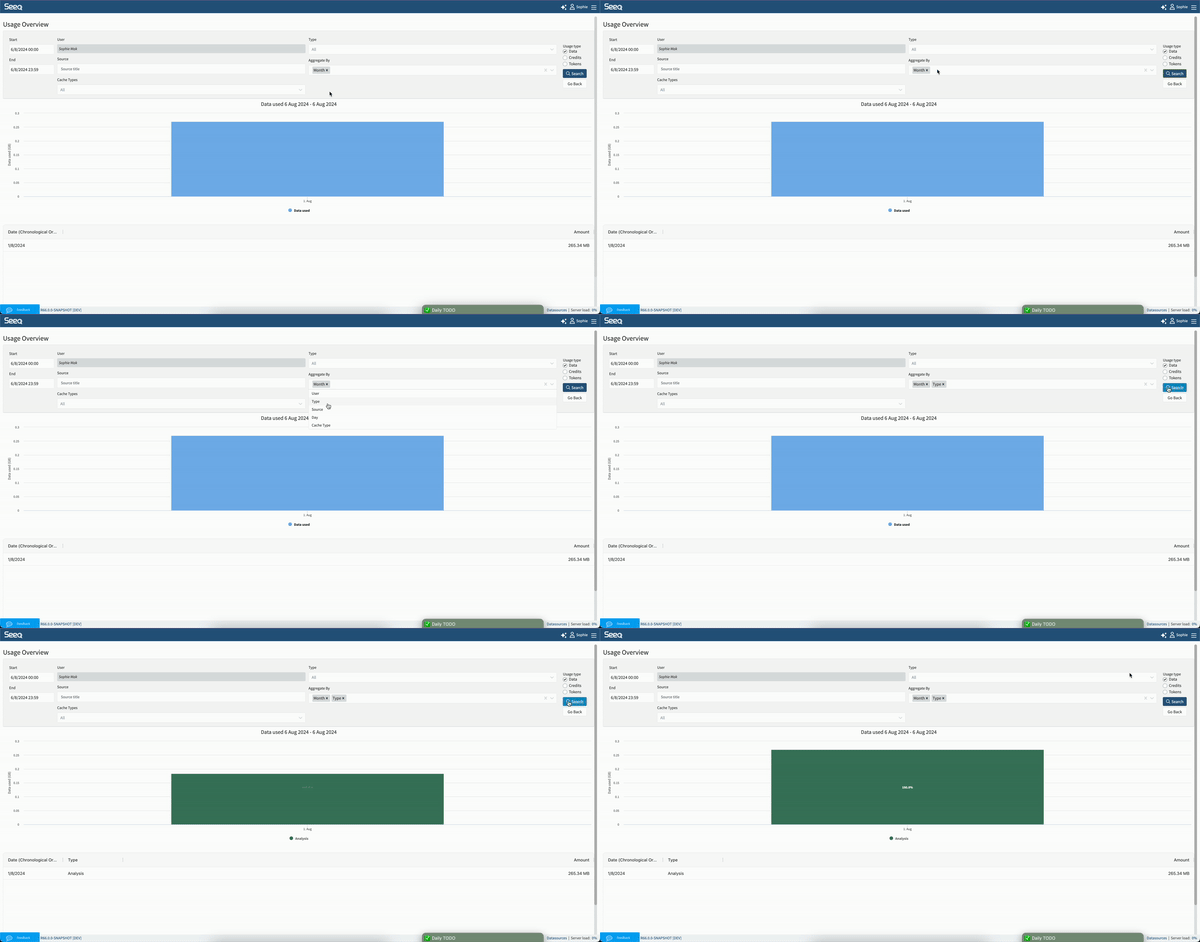
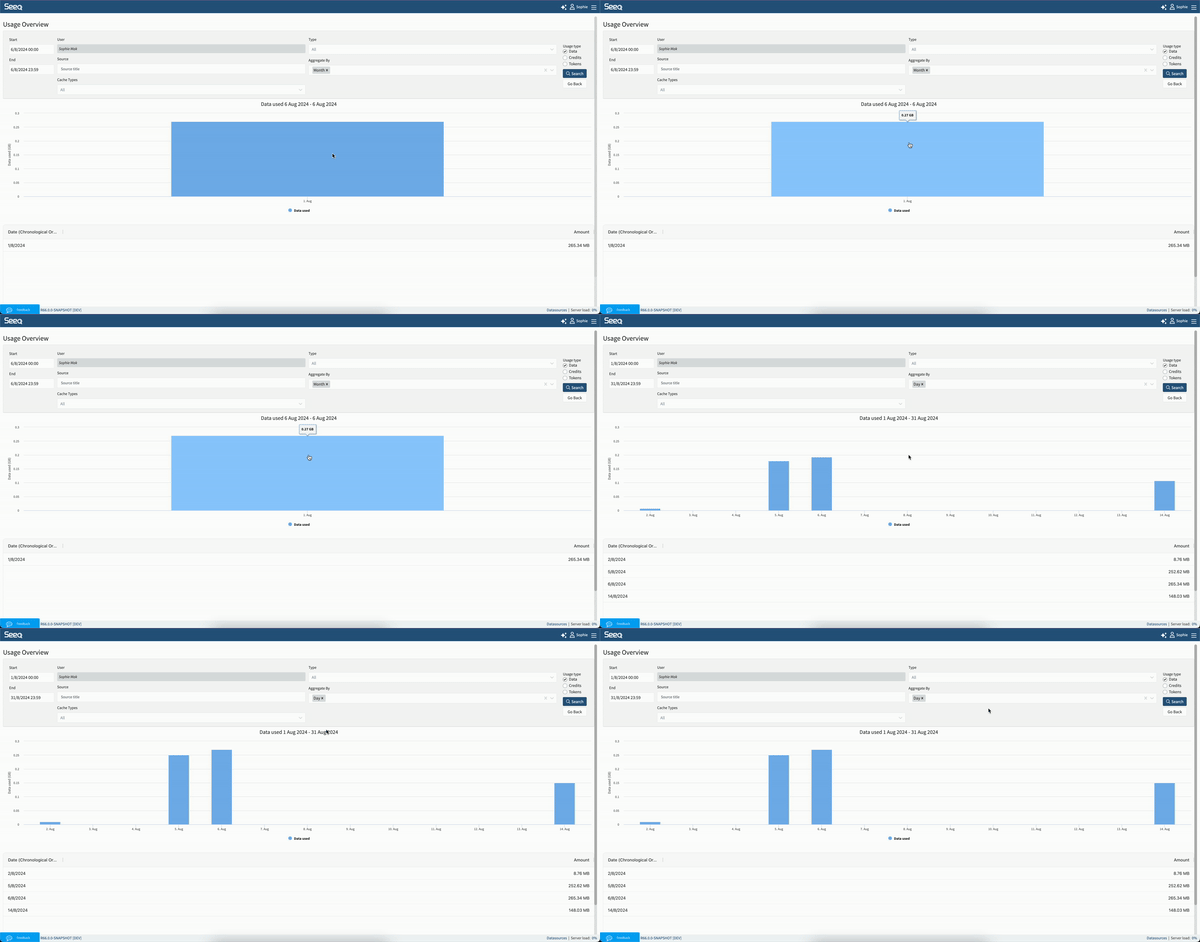
Access the Usage page from the user dropdown menu in the upper right corner of any page. The default view is monthly over the last 6 months, but different start and end dates can be entered. Click into the Monthly or Daily columns on the chart to see more detail. Apply various filters or change the dates to further narrow how you view the data. Scrolling down from the charts will reveal a table displaying the data. The image below shows adding Type as an aggregation:

Charts will display when there are two or fewer aggregations. When three or more aggregations are applied, the data will display in a table. Bar charts will display when aggregation includes a date, otherwise a pie chart will display. The pie chart will show the top 10 and group all others in an “Other” category.
Sorting is by date as long as day or month aggregation are applied, or no aggregation is applied. When aggregating by something other than date, results appear sorted by usage amount.
Usage Types
There are radio buttons on the far right of the search configuration to select which type of usage you want to view. The default is Data.
Data - All data either pulled from datasources to view or calculated within Seeq. involved in calculations will appear in a measurement of gigabytes daily. This includes data accessed from Seeq cache.
Credits - Data Lab Projects can be resourced with several sizes as needed. Credits are a measure of runtime of Data Lab Projects running with different resource allocations.
Tokens - Tokens are measuring AI Assistant help. Tokens are reported for both the prompt submitted and the answer received.
Content - All Organizer Content generations. This includes Content generated by a user loading an Organizer, a user downloading a PDF, or scheduled PDF generations.
Aggregation Types
Time - Month or day must be used independently of each other.
Source - Aggregate all data requested by each unique URL in Seeq. This might be a Worksheet, Topic Document, or Data Lab Project. The source is only recorded in R58 and later, so any data used prior to R58 will have N/A in this line. Going forward the source is also a link out to the item in view mode that used the data so you can see the latest state (date range, schedule, etc).
Type - Not all aggregation types are relavant to all usage types. You can aggregate all data flowing through Analyses, Topics, OData queries, Data Lab, REST API queries, ConditionMonitors (Notifications), and Add-ons. When viewing Credits, different size of Data Lab Projects will be relevant Types. When viewing AI Tokens used, types represent the different types of help you can get from the AI Assistant.
Cache Type - Data displayed in Seeq can come from datasources, a short term In-Memory Cache, or a longer term but not permanent Persistent Cache. When coming from a datasource, it is typically the first time the data is queried. Quick navigations from one view to another or when changing the date range within several minutes of the last update will likely result in some data coming from the In-Memory Cache. Caching enables a better user experience and can minimize traffic to historians. Read more about caching at Understanding Data Caching.
User - All usage by the user aggregated into a single number.
Examples of questions this interface intends to answer
Is my usage consistent or does it fluctuate?
Look at the default monthly view for consistency between months or choose a daily aggregation to see a daily trend over time.

How Usage Data is Calculated
Every user-driven request that passes through Seeq is captured and summarized in one entry for each distinct user, source, type combination on a daily basis.
A single sample is worth 16 bytes and a single capsule worth 64 bytes.
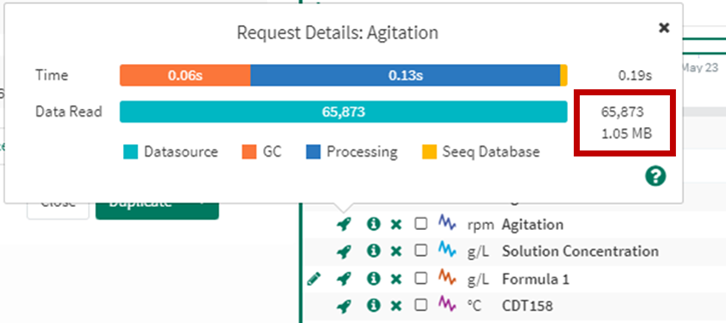
In Seeq Workbench, you can view the data involved in calculating and displaying a particular item on screen by clicking the rocket icon. The resulting popover will show the number of datums (samples and/or capsules) read and the corresponding total usage in B/KB/MB/GB.

Requests to any connected datasources (regardless of whether persistent caching is enabled) are included in this usage data.
There is a GET/ usage API endpoint that can be accessed using the SDK if enterprise users want to query and display Seeq usage data in another application. (note that the “identityId“ property only works for administrators.)
This usage data is not the same as telemetry data, so any configuration changes on telemetry data will not impact this data.
Data Lab usage is measured in "Credits". The default Data Lab Project consumes 1 credit per hour and is measured in 1 second increments (0.01667 credits per hour). The credit consumption of other Data Lab Projects depends on their size, with larger projects consuming more credits per hour.
Usage Data Types
Usage data gets grouped into different types based on the application originally querying for the data. Below are the available types along with their descriptions. Note not all versions of Seeq will have every available type. Refer to the GET /usage/types API endpoint to learn about the current usage types available on your Seeq server.
Usage Data Type | Description |
|---|---|
Add-on | Queried from an Add-on Tool |
Analysis | Queried from a Workbench Analysis |
ConditionMonitors | Queried from a notification developed in Workbench based on a condition |
Data Lab | Queried from Seeq Data Lab |
Data Lab (Interactive) | Queried from an interactive Data Lab input into an Organizer Topic |
Data Lab (Job) | Queried from a scheduled Seeq Data Lab notebook |
Data Lab Resources XX_X | Credits associated with running a Seeq Data Lab project with XX_X resource size |
Export to OSIsoft PI | Queried from a calculation being written back to OSIsoft PI |
OData | Queried from an OData Export |
SPy (Standalone) | Queried from an external application using the Seeq Python module such as AWS Sagemaker |
Organizer | Queried from Organizer Topic content based on Workbench Analyses. Typically scheduled updates. All usage for scheduled updates of an Organizer will be attributed to the document owner’s account |
Topic | Queried from Organizer Topics based on the number of viewed pieces of content |
RestAPI | Data that is directly queried using an API endpoint |
Vantage | Queried from a Vantage room (separate from condition monitor usage). |
Data Usage Best Practices
There is not an expected amount of data that should be flowing through Seeq for any particular user. Data flow will vary day to day for ad hoc usage but can be anticipated, predicted, and managed for more routine monitoring workflows. Anticipate higher data flows when working with dense data, many assets, or data queries over long periods of time.
If your administrator indicates you are associated with much more data usage than others, see Best Practices for Workbench Performance be familiar with techniques to minimize large data pulls when navigating in Workbench. If you are pulling more data than others through Organizer Topics, check on the Organizer’s update frequency and amount of content and work with them to reduce that frequency if necessary. An administrator can use the interface outlined in Managing Organizer Topics to understand which scheduled documents have not been accessed recently. These may be good candidates to disable and reduce unnecessary data flow.
