Visualizations from Workbench Analysis and views from Vantage can be added as content to Organizer Topic Documents and Dashboards. This page details relevant inserting flows for Documents.
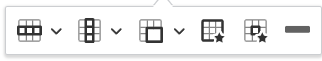
Insert Content options
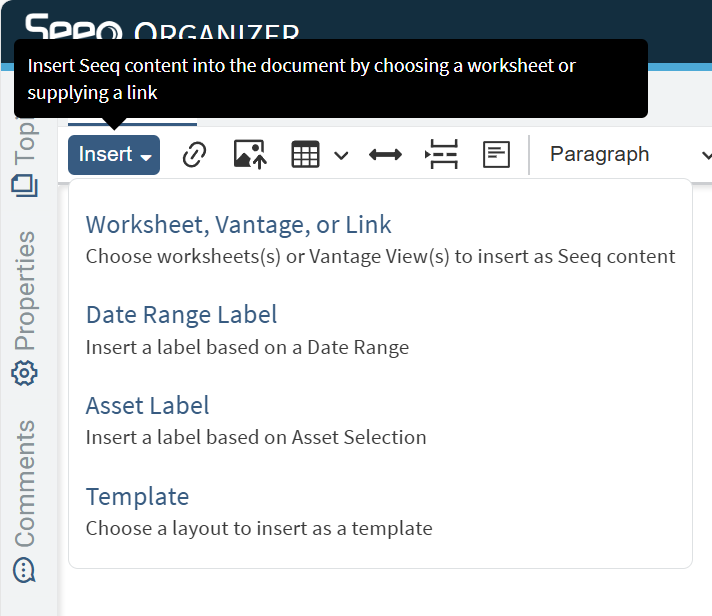
Use the Insert button in the toolbar at the top of the screen to insert Seeq content. This can be done by searching for a specific worksheet or by pasting a URL from Seeq. Multiple worksheets can be inserted at the same time. Only users with access to Seeq Vantage will see Vantage as an option here.
Documents have the following options:
Worksheet, Vantage, or Link: Opens a series of pop-ups to navigate to the Seeq content by selecting an analysis and then a worksheet. Multiple worksheets can be selected. There is a field to optionally paste a URL form a specific Seeq worksheet.
Date Range Label: Inserting a Date Range Label will insert a text blurb that can be associated with any date range configured to display in line and update the date range.
Asset Label: Inserting an Asset Label will insert a text blurb that can be associated with any asset selection configured to display in line when asset selection is changed.
Set Content Properties: Either way Seeq content is selected, the user is able to set properties such as image size and date range. Properties can be individually set for each piece of content in a single insert. The default properties are the most recently used properties.
Inserting content from a Worksheet or Room
Select an Analysis or Vantage Room...
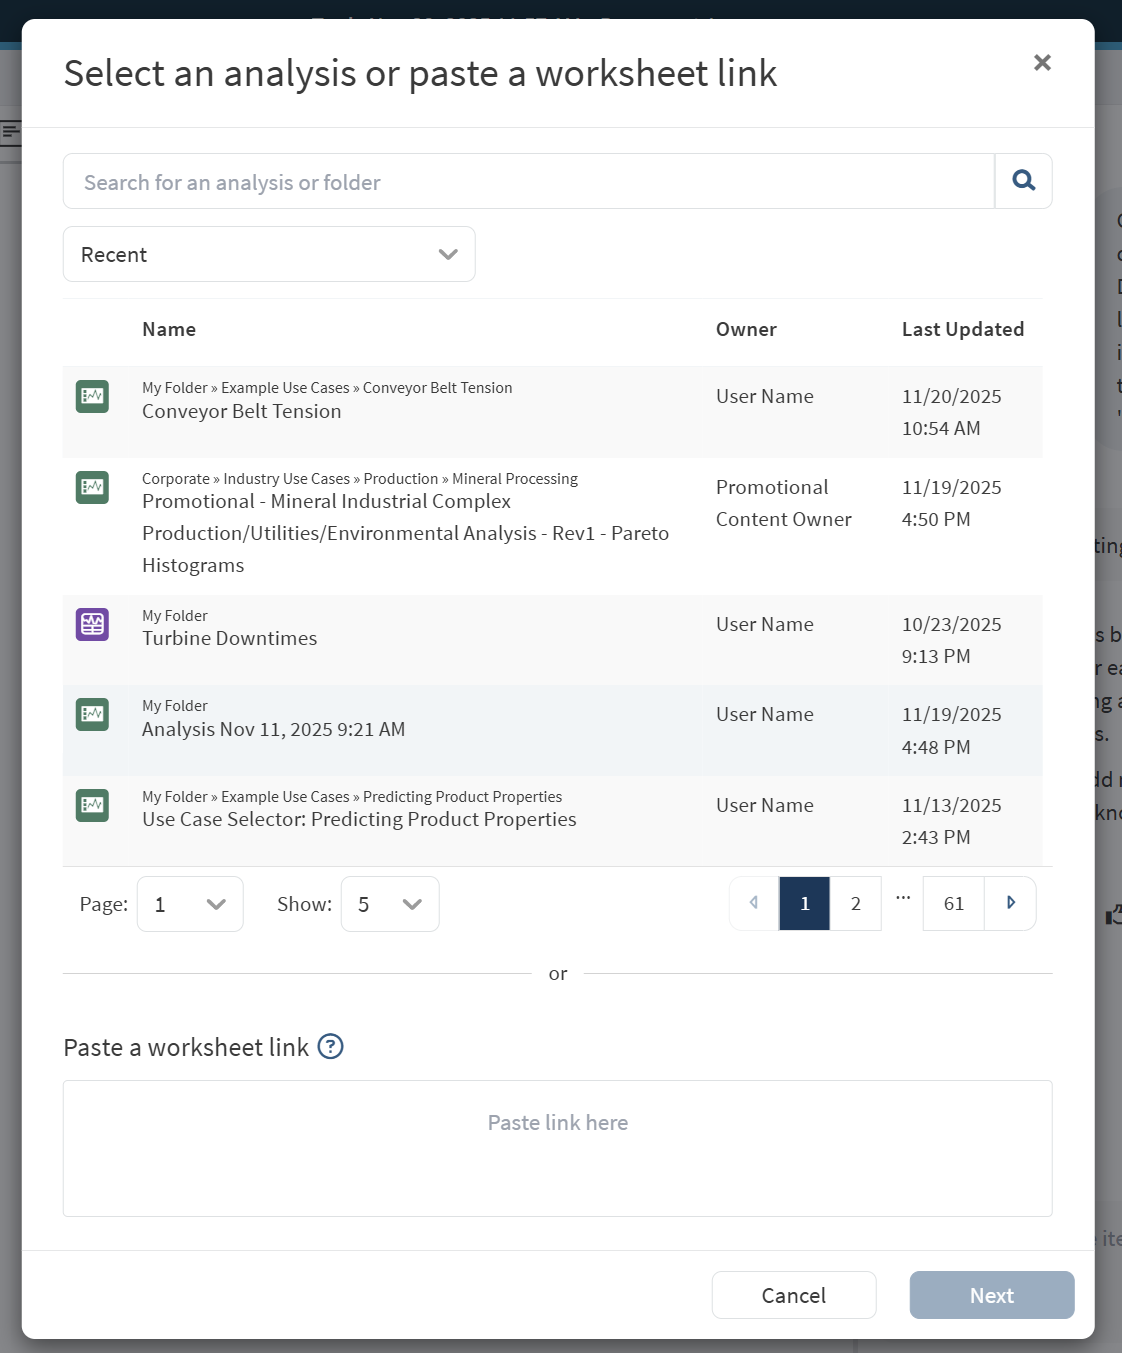
First navigate to and select the Analysis or Vantage from the modal. Note all filtering and search functions available on the home page can be applied (Public Items, My Items, etc.). Pinned workbooks are also available through this interface.
Select the item from the menu and the next pop-up will automatically appear.
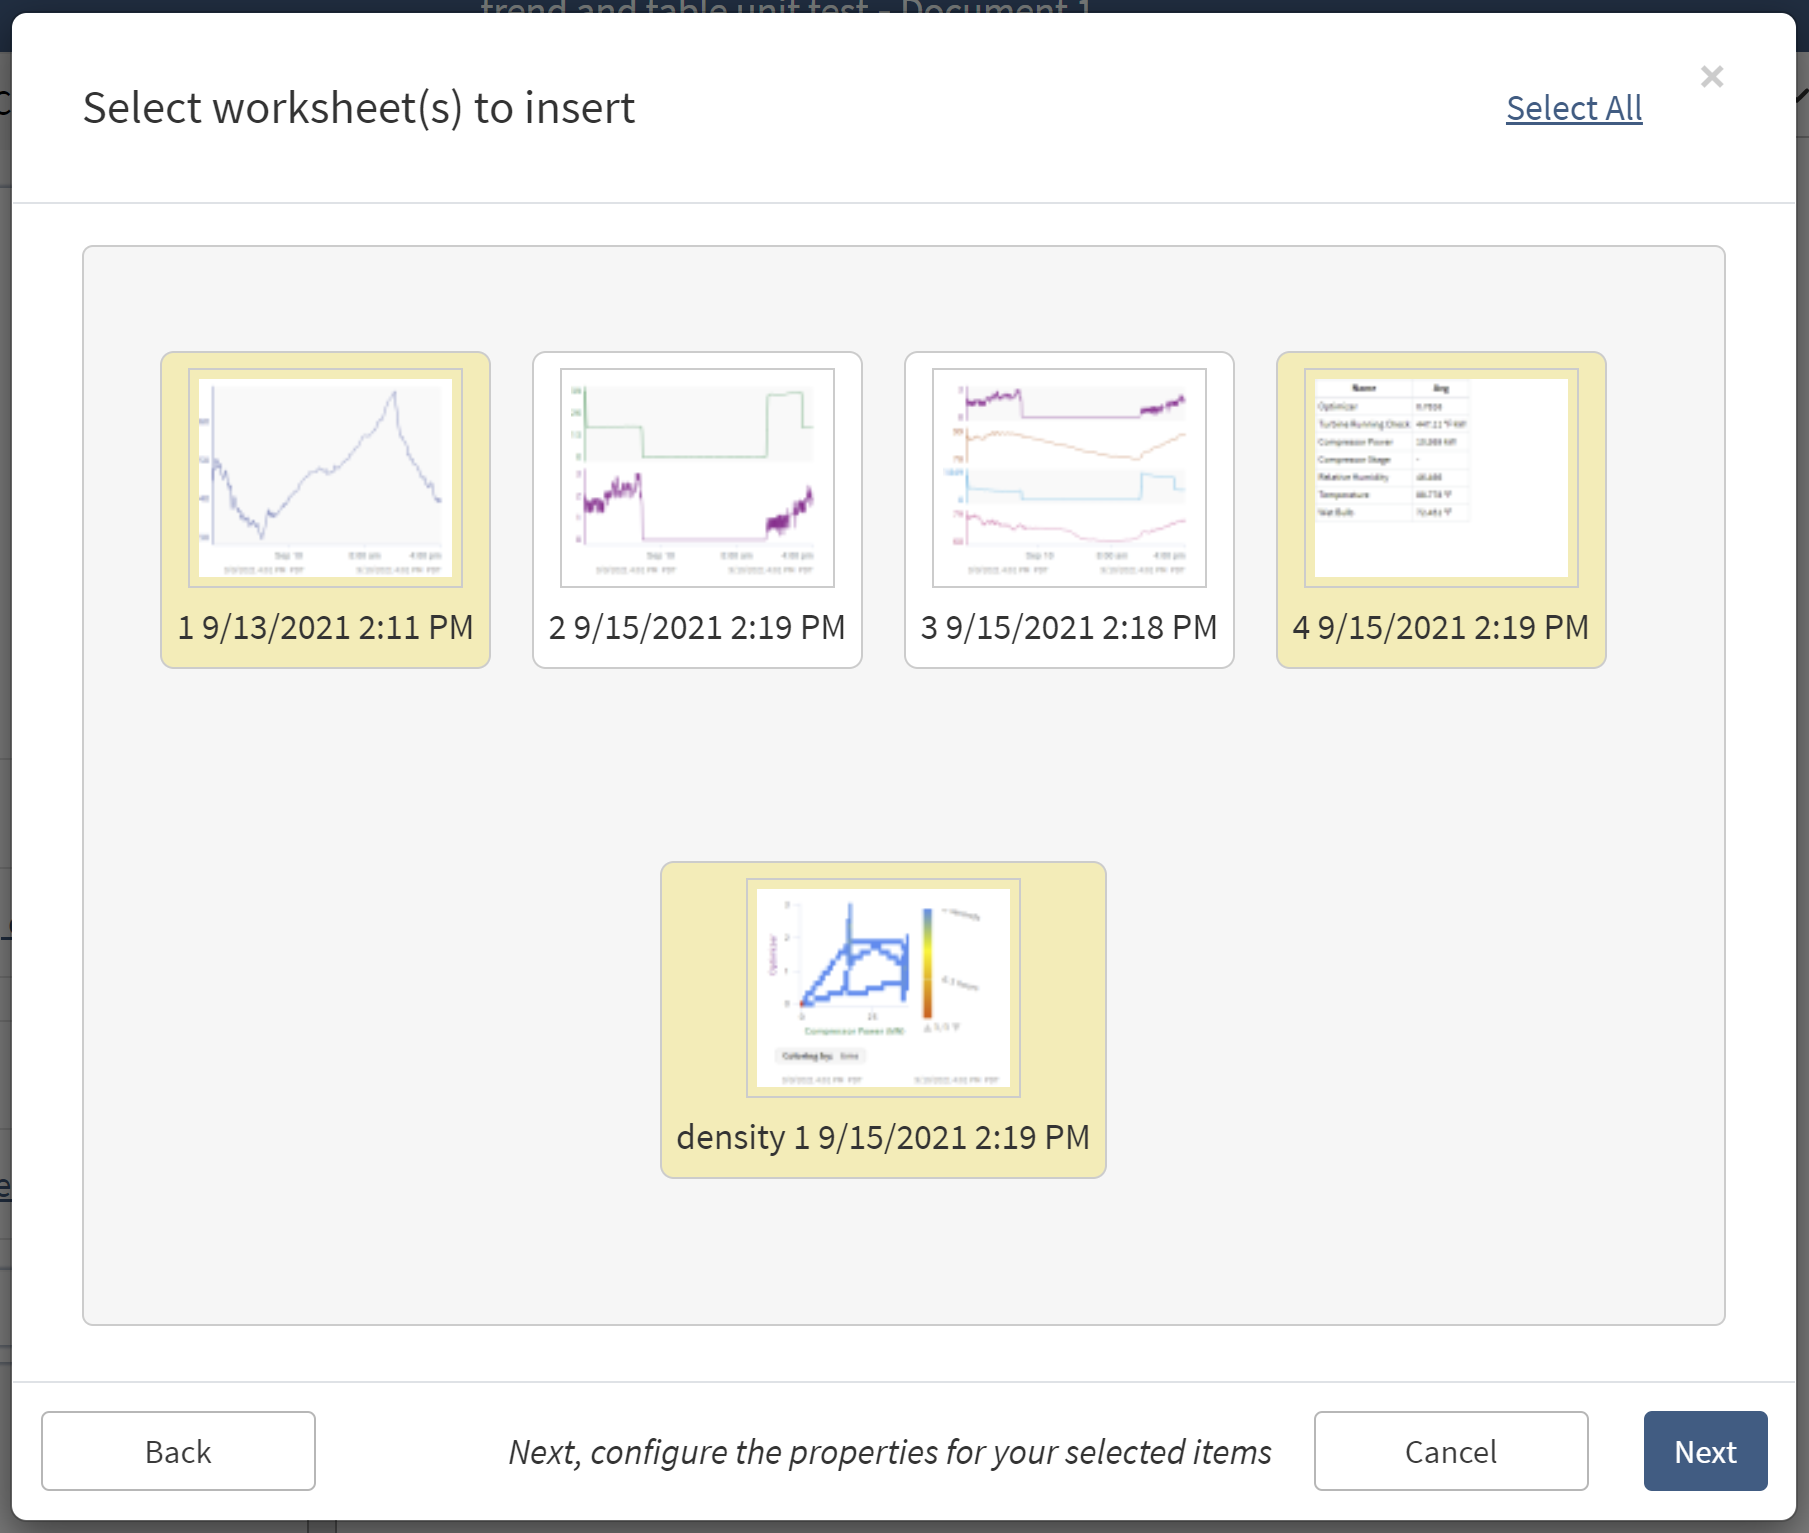
Select a Worksheet or View...
Find and select the worksheet within the Analysis or the view within the Vantage room that will be inserted into the Organizer Topic. Double click or single click and then click "Select." Multiple worksheets or views can be selected or unselected with single clicks, or the select/unselect all button in the top right. Then click “Next”.
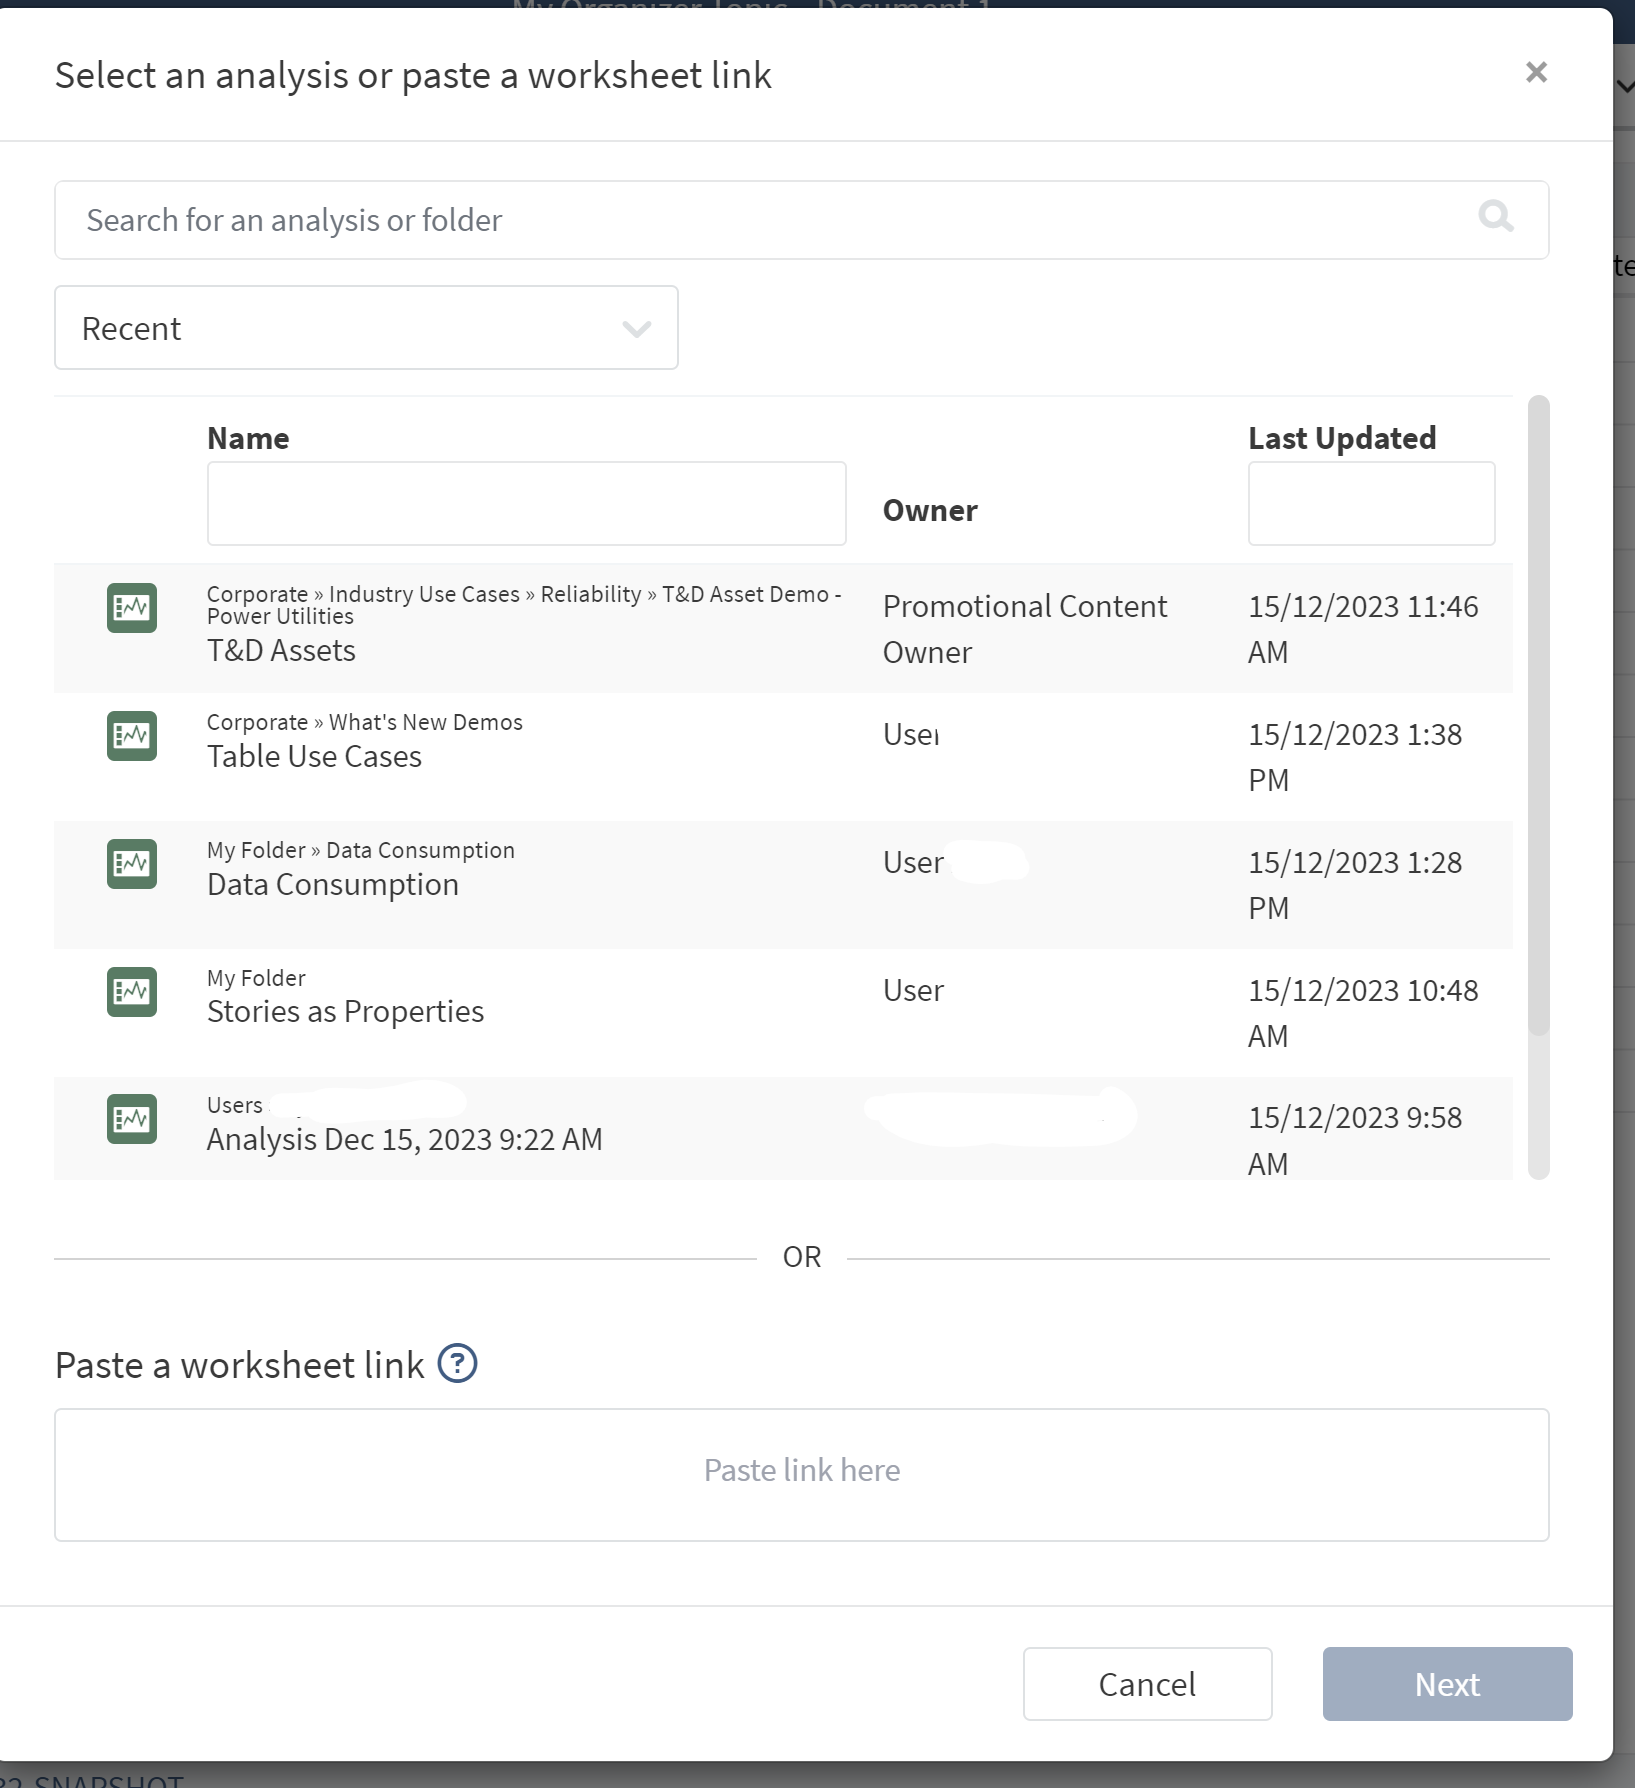
Inserting Content from a Link
Copy the URL from the Seeq worksheet or Vantage view to be inserted into the Organizer Topic and paste into the lower portion of the pop-up. The box where the URL is pasted will turn green if it is a valid Seeq link. Invalid links will not be inserted.
To insert a URL that does not originate from Seeq (in order to link to another website or location in a shared drive), use the link button in the toolbar.

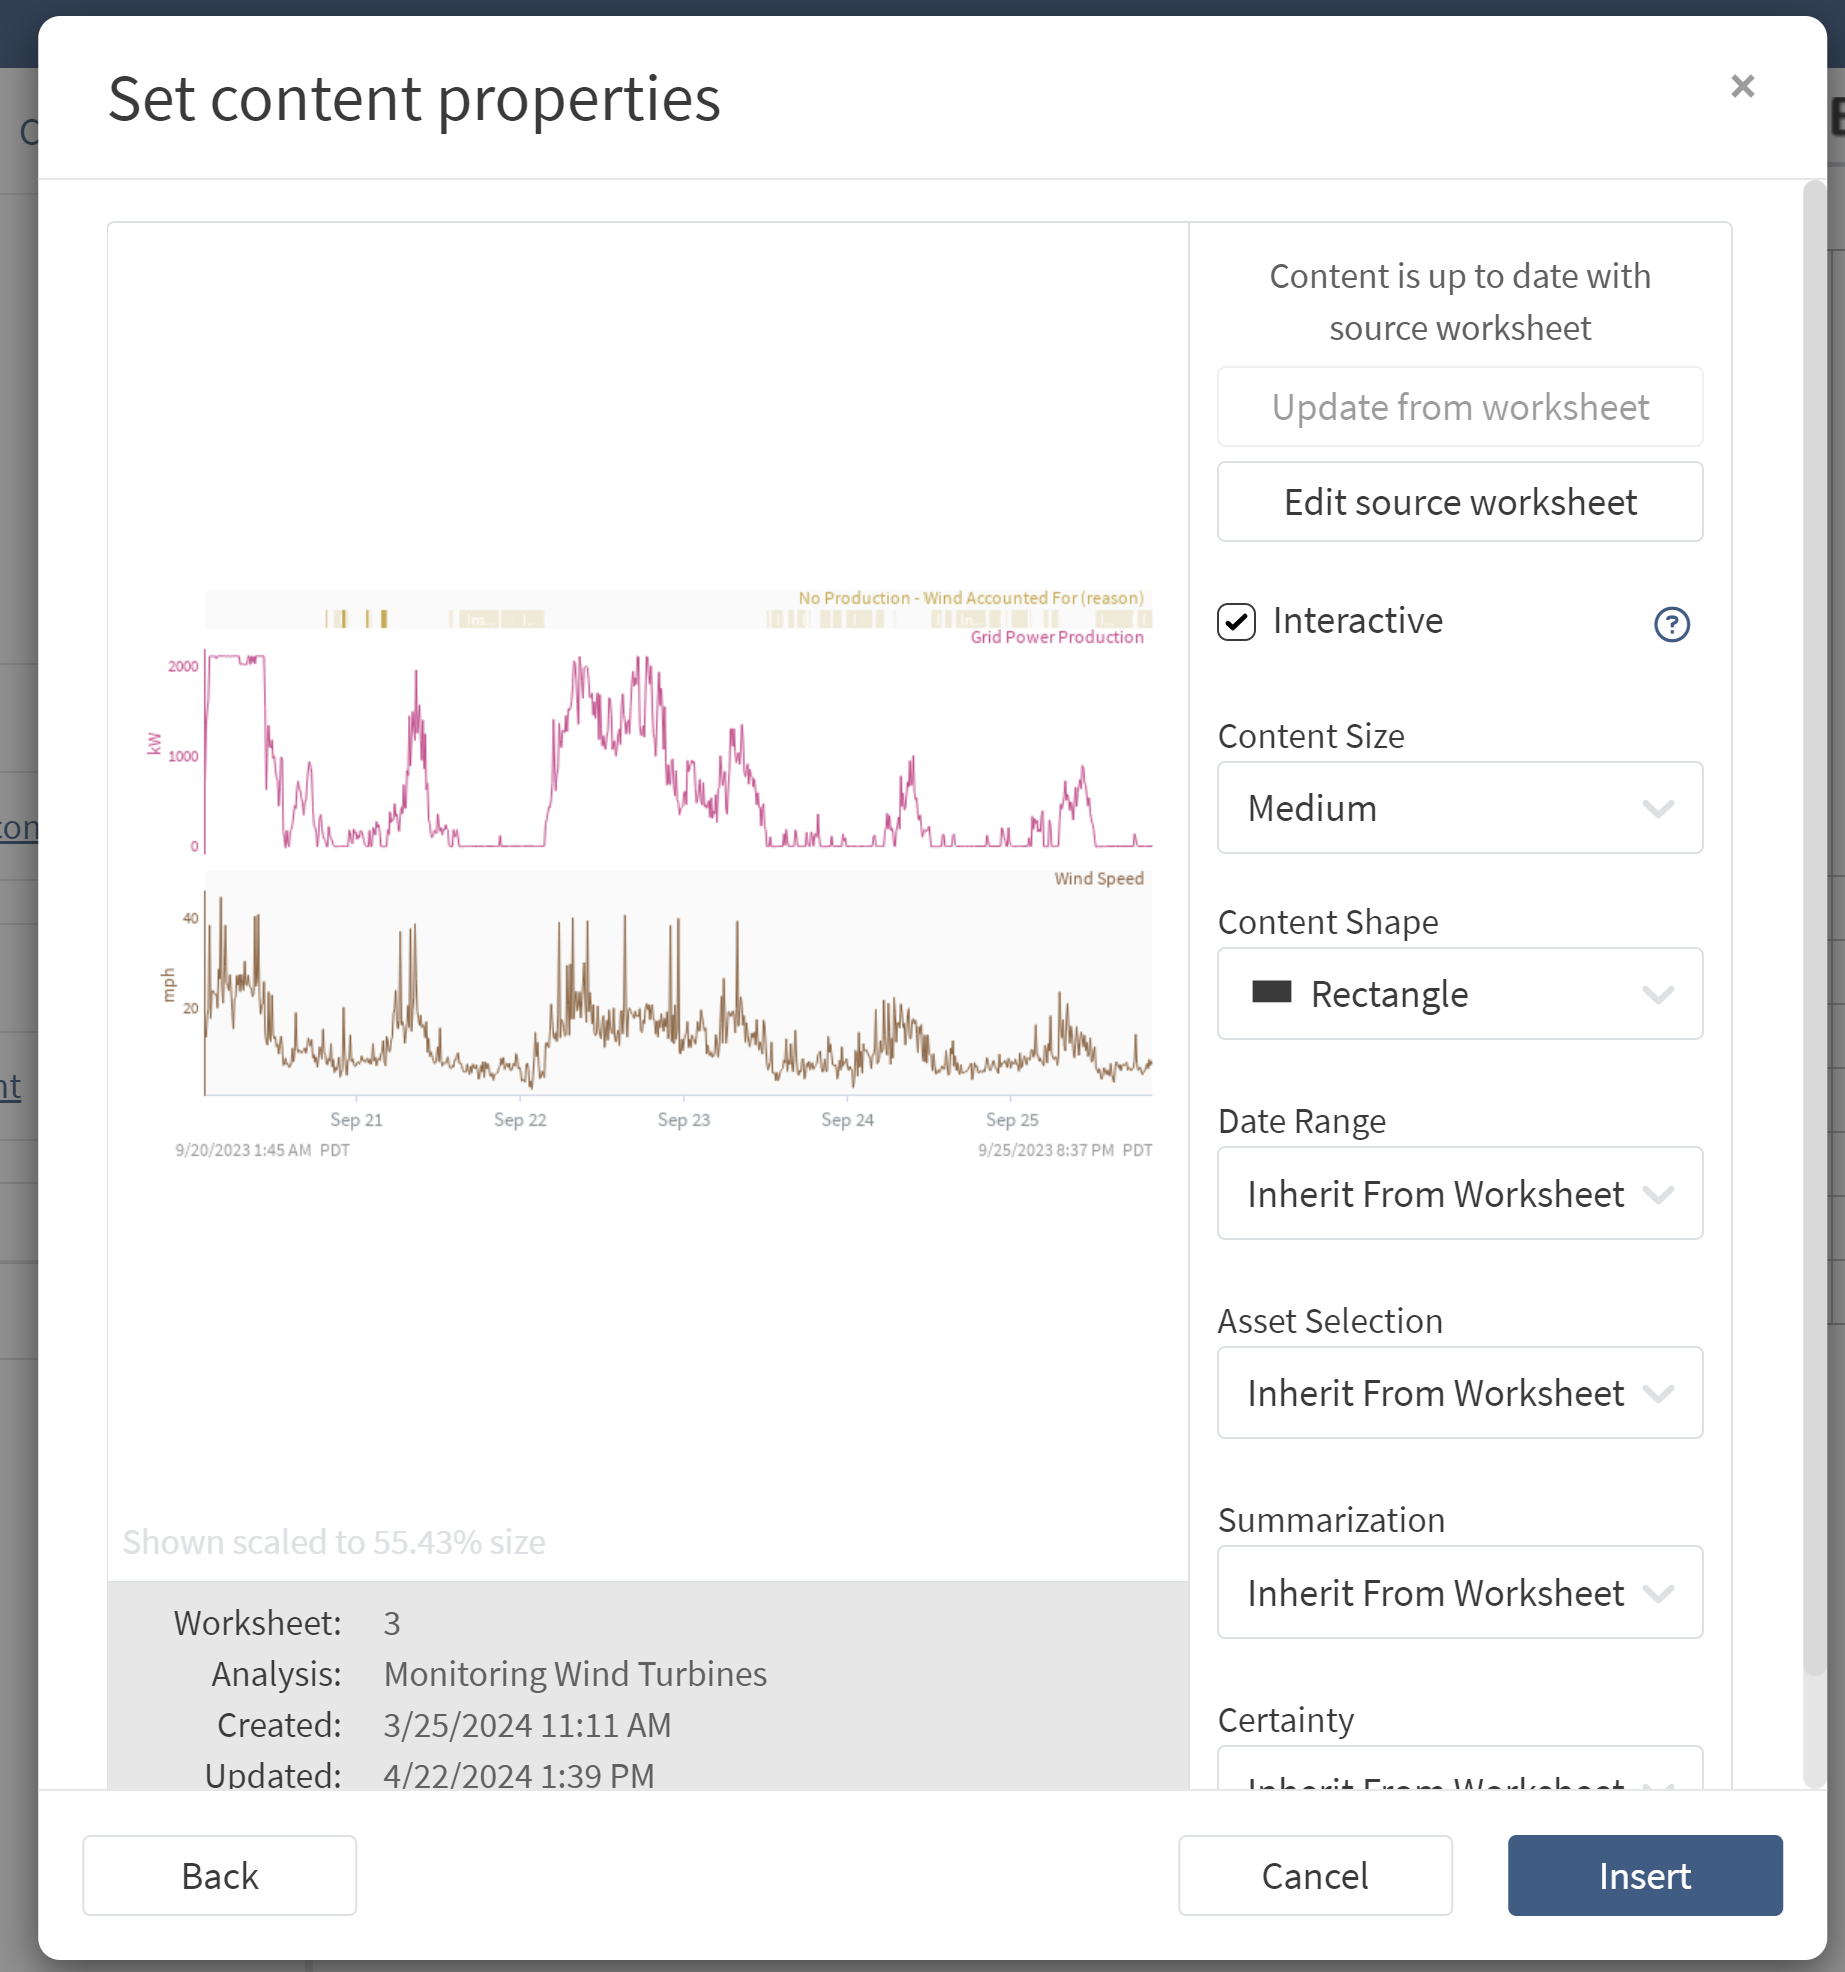
Set Content Properties
Interactive: Most content can be interactive in Organizer. All interactive content will appear more clear, especially if it is filling a large screen because non-interactive content are screenshots and so have limited resolution. Interactive content will display dates that follow the viewer’s browser settings, so a user in the US will see MM/DD/YYYY while someone in Europe would be more likely to see DD/MM/YYYY on the same Organizer. All content that is interactive can also be switched to non-interactive if needed. Only Histogram and Compare View are not yet interactive.
-
Interactive Tables can be sorted and filtered right from the topic, can be toggled to a chart view of the data, and the text will display more crisply.
-
Interactive Treemap can be used to change the asset selection by clicking on one of the colored Treemap nodes. Note that the Treemap must first be associated with an Asset Selection that matches the part of the tree displayed by the Treemap. Asset selection using Treemap is currently limited to a single level, so you cannot yet navigate up or down the asset hierarchy. In order for the selection in the Treemap to apply, that asset must have only signals or conditions as children, not other assets.
-
Interactive XY Plots will show labels when hovering over them if labels have been enabled for the plot in Workbench.
-
Interactive Trends will show the cursor value when hovering over the signals and capsules on the trend.
Content Size: Select from the dropdown menu Small, Medium, Large, Fill to Fit, or Custom to determine the size of the image. Non-interactive images can be manually resized after inserted by dragging corners, but an image inserted as Small will be granular if stretched too large. Default is Rectangle. Selecting Custom will remove the subsequent shape option and let the user define the content by pixel count. Default is Medium. When the content is in table view, there will be no option for Content Size because the number of rows and columns will determine the size.
The Fill to Fit Container size option is useful if you are building a dashboard in a topic using tables to control the layout. Content with this size option selected will grow to fill the available space of the table cell. It works best with Interactive Content since non-interactive images will look distorted when stretched. Note that the content must be the only element inside the table cell. If using this size to build a dashboard that grows to fill the size of the screen you will need to configure your layout table to have a height of 100% by clicking the table properties icon. It is best if the rows of the table are configured to have a height which can be configured by using the cell properties button. For example, a cell in row 1 could be configured to have a height of 20% and a cell in the second row could be configured to have a height of 80%. If a Fill to Fit piece of content were inserted into the second row it would grow to take 80% of the height of the browser. Note that if you shrink your browser window you will need to refresh in order for new sizes to be calculated.
Content Shape: Select from the dropdown menu Strip, Rectangle or Square to change the shape of the image. Default is Rectangle. When the content is in table view, there will be no option for Content Shape because the table contents will determine the shape of the table.
Font Size: Select from the dropdown menu Small, Normal, Large, X-Large, or Huge to determine the size of the details inside of the image. This can be used if the image is too grany or the details are too small. For example the topic is displayed on a dashboard you might increase the font size so that the text is readable at a distance.
Date Range: Select a date range to apply to the image. Default is Inherit From Worksheet, but more than one date range can be configured to enable a document to have the same trend with varying dates, or a combination of trends and tables with different date references.
Asset Selection: Select an asset selection to apply to the content. Default is Inherit From Worksheet, but an Asset Selector can be configured to enable content to be updated to display data from a different asset than what is displayed in the original worksheet. As noted above an Interactive Treemap can also be associated with the Asset Selection and then the Treemap can be used to change which asset is selected. Asset selection does not apply to Vantage content.
Summarization: Visual summarization can be applied to show fewer samples than displayed on the original analysis. Read more about signal summarization here.
Certainty: If a calculated result may change, Seeq defaults to display that as a dashed line or a hollow capsule. If you don’t want viewers to see this indicator that the result may change, you can opt to Hide uncertainty Indicators when inserting content. Read more about data certainty and uncertainty here.
All the above properties can also be updated for more than one piece of content at a time as described in Modifying Seeq Content.
Date Range and Asset Labels
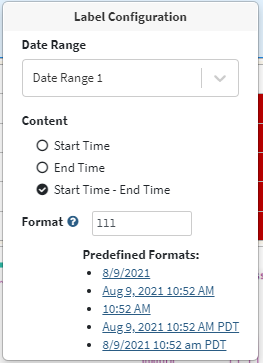
After inserting a Date Range Label, clicking on it will open the Label Configuration menu. Select any configured Date Range from the dropdown and then specify formatting of the display using the selector below.
When a Date Range Label is associated with a condition based date range, capsule properties will also be available to select under the Content section.
Change the color, font or size of the text displayed by modifying as you would any other text in the Document with the toolbar options at the top.
Other Content in Organizer
Data Lab, Vantage, or IOTASoft can also be inserted as content based via a URL.
Data Lab content can be included in Organizer Documents from Data Lab in two ways.
-
Insert special content with a relative URL to a Data Lab project that has Data Lab Functions that can return interactive visualizations. This is currently a Preview Feature that can follow date range and asset selection updates. The process of inserting and configuring this type of content is likely to change (for the better!) in the future. Content inserted this way has the benefit of being interactive for browser users, but the PDF will not capture the image.
-
Use spy.push (see Data Lab Visualizations.ipynb notebook in the SPy Documentation folder of any Data Lab Project) to push an image on a schedule. Use this approach if the SPy content is expected to appear in PDFs captured interactively or on a schedule.
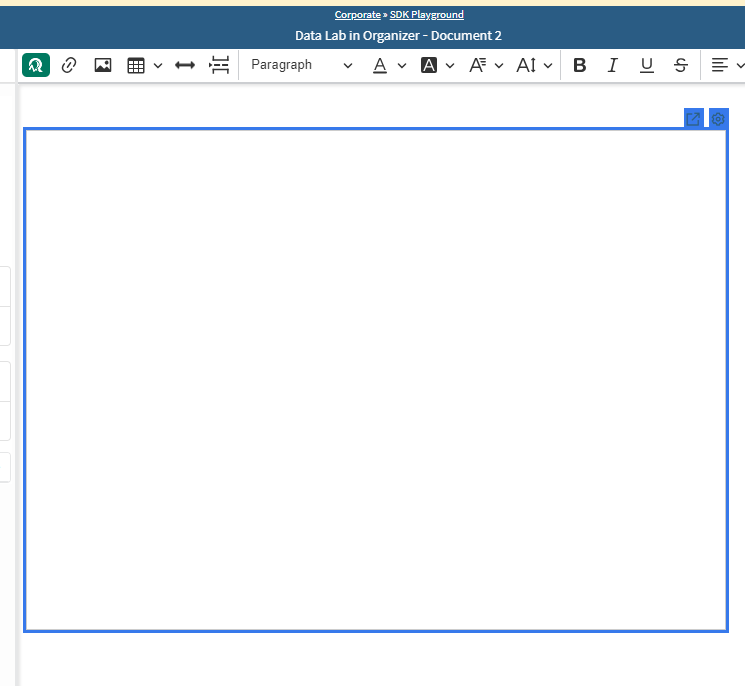
For live links to Data Lab functions, a full Vantage Room View that includes context, or IOTASoft content, add content using the icon in the toolbar that has the Seeq and IOTA Content tooltip. When this content has inserted into the Document, click the gear icon on the content to configure it.
You’ll need a Data Lab project that has some Data Lab API Functions. This notebook has a few examples to get started. You can upload it to an existing Data Lab project and use the GUID in the URL of that project as part of the reference URL example.ipynb
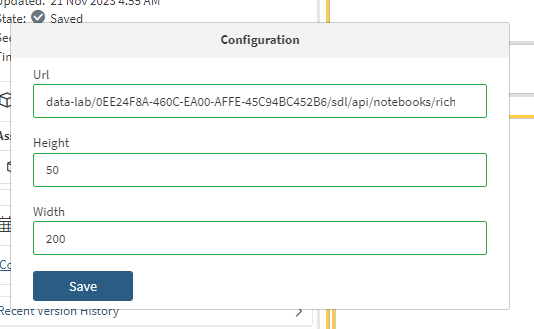
Use part of the Vantage room URL that starts with workbook for the URL configuration of Vantage rooms inserted into Organizer, appending a ?embedded=true at the end of the URL to remove buttons in the header. For Data Lab, when you have a Data Lab project to reference, insert the relative URL (without anything preceding data-lab) into the URL box.
If you want to pass Date Range or Asset Selection as parameters to a Data Lab function (as shown in the TBL2 end point in the example notebook), they are appended on the end of the relative URL to pass as arguments to the Data Lab Function.
See the example below, where the GUIDs would be replaced as appropriate.
-
The first GUID maps to the Data Lab Project.
-
The second GUID maps to the GUID of the Asset Selector in Organizer, which can be copied from the Properties Pane.
-
The third and fourth GUIDs are the same and map to a GUID of a Date Range in Organizer, which can also be copied from the Properties Pane.
data-lab/0EE24F8A-460C-EA00-AFFE-45C94BC452B6/functions/notebooks/example/endpoints/TBL2?{assetSelection:0EE25CCF-8029-F920-A50A-252185139431:asset}&{dateRangeStart:0EE25CCF-AB47-62B0-B8B1-70681DCFC060:start}&{dateRangeEnd:0EE25CCF-AB47-62B0-B8B1-70681DCFC060:end}
Static parameters can be passed to the Data Lab Function as normal. For example:
-
data-lab/0EE24F8A-460C-EA00-AFFE-45C94BC452B6/functions/notebooks/example/endpoints/my_visualization?site=Boston&{assetSelection:0EE25CCF-8029-F920-A50A-252185139431:asset}will send argumentsitewith valueBostonin addition to the Asset Selection
Configure the Height and Width of the window that the Data Lab content will display within. The height and width can either be specified as pixels with a number or they can be specified as a percentage. Specifying the height and width as a percentage allows the content to grow with the size to fill the available space as the browser screen size changes. For example, if height and width are set to 100% and the content is placed inside a table cell and that table is configured with a height of 100% the content will fill the whole browser window and will shrink or expand as it changes.