View Statistics Summaries
View Statistics Summaries provides a centralized view of all statistics summaries created within the current workbook. Users can browse and work with previously created statistics summaries, and view contextual information such as the source signal, selected time window, and condition in the window of interest.
Opening the View Statistics Summaries Tool
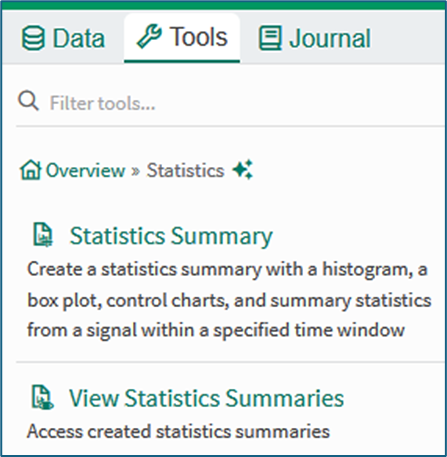
Figure 1
The View Statistics Summaries tool can be opened from the Statistics menu of the tools panel , or accessed using the search term View Statistics in the Tools search field. Clicking the tool opens a list of summaries in the tools pane.
Using the View Statistics Summaries Tool
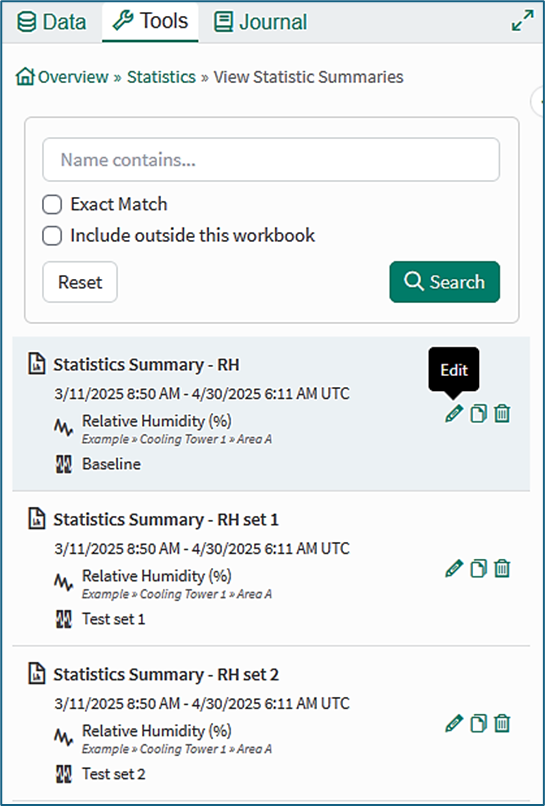
Figure 2
List of summaries: The list of summaries shows the summaries associated with the workbook.
Card content: Each summary in the list is displayed in a card showing the window of interest, the signal name, and any limiting condition.
Action item icons: The action items allow a user to edit, duplicate or delete a Statistics Summary. Hovering the mouse on an action icon gives a tool tip.
Search box: The search tool can be used when seeking or filtering statistics summaries that are local to the current workbook and, optionally, in other workbooks.
Summary Report
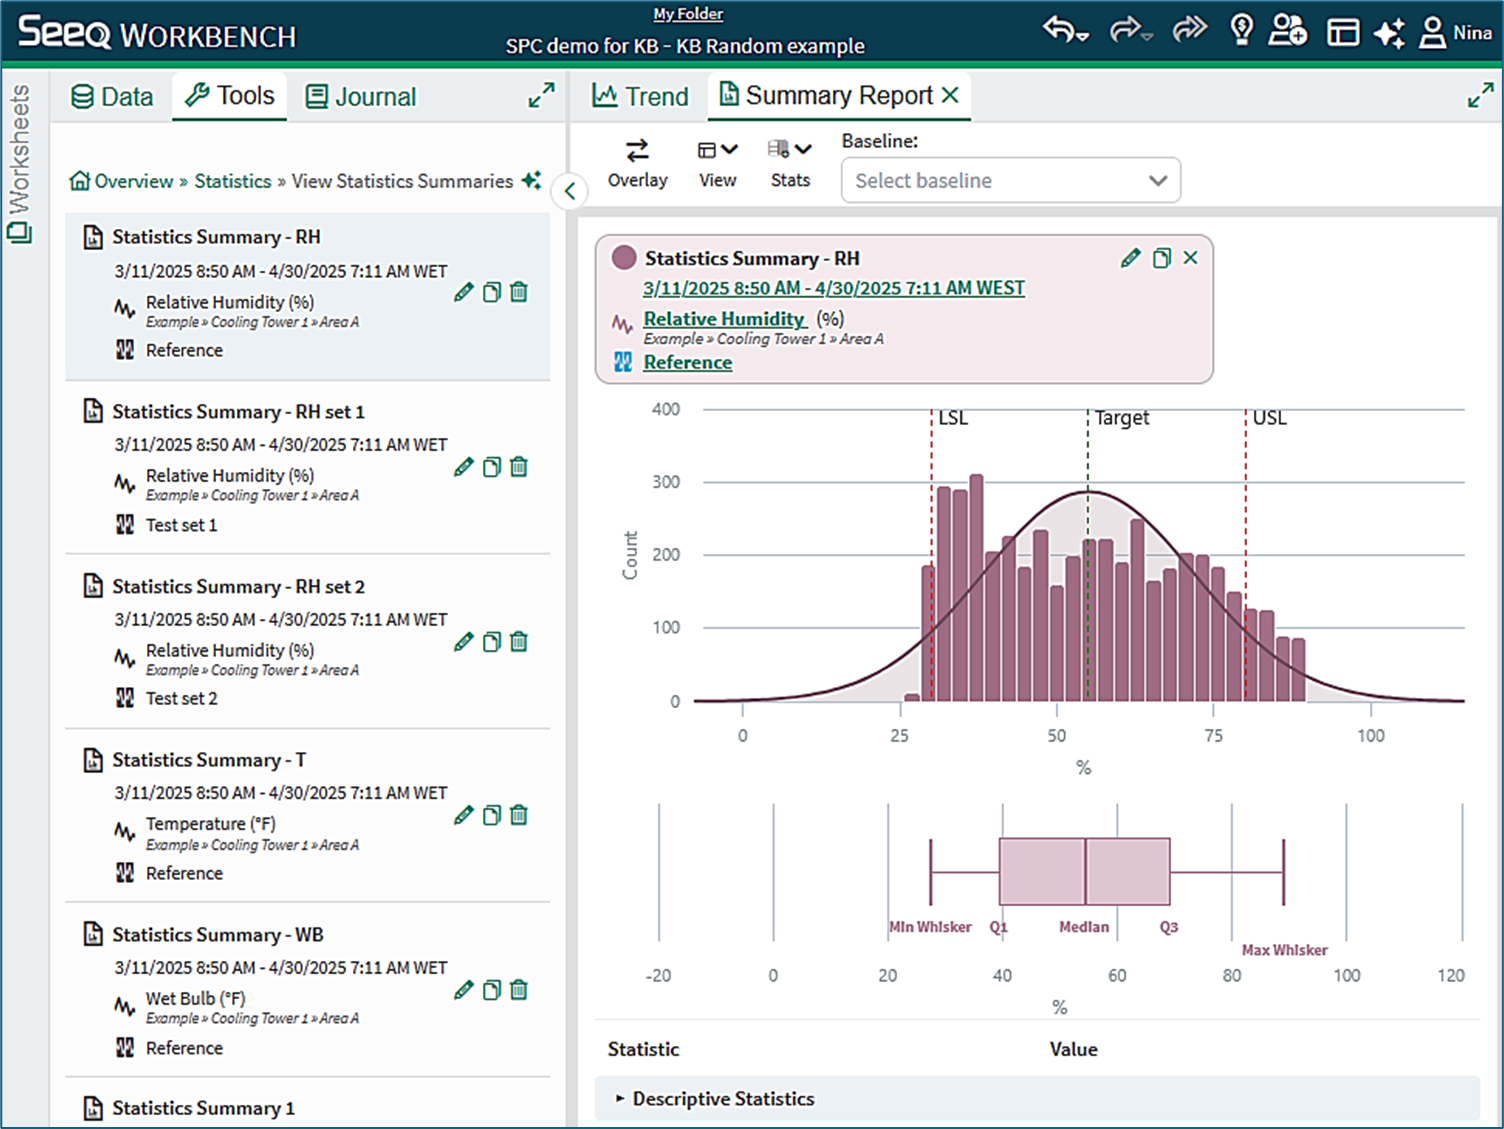
Figure 3
Clicking a saved Statistics Summary opens the Summary Report tab in the Display Pane of the worksheet.
Further information
Information is available in the Summary Report KB on the topics of:
Tabbed viewing
Summary Report controls and configuration
Working with multiple statistics summaries
Quantitative comparisons
Information is available in the Statistics Summary KB on the topics of:
Opening and using the Statistics Summary tool
Content of a basic Statistics Summary
Content of a Statistics Summary with SPC chart
SPC Chart types
SPC Chart limits
SPC run rules
The Limit and Sample Alignment conditions
Information is available in the Statistics Definitions and Reference KB on the topics of:
Content of the Statistics table
Box plot calculations
Performance calculations
Probability calculations
Autocorrelation and discrete signals