Best Practices for Workbench Performance
This article is intended for Seeq end users and should be referenced to optimize performance. If poor performance is experienced and the following best practices are followed, ask your Seeq administrators to look at Performance Recommendations for Administrators or submit a support ticket.
Items in Details Pane
Recommendation: Minimize the number of items listed in the Details Pane.
If an item is not immediately needed in the Details Pane, but you’d like to have easy access to it, add a link to the Trend Item in the Journal. Journal links enable the user to easily add items onto the Details Pane with a single click.
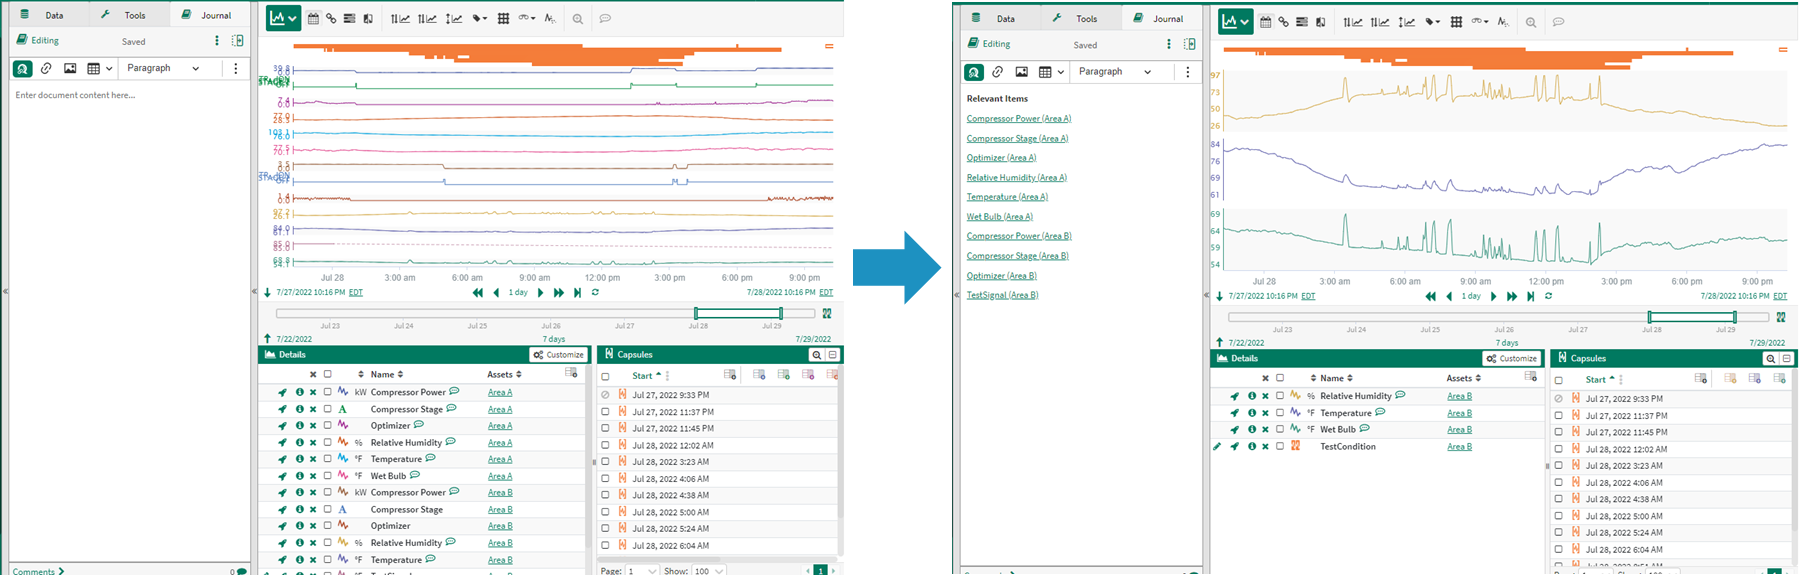
Note: While dimming can help performance by limiting the number of items that are trended, it is still recommended to minimize the number of items in the Details Pane for optimum performance.
Reason: For each item listed in the Details Pane, Seeq has to pull the data (either from the data source or the cache) and trend the item; all of this requires processing time. The fewer items listed in the details time, the less data that needs to be pulled and trended
Display Range
Recommendation: Minimize the length of time displayed in the Display Range.
When performing an analysis in Seeq, it is recommended to start with the smallest, reasonable length of time in the Display Range. Once the analysis is performed on the smaller time period, zoom out to apply the analytics to a larger time period of data and view the results.
Reason: The display range refers to the time over which signals and conditions are trended. The larger this time period, the more data Seeq must pull and trend.
Investigate Range
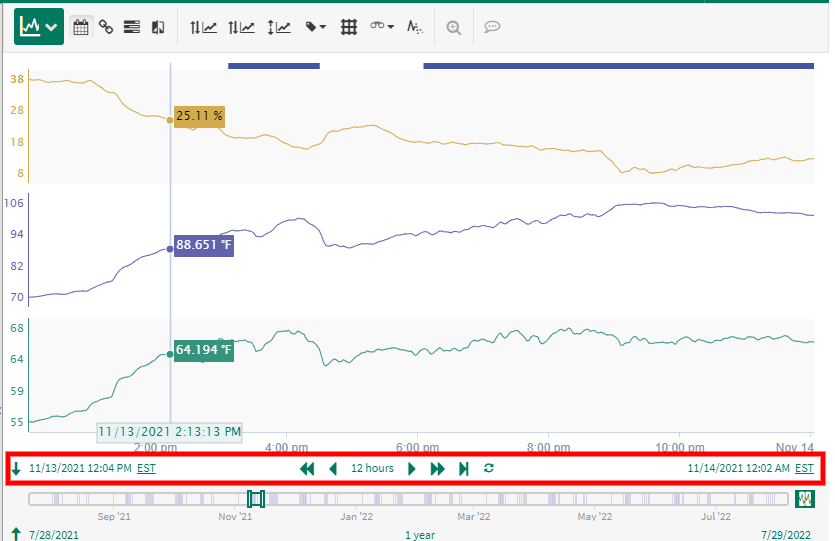
Recommendation: Minimize the length of time displayed in the Investigate Range. Turn off the Investigate Range using the green button on the far right if you aren’t using the capsule preview in the Investigate Range. This will avoid querying for data to display that you are not using.
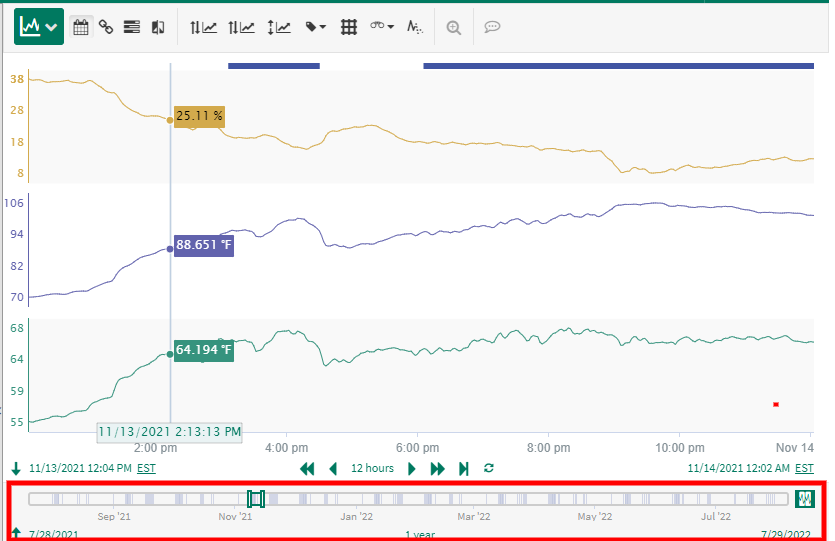
Reason: The investigation range refers to the time over which conditions are displayed in the mini-map below the trend. The larger this time period, the more data Seeq processes to identify these conditions
Maximum Interpolation
Recommendation: Minimize the maximum interpolation of a signal.
The maximum interpolation of a signal should be consistent with the data frequency. A large maximum interpolation can be used to connect infrequent data points, but should not be applied to dense data where it is not needed.
Reason: The maximum interpolation of a signal tells Seeq how far forwards or backwards in time it should look for the next data point to draw the interpolation line. A higher maximum interpolation results in Seeq pulling more data to draw the interpolation line.
Maximum Capsule Duration
Recommendation: Utilize capsules without a maximum capsule duration (like Simple Value Search) or minimize the maximum capsule duration for a condition when one is required.
The maximum capsule duration of a condition should be consistent with the longest expected event. A large maximum capsule duration can be used to identify long events, but should not be applied where it is not needed.
Similar to the maximum interpolation, the maximum capsule duration can be adjusted in the Item Properties or within Formula using the .setMaximumDuration() or .removeLongerThan() operators.
Reason: The maximum capsule duration tells Seeq how far forwards or backwards in time it should look for the start and end of a capsule. A higher maximum capsule duration results in Seeq pulling more data to identify the start and end of a capsule.
Display statistics
Recommendation: Only use display statistics in the Details Pane when necessary.
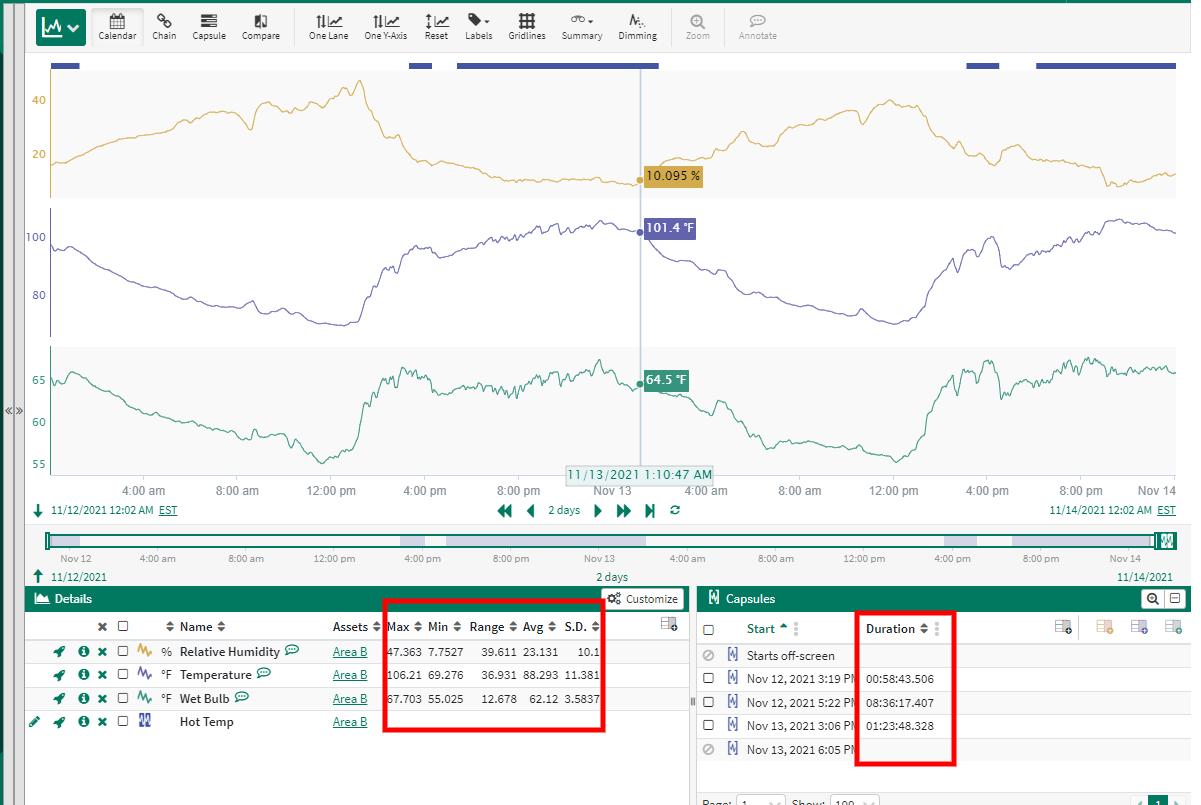
Reason: When display statistics are used, processing time is required to perform the calculations.
Trend Auto Update
Recommendation: Only enable the auto update feature when needed and keep the update frequency as long as is reasonable
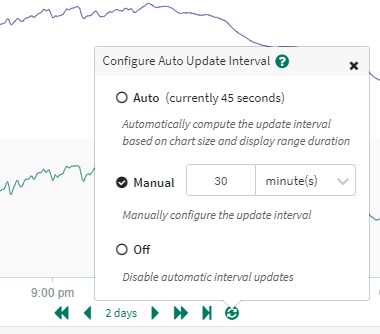
Reason: Each time the trend is updated, Seeq must query the data source for the latest data. Additionally, data near now is often not stored in the cache, increasing the time Seeq must spend pulling data from the source.
Down-sampling
Recommendation: Down-sample signals if full data resolution is not needed.
Signals can be down-sampled in Formula using the either the .resample() function or a filter function (.agileFilter(), .movingAverageFilter() or .lowPassFilter()).
For example, consider down-sampling a raw signal to daily averages for use in a multi-year monitoring package.
Reason: While this approach will not provide significant performance improvement on the initial data pull (Seeq will still need to retrieve the raw signal from the data source), using the down-sampled signal in downstream calculations can dramatically increasing processing speed.
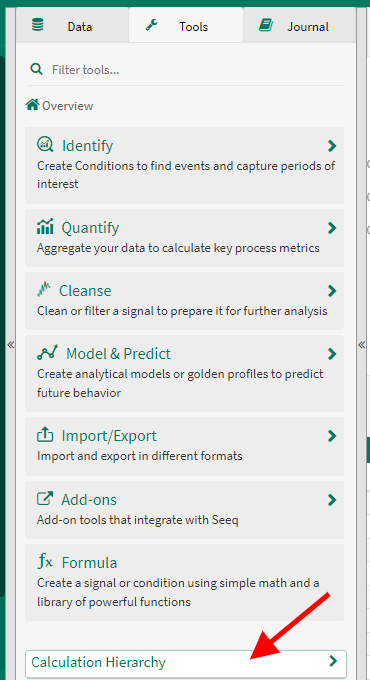
Calculations Hierarchy
Recommendation: For highly nested calculations, keep the Calculation Hierarchy minimized when not in use.
Reason: Processing time is required to display the Calculation Hierarchy. For highly nested calculations, the hierarchy may require substantial time to load, impacting performance.
Condition Tables
Recommendation: If you are going to refer to a condition based table often that grows over time (such as a daily average table that shows over the last 5 or 7 days), consider using a condition based metric instead of configuring the columns with the signal/statistic selector.
Another option would be to use formula to add other calculated properties to a condition and display those properties in Condition Table instead of selecting the same signal/statistic pair.
Reason: Metrics and condition properties currently have a mechanism to save the aggregated result and will load more quickly after initial calculation. The statistics do not yet have a mechanism to be saved and will need to re-calculate from the signal each time the table displays.
Max Worksheets per Workbook
Recommendation: While there is not a hard limit applied to the number of worksheets you can have in a single workbook, consider deleting unused worksheets and keeping the overall number of worksheets per workbook to 50 or fewer.
Reason: Duplication of very large workbooks is difficult due to the possible number of items and links to maintain. You may not be able to successfully duplicate a workbook if there are too many worksheets.