Using created Analytics
Scaling Tables allow you to configure many analytics (Signals, Conditions or Scalars) at once. Now that you’ve created these items, let’s explore how you can use Workbench to make use of them.
Navigating in the Data Pane
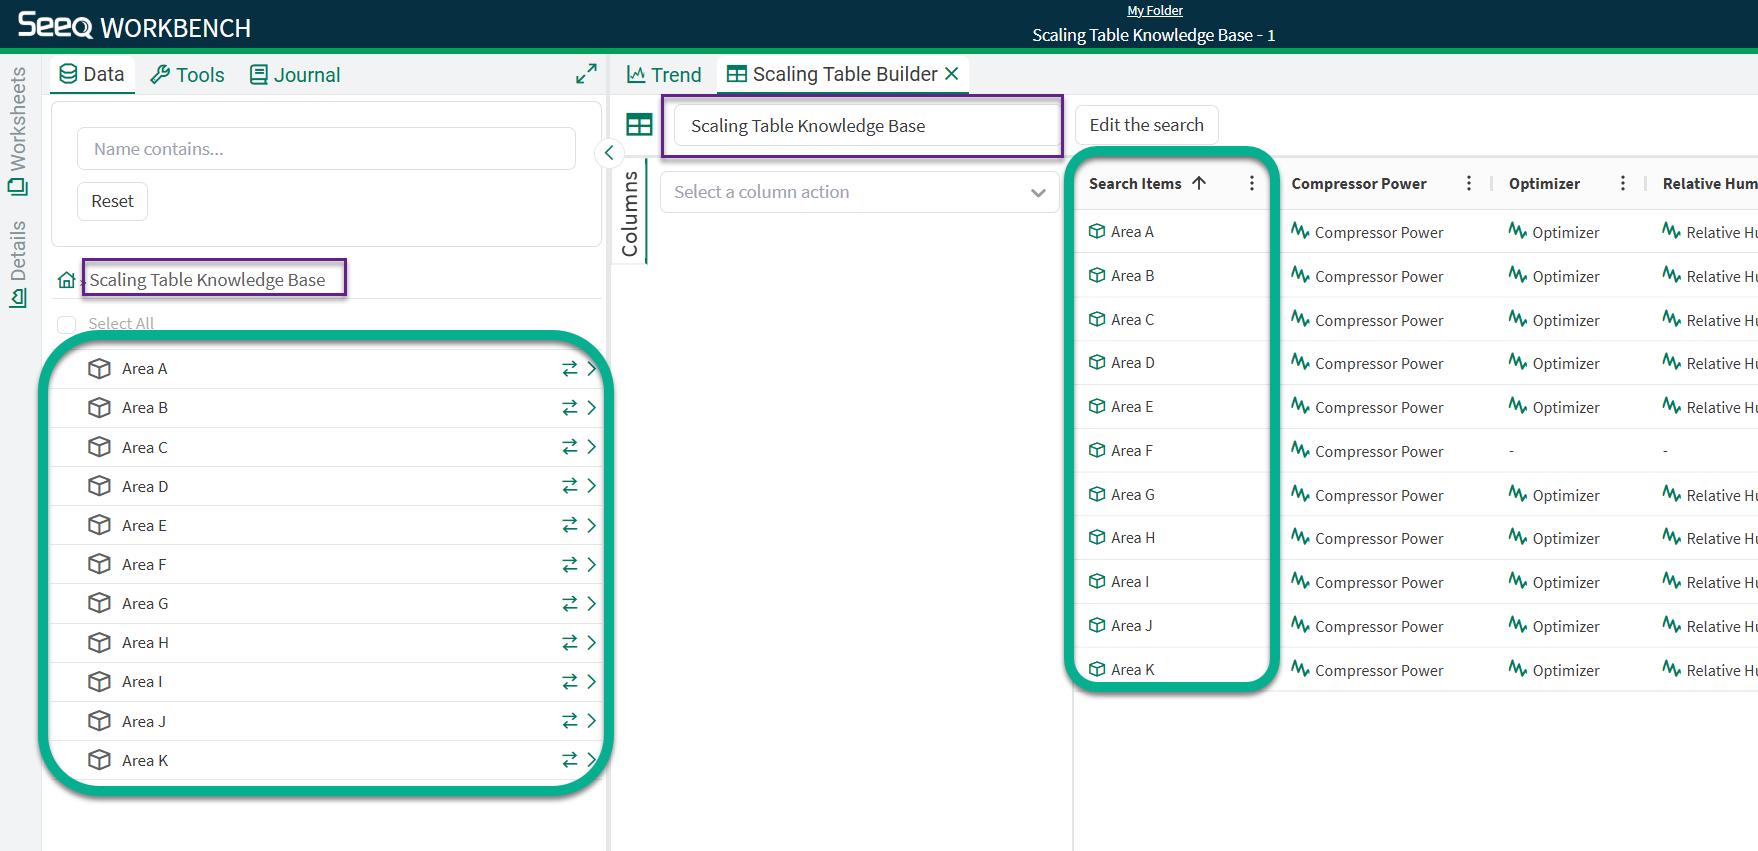
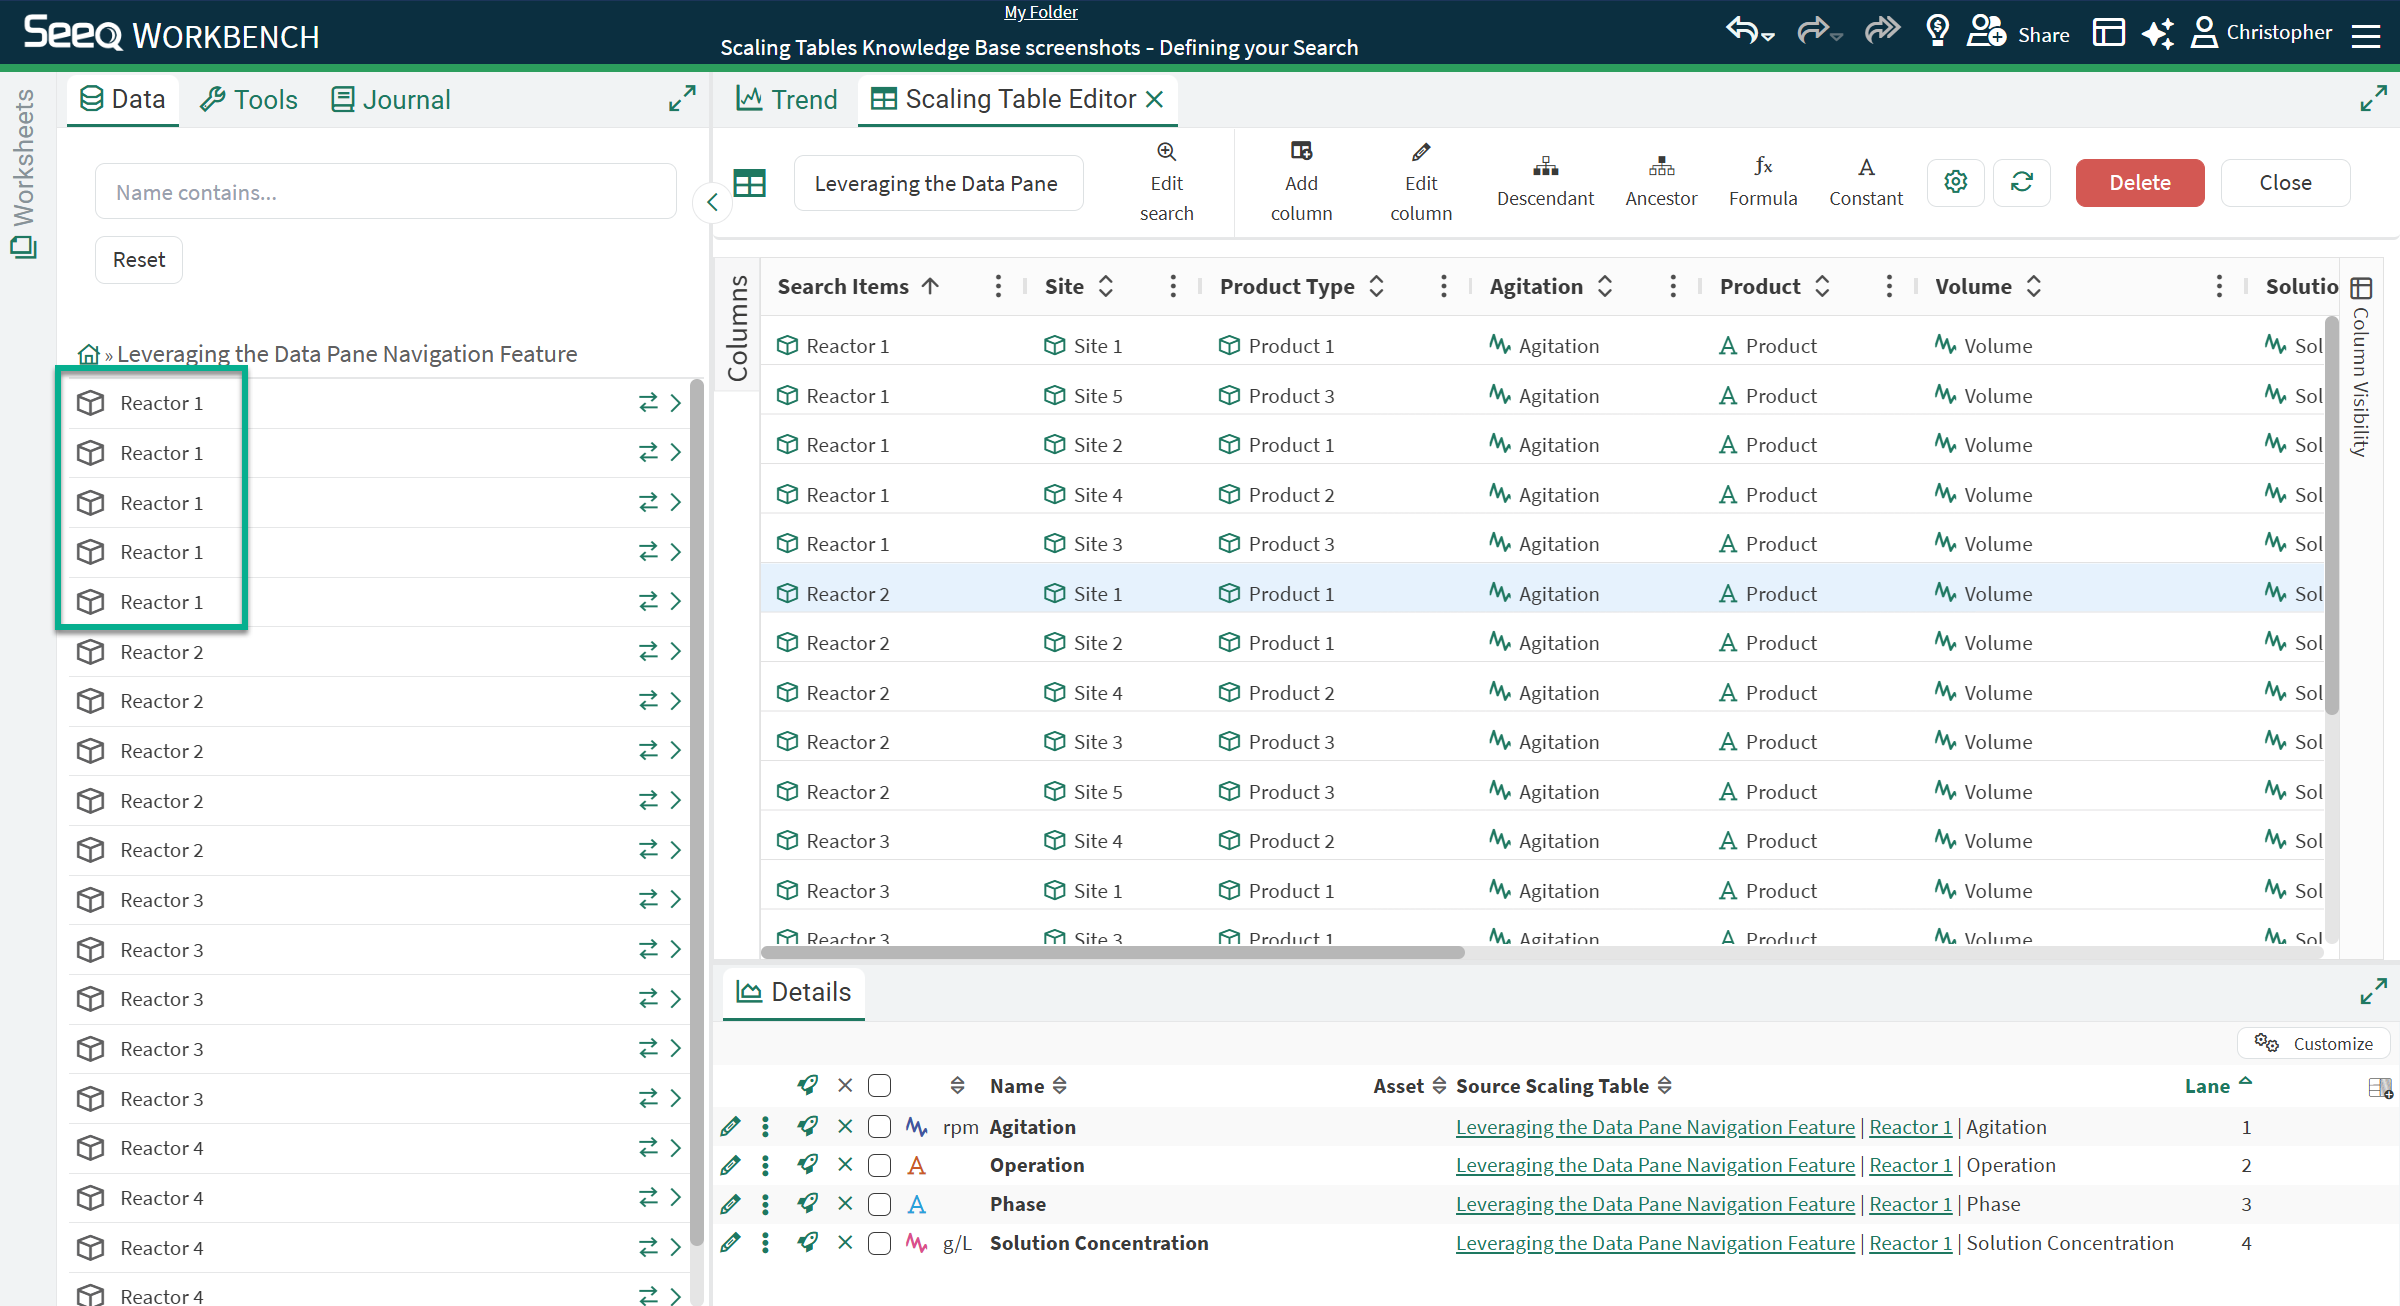
After creation, the Scaling Table results will be navigable and searchable in the Data Pane. Access the navigation view by simply clicking into the table. Note that you can simultaneously navigate the Data Pane while having the editor open.
The first layer shown represents your “Search Items” column from your Scaling Table:
Once you’ve drilled into a particular “row”, you can trend any displayable items (Signals, Conditions, and Scalars) from that row:
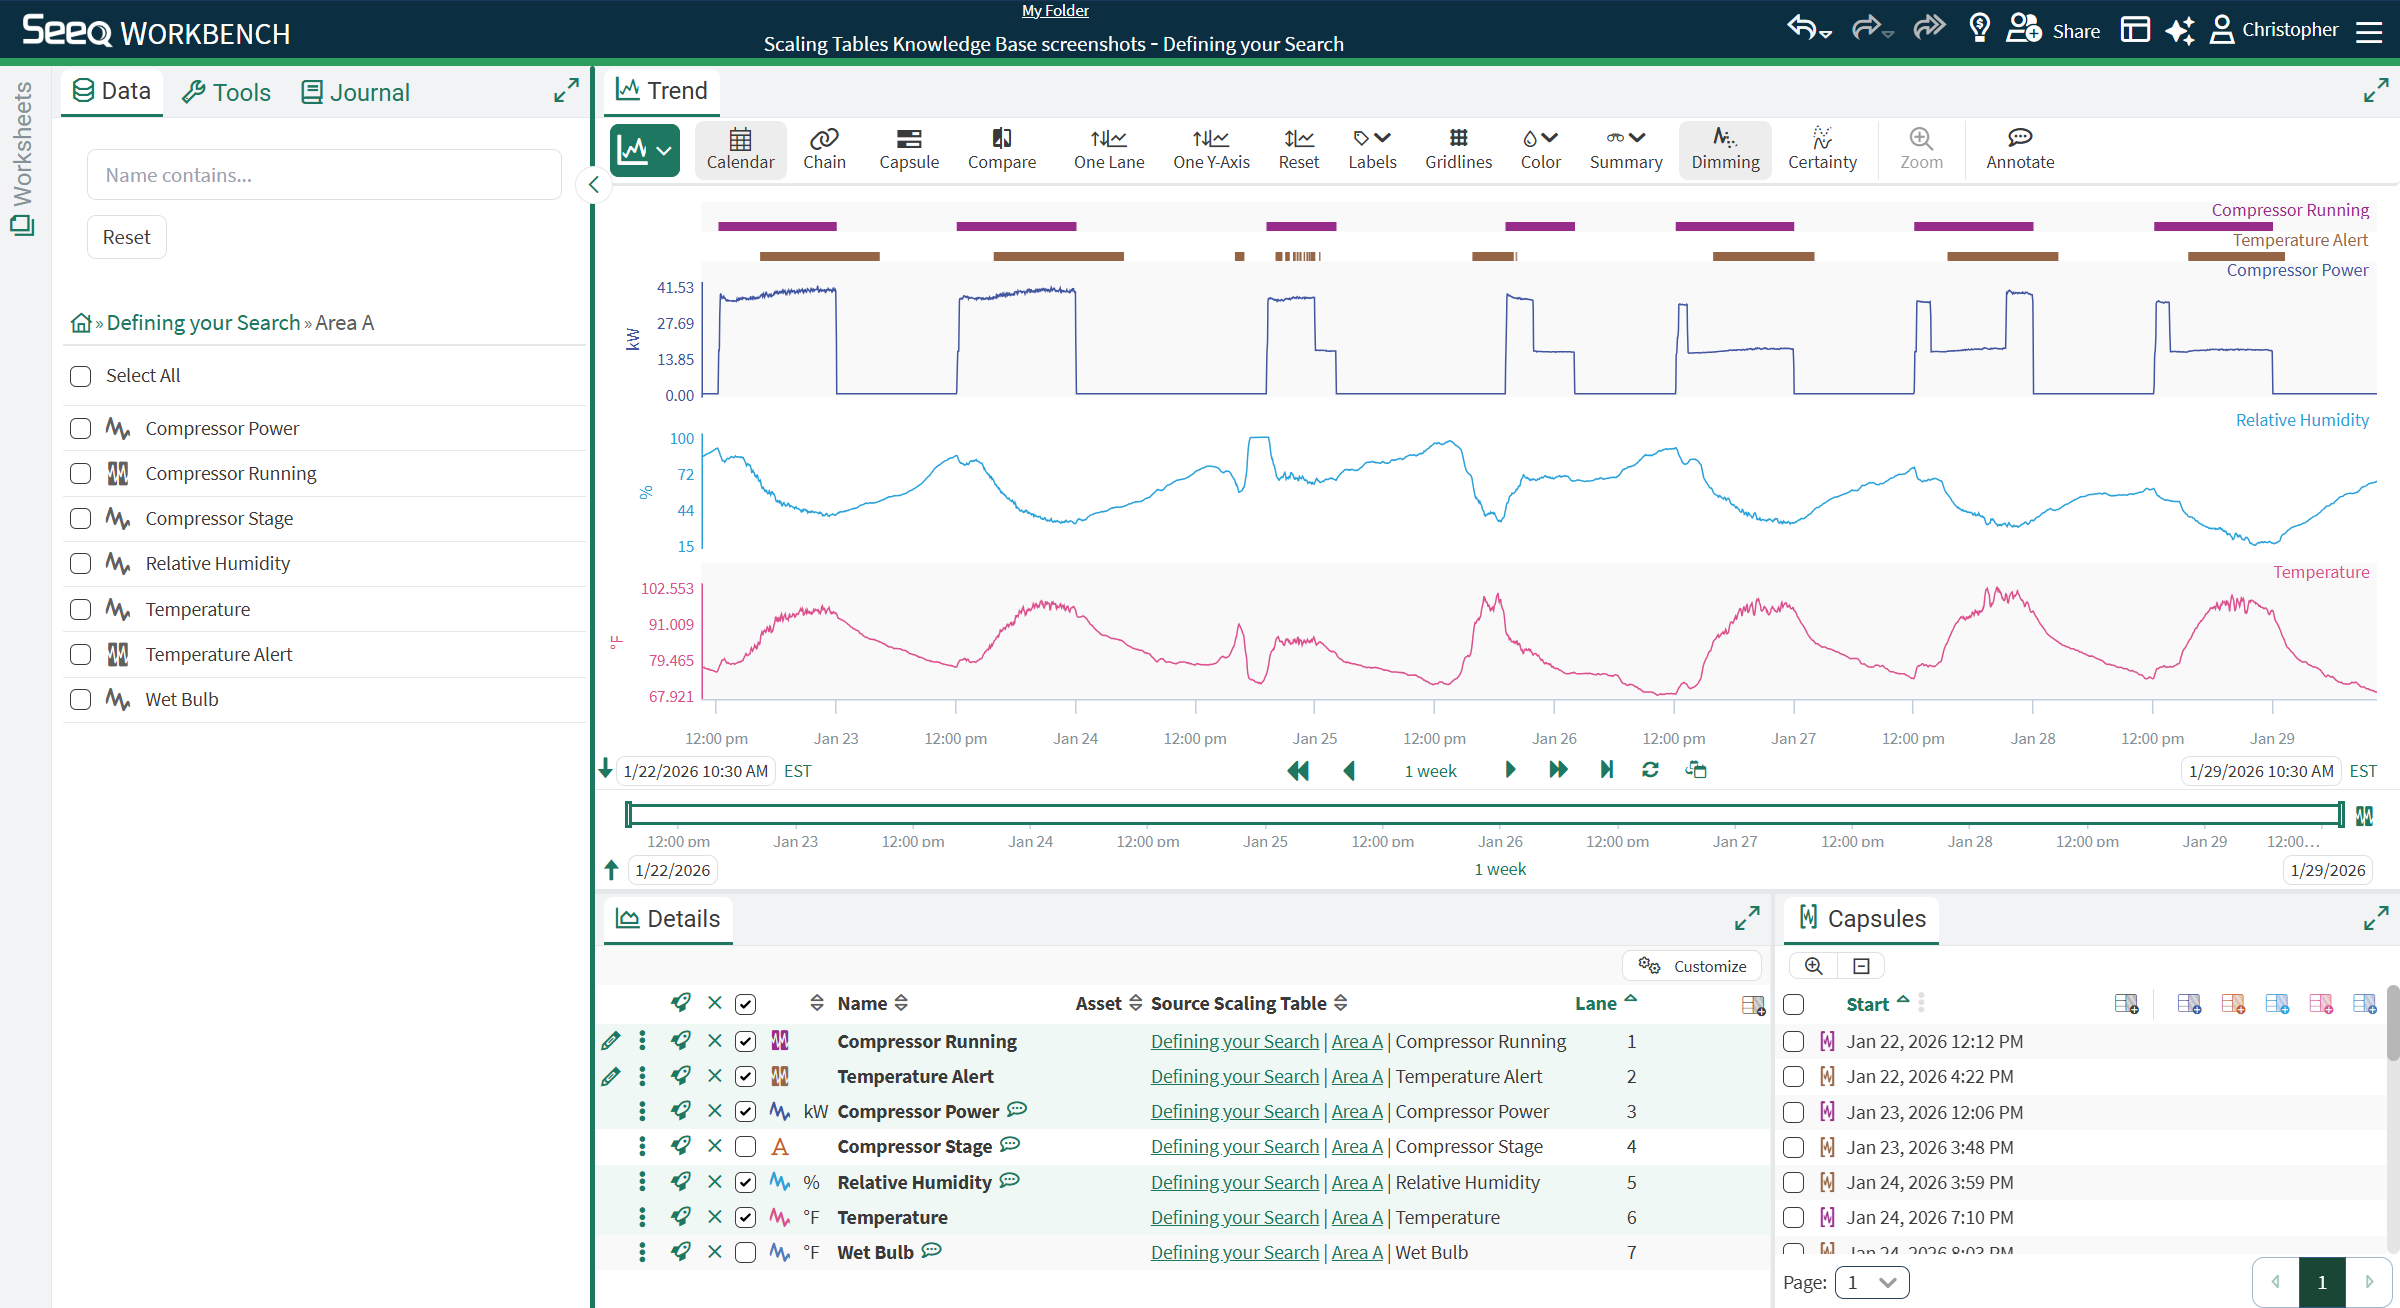
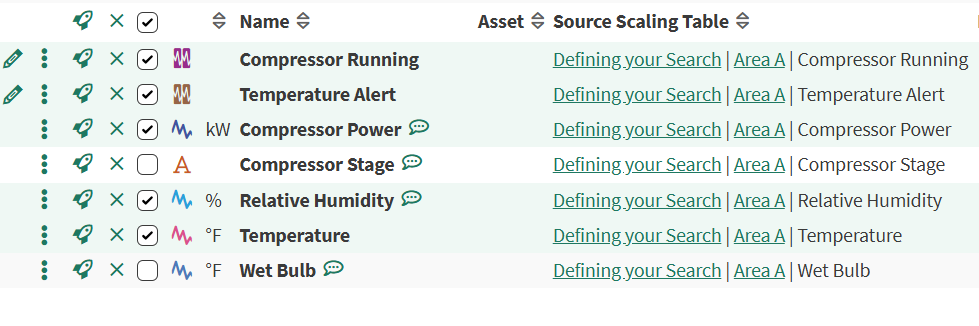
Notice the extra column now available in your Details Pane, called “Source Scaling Table”, including links to the Source Row and Source Table, which provide shortcuts to return to that Path in the Data Tab, or open the Scaling Table editor, respectively.
Overriding the Data Pane Navigation text
Some use cases require scaling to Assets that may have the same name, like “Reactor 1”, “Meter 01”, or simply just “Pump”; however, the entire Path or other properties are more descriptive of its true physical location, or have other distinguishing characteristics. To support this use case, and make navigating your Scaling Table through the Data Pane easier, you can make any Text column the “Data Pane Navigation” column. This is where columns rules to Find or Change Text can come in handy.
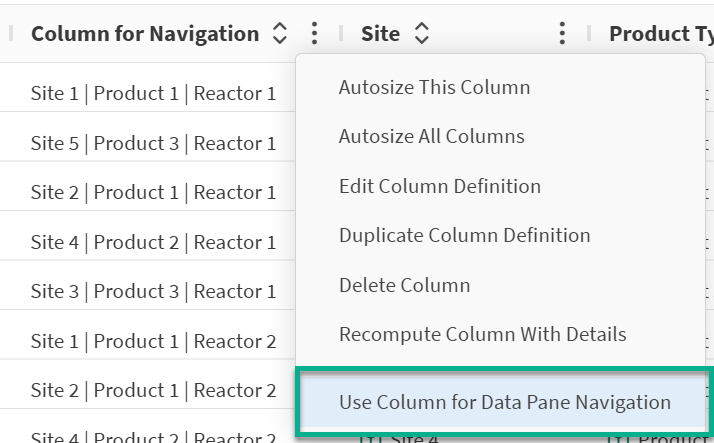
Once you have a column you want to use in place of the default “Search Items” column for navigation, simply click the three-dot menu and “Use Column for Data Pane Navigation”
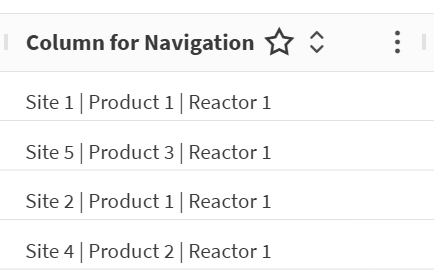
The column that is overridden to be used will have a star icon to indicate it is used for navigation.
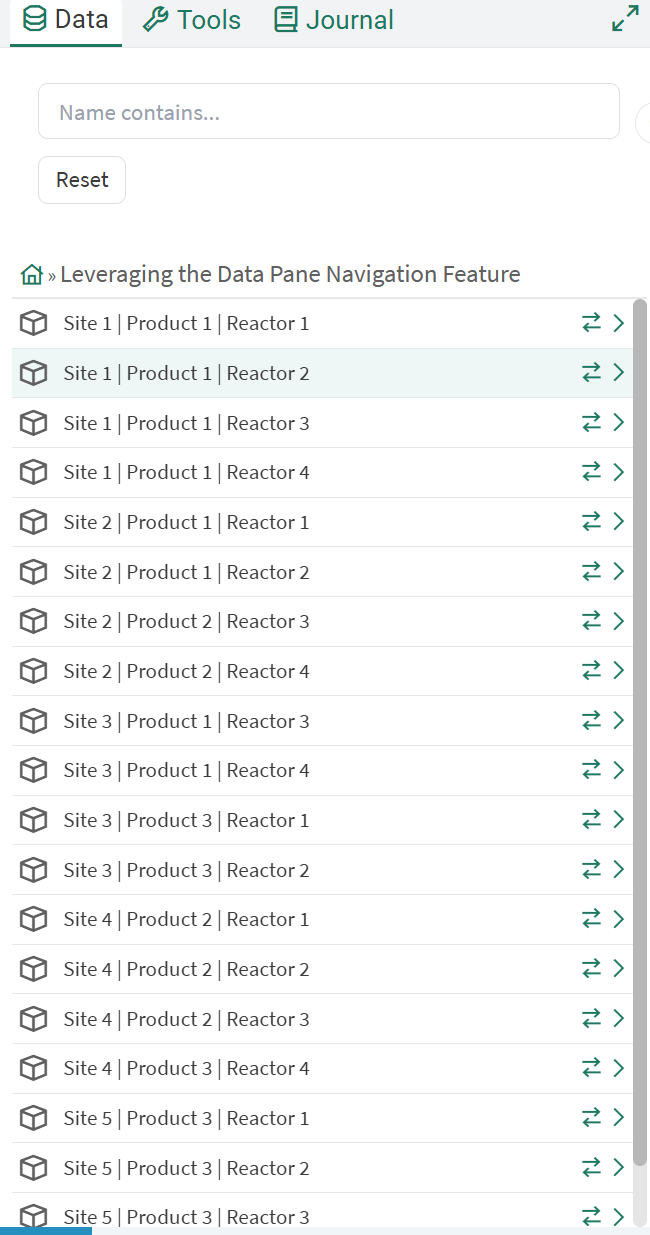
Once set, your Data Pane will now represent each row of your Scaling Table with values from this column, rather than the default “Search Items”, like below, making it easier to interpret and navigate. All row swapping and drill-in functionality remain unchanged.
Swapping
Just like Asset Groups and Asset Trees, you can “swap” between rows in your Scaling Table with the same icon.
Two key differences in this methodology are:
You can swap non-name matched items. In this new paradigm, we are swapping “rows” and thus “cells” from your Scaling Table. As such, they do NOT need to match names, just positions in the table.
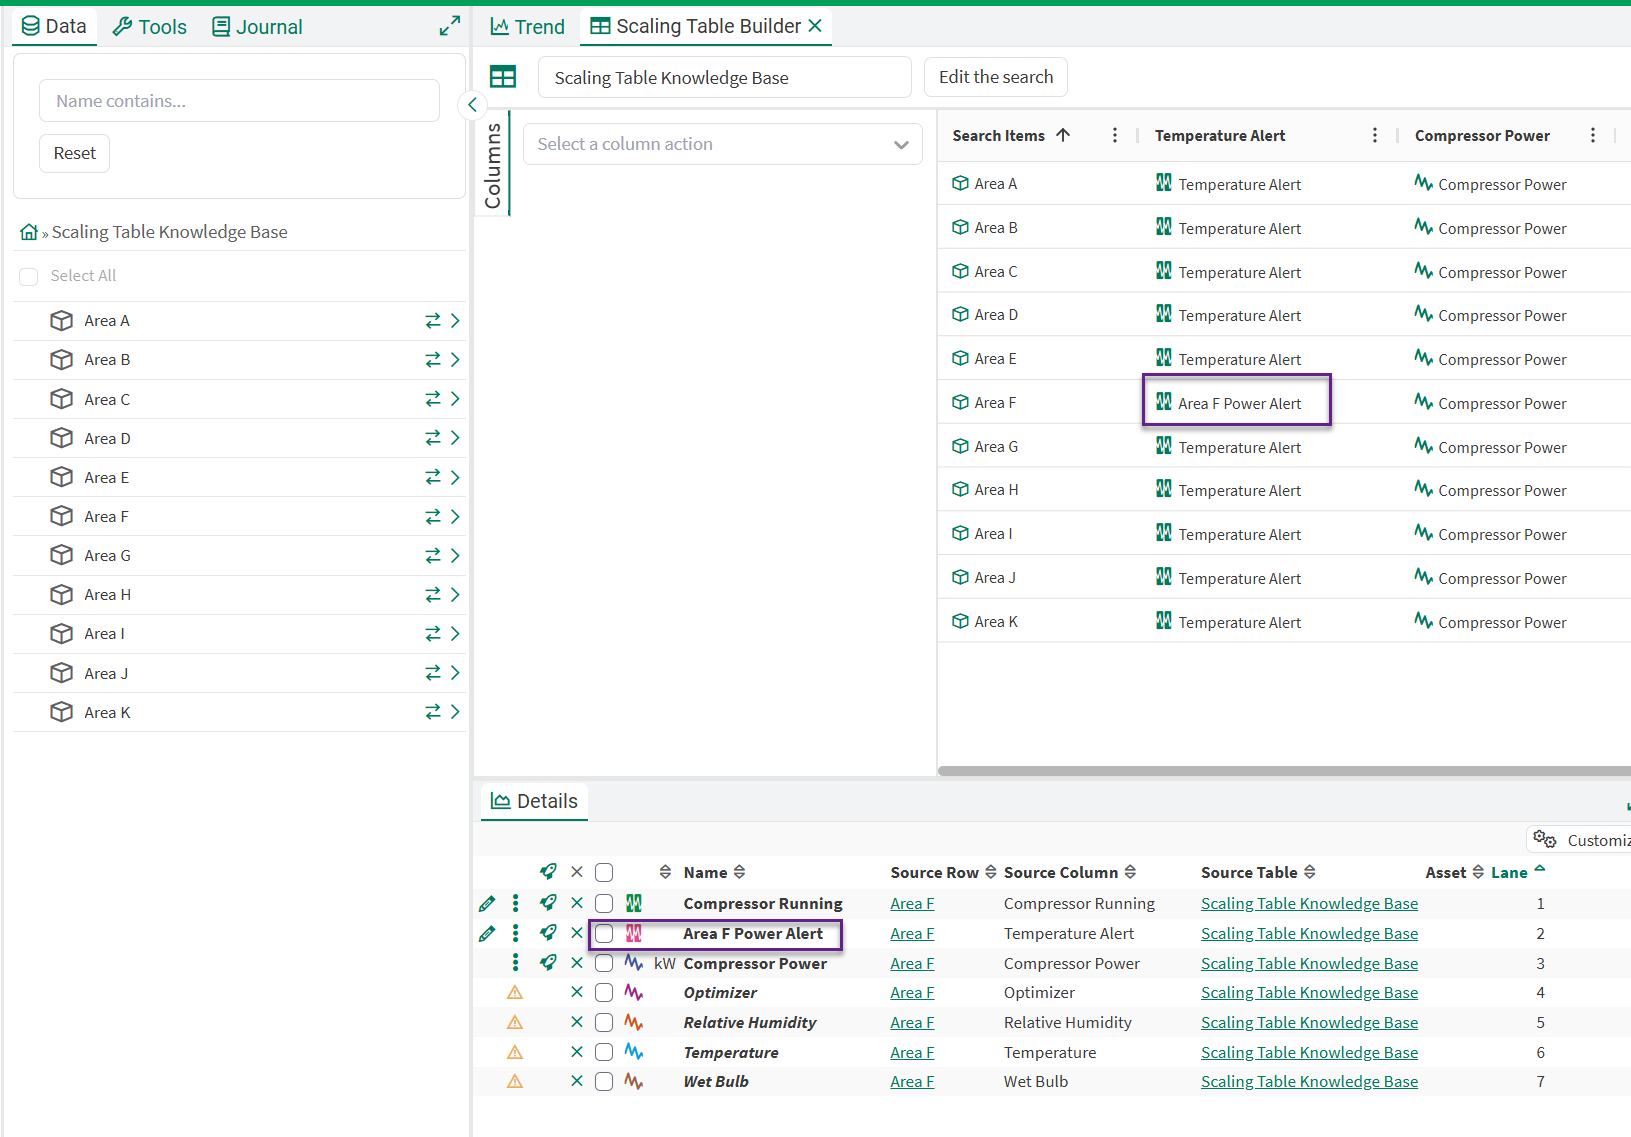
Area F used a fallback rule to compute a different-named Condition, but swapping is still successful
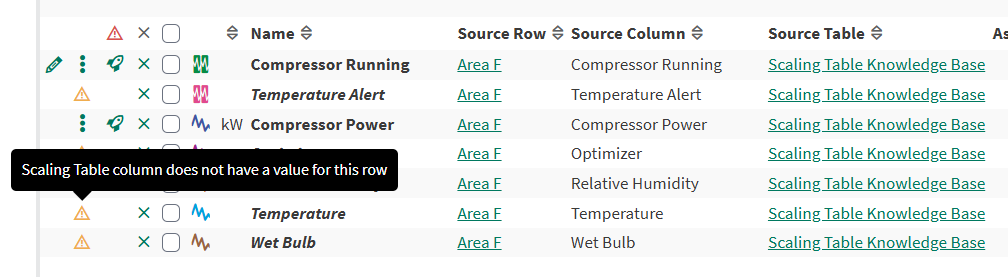
You can successfully “swap” empty cells. Legacy swapping methods require you to choose which asset to swap out, often resulting in a mismatch of Items in the Details Pane. Now, the swap will proceed but show a warning in the Details Pane and blank Lanes in the Trend, but allow you to continue swapping unhindered.
Scaling Visualizations
With your analytics configured and trended, you likely want to analyze the results across your fleet. Learn more how to accomplish this with built-in Workbench capabilities below or check learn how you could operationalize your event-monitoring workflow with Seeq Enterprise and Vantage on this page.
Tables & Charts
When the Items in your Details Pane are from a Scaling Table, you’ll see a new icon:
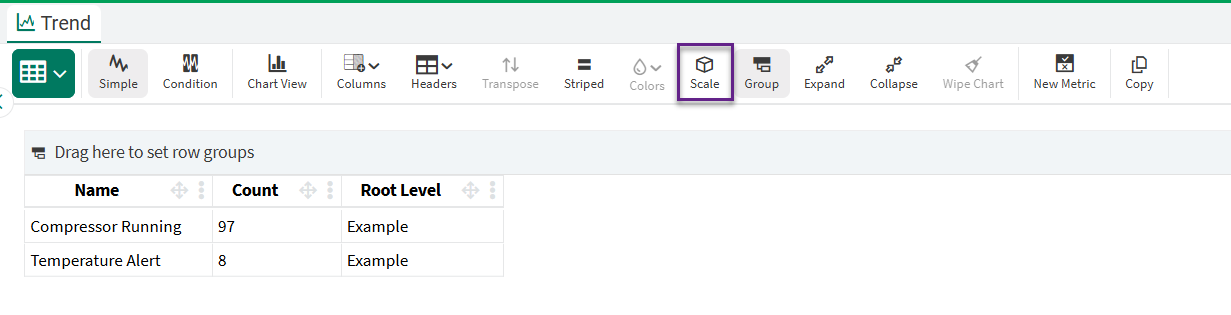
When selected, the calculations in your Details Pane will be scaled across all rows of your Scaling Table that also contain that analysis. This feature is compatible with both Simple Table and Condition Table.
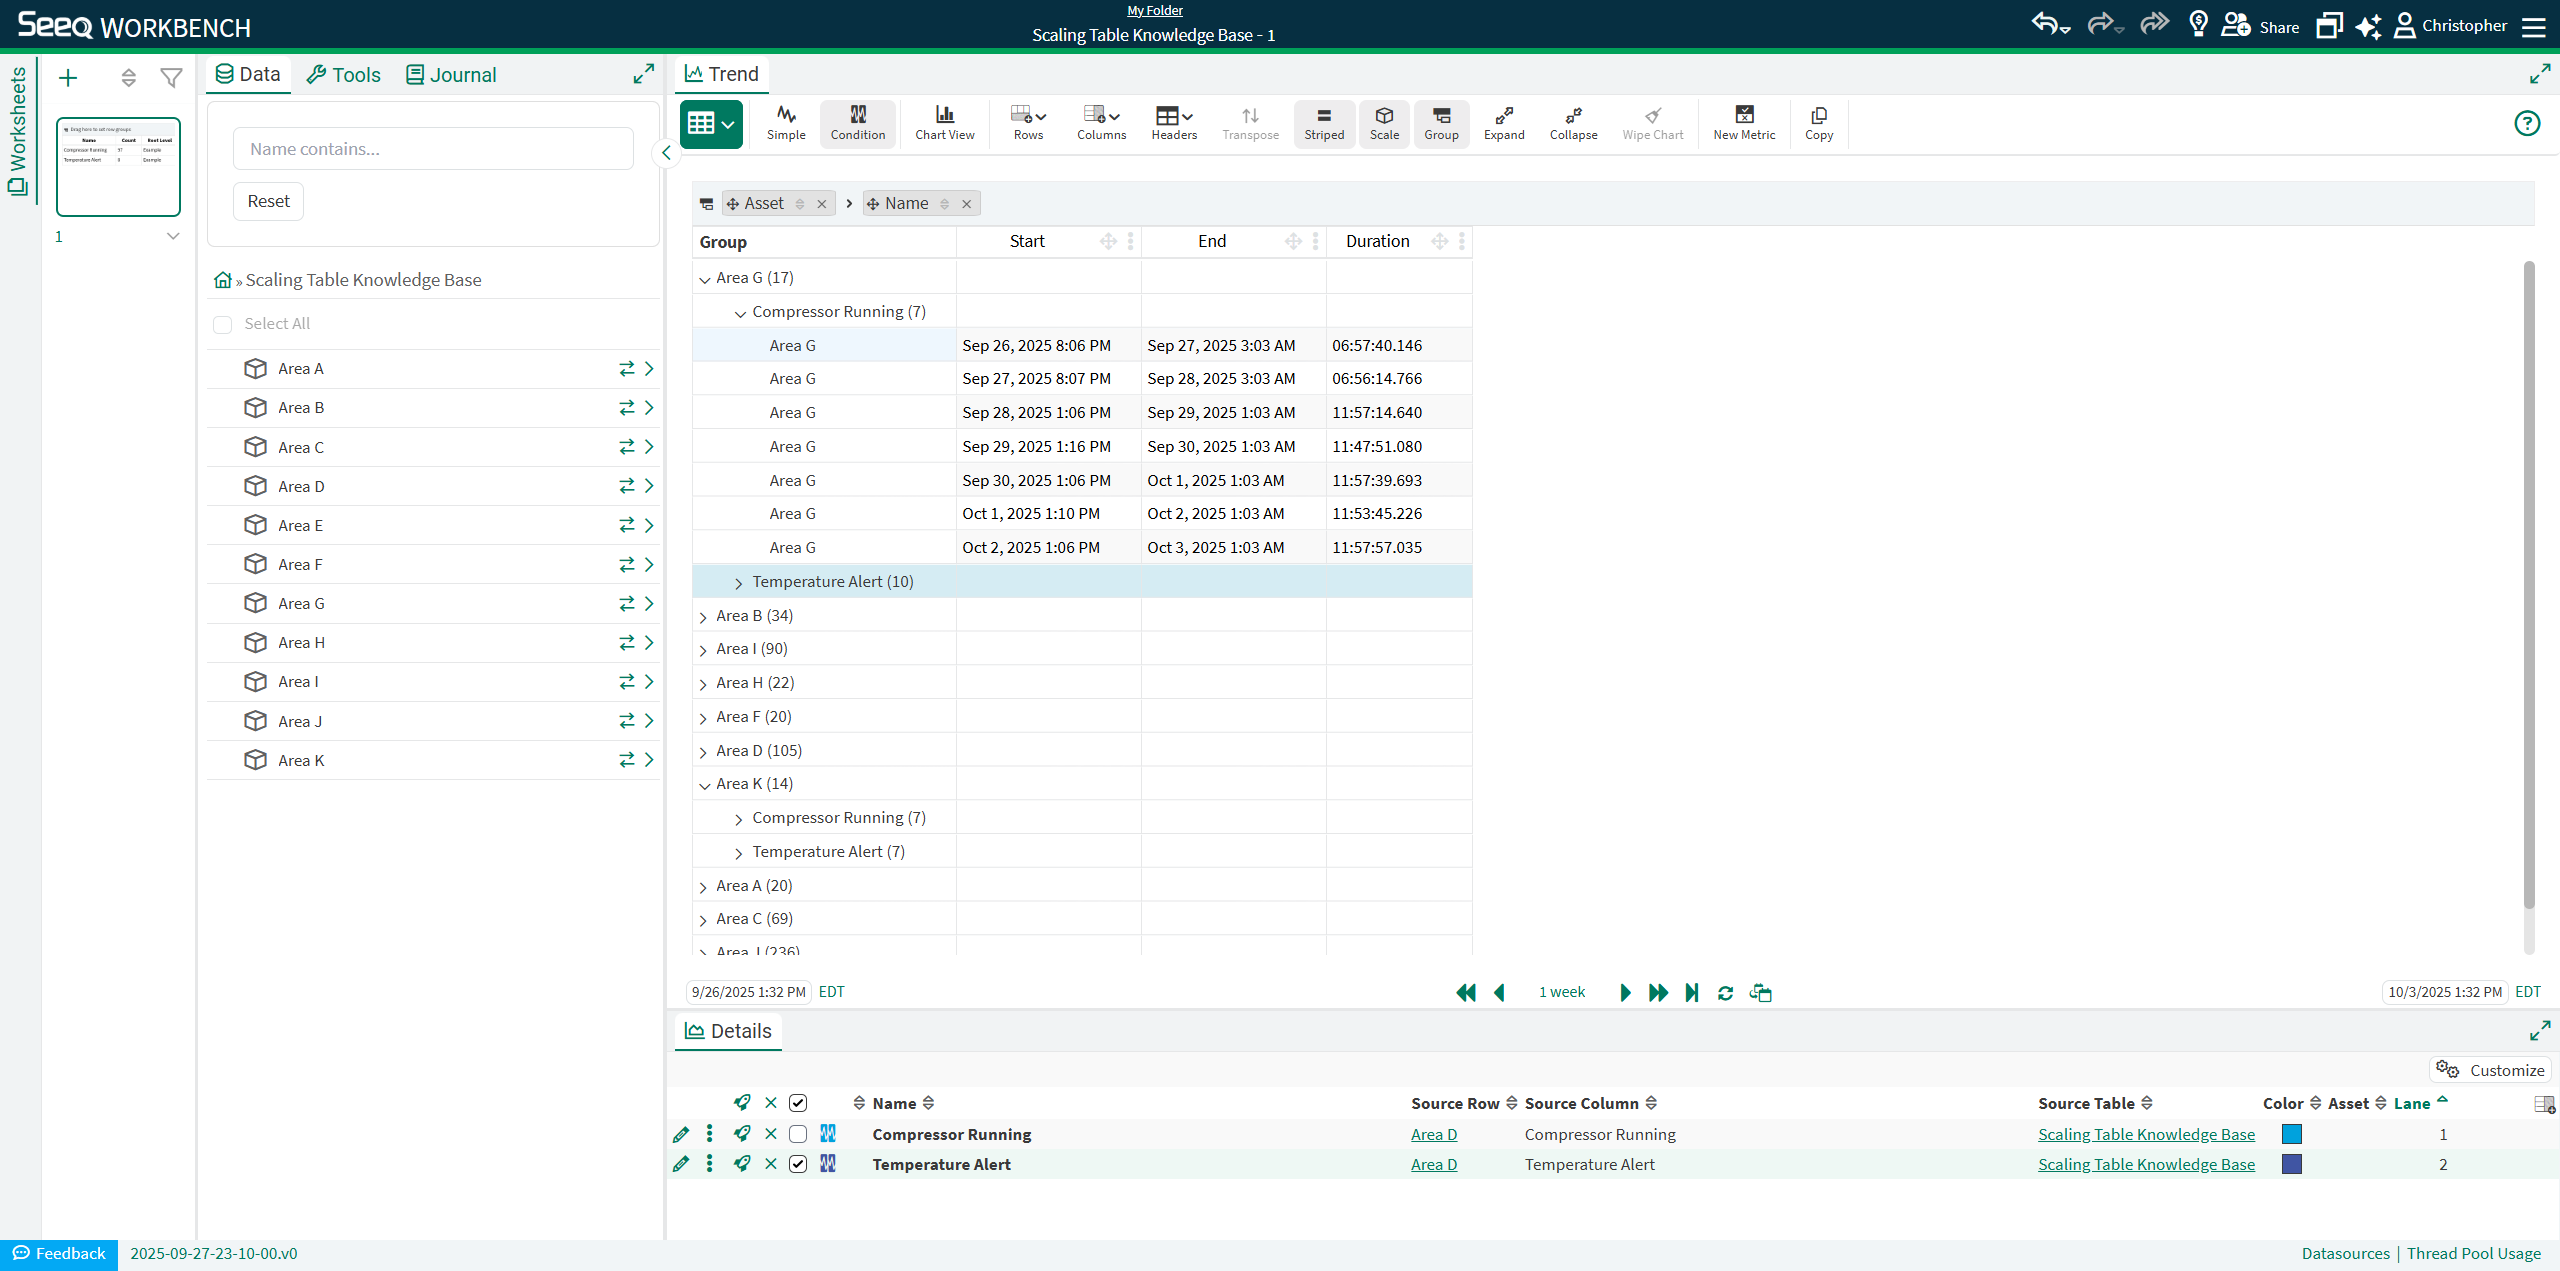
Just like the rest of the trends and charts you can create in Workbench, these Tables & Charts are also capable of being inserted into an Organizer Topic Document or Dashboard.
Treemap
Treemap view is not yet supported with Scaling Table created analytics, but look forward to that capability soon!