Exploring Usage Data as Administrators
Many administrators are interested in how Seeq is used within their organizations. See how much data is flowing through Seeq and gain insight on which users and sources are driving this traffic by exploring the Usage page. Access the Usage page from the user dropdown menu in the upper right corner of any page. Administrators are able to see usage from all users in this page, while users who are not administrators are only able to see their own usage. See more on this page.
Examples of questions this interface intends to answer (In addition to the examples on the this page.)
What is the cause of big spikes in usage?
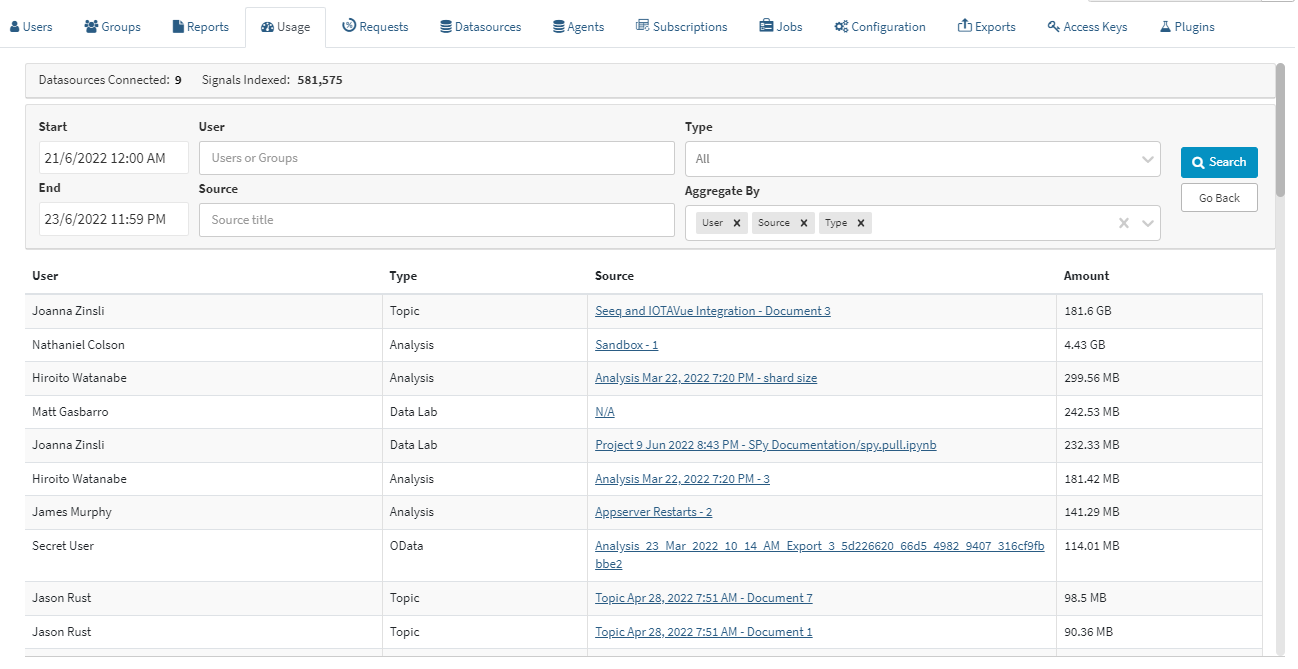
Looking at a daily trend, you may see a few days that have significantly more usage than others. You can add aggregation by User and Source to see who was using Seeq that day and which Workbook, Topic, or Project they were using to interface with Seeq.
Who uses Seeq the most?
Aggregating by user will reveal the users that consume the most data in Seeq. This could be with scheduled documents or scheduled notebooks that they may or may not open routinely. Cross checking with the Reports tab on frequency of schedules may be one thing to consider to mitigate high data usage.
Note that Organizer Topics use a configured account for access control of that Organizer. This defaults to the creator but can be edited on the Home Screen. Anyone who opens an Organizer Topic in Presentation, View Only, or Edit mode will appear as data used by that access control account. If the reading users make changes in View Only mode, they will initiate requests from their accounts and show on this list as using data from that Organizer Topic.
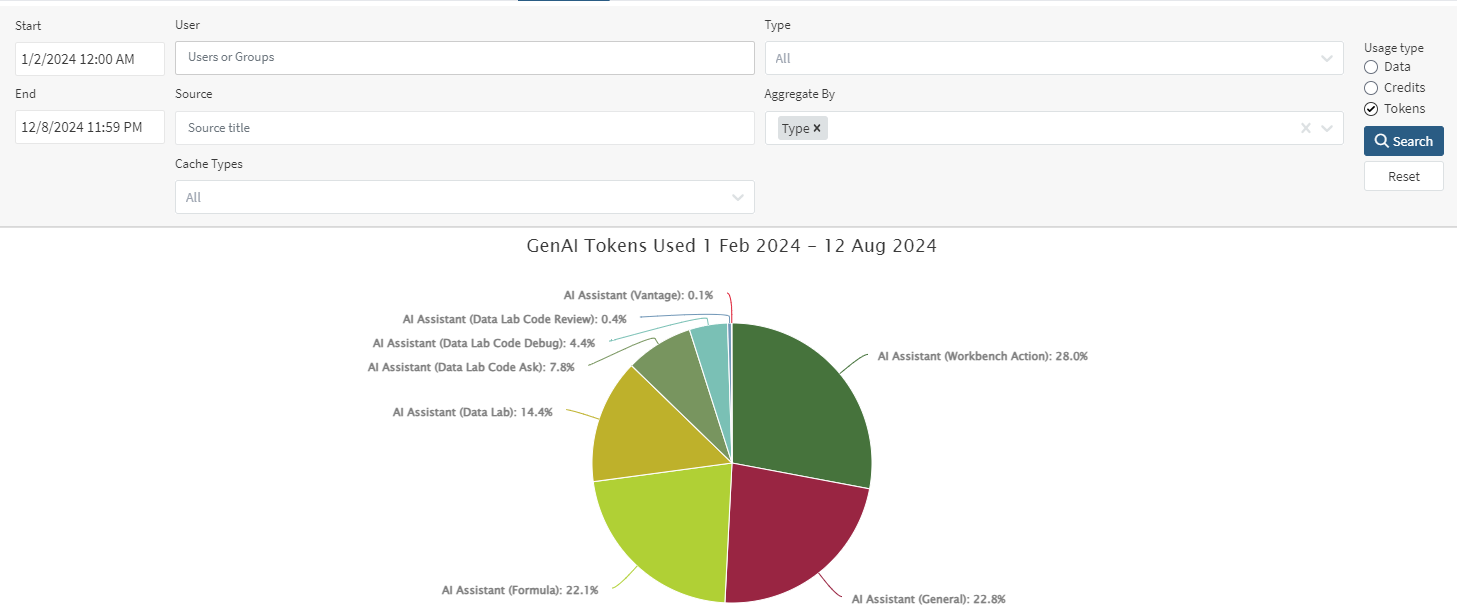
How do users interact with the Seeq AI Assistant?
While Data Privacy prevents administrators from seeing the questions asked by users, administrators can see which users are utilizing AI Assistants and what kind of assistance they are getting. On the Usage page, select the “Prompts” or “Tokens” radio button when performing a search to see how many prompts have been submitted and their associated token usage. Aggregating by Type will let you see how usage is spread between different areas where the AI Assistant is available. Aggregating by User will show how much different users interact with each of these. You can also aggregate by Month to see how this changes over time.
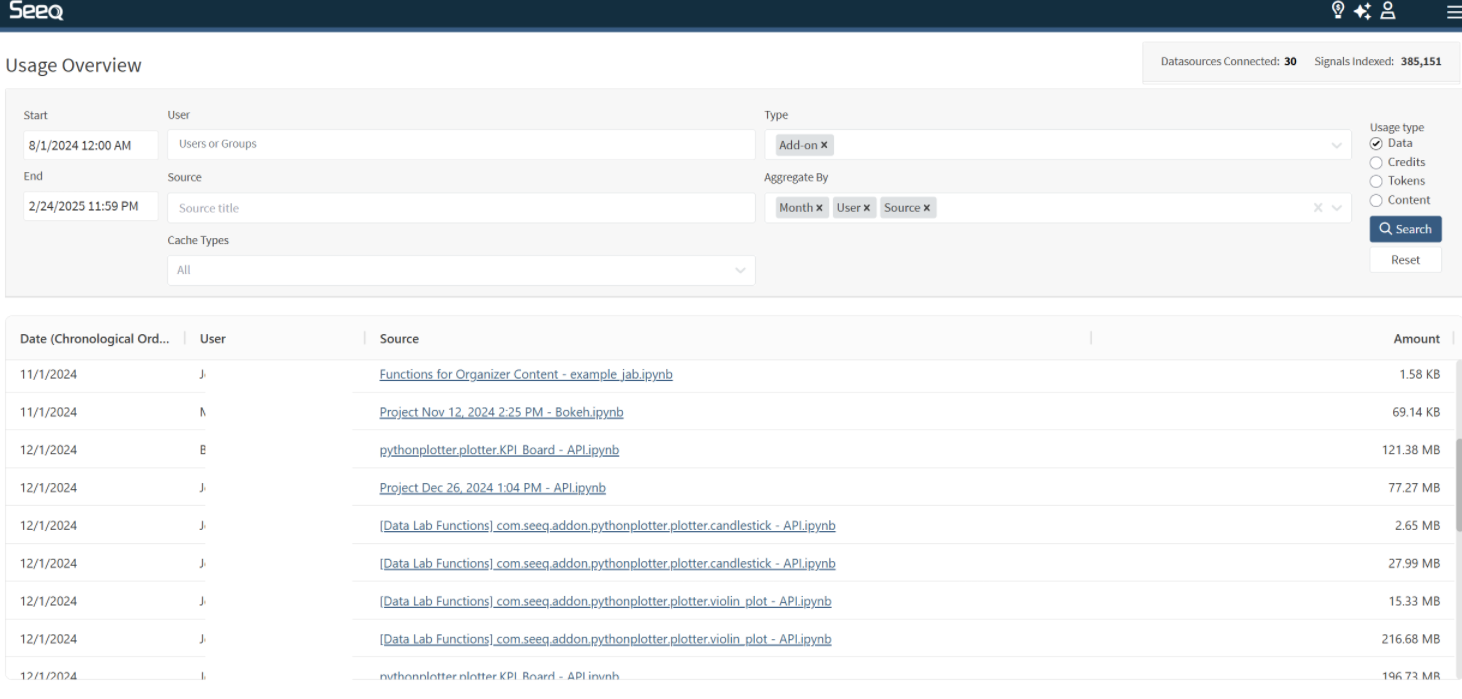
Which Add-ons are used by my team?
For Add-ons that are associated with a flow of data, apply a Type filter of Add-on and aggregate by User, Source, and Month to see a table of users accessing each Add-on in a monthly period.
Which Seeq Data Lab Projects are being used the most?
It is possible to monitor the usage of Data Lab Projects. To enable monitoring, switch to the "Credits" aggregation unit. By aggregating by Source, you can gain insights into how many credits each Data Lab Project used for the given time period. Information on how the Data Lab Project was launched, such as Scheduled Notebook, Add-on, or Project, is also included in the output.
Aggregation Types
In addition to types mentioned in the general usage article, administrators are also able to aggregate by user since they can view usage from all system users.
User - Aggregate all data requested by each authenticated user.
Monitoring Data Usage
As mentioned above, the Seeq SDK includes APIs that allow you to query usage data and specify aggregation parameters. If you would like to monitor usage statistics in the background and email you when thresholds are exceeded, you can easily set up a Seeq Data Lab scheduled notebook to do so. Attached below is an example notebook that achieves this, upload it to a Seeq Data Lab project and walk through it. It is heavily annotated and provides several customization options.