Inserting Content - Dashboards
Visualizations from Workbench Analysis and views from Vantage can be added as content to Organizer Topic Documents and Dashboards. This page details relevant inserting flows for Dashboards.
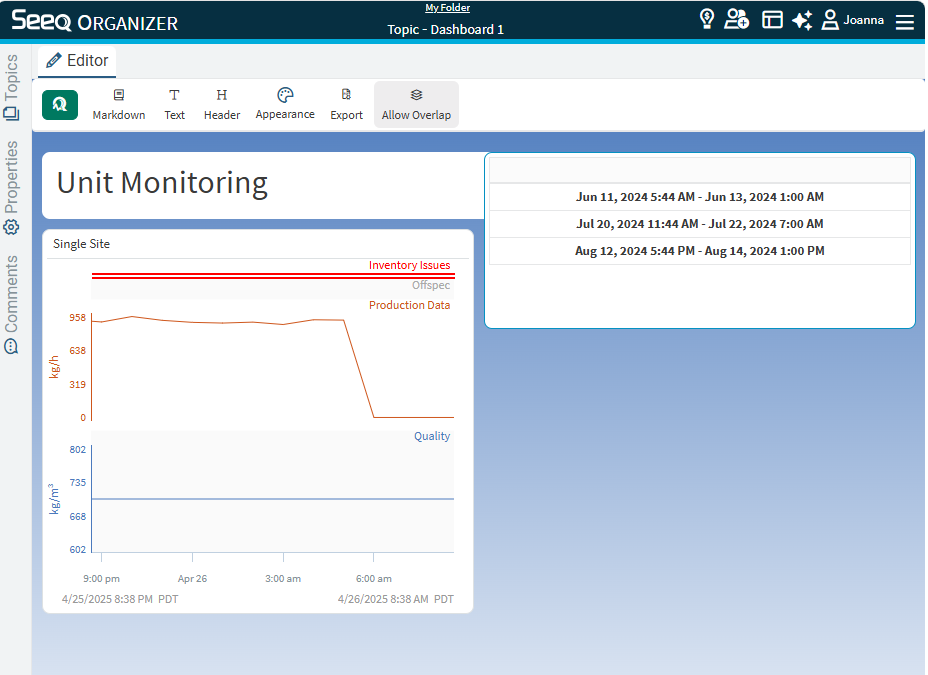
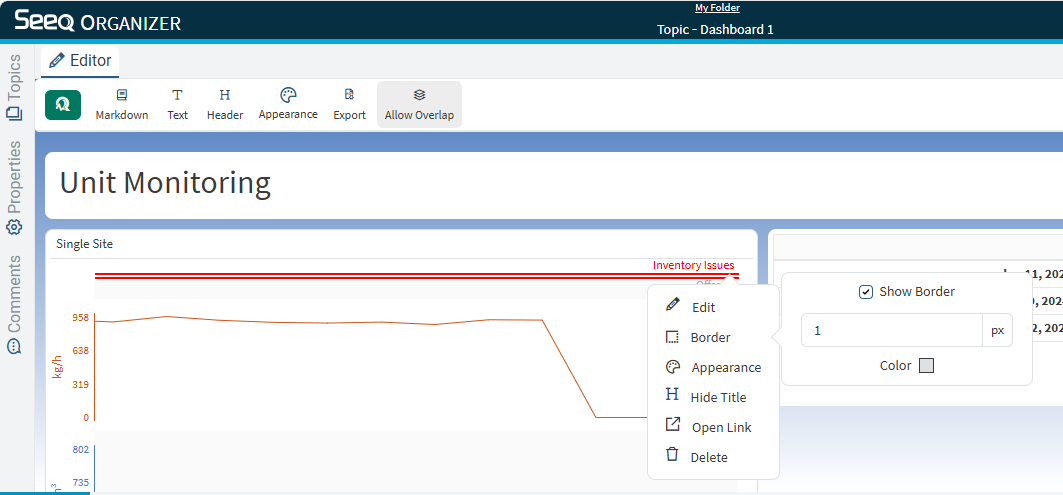
With Allow Overlay enabled, the table content can overlap the page title.
Use the Seeq icon in the toolbar at the top of the screen to insert Seeq content, or click on + Insert Content to get started. This can be done by searching for a specific worksheet or by pasting a URL from Seeq. Multiple worksheets can be inserted at the same time.
By default, Allow Overlay is enabled in the toolbar. This lets you drag content anywhere on the page, even if it layers over other content. Disable this option to force the content to fall on a grid. This can be easier to reorder content by automatically moving other content.
Inserting content from a Worksheet or Room
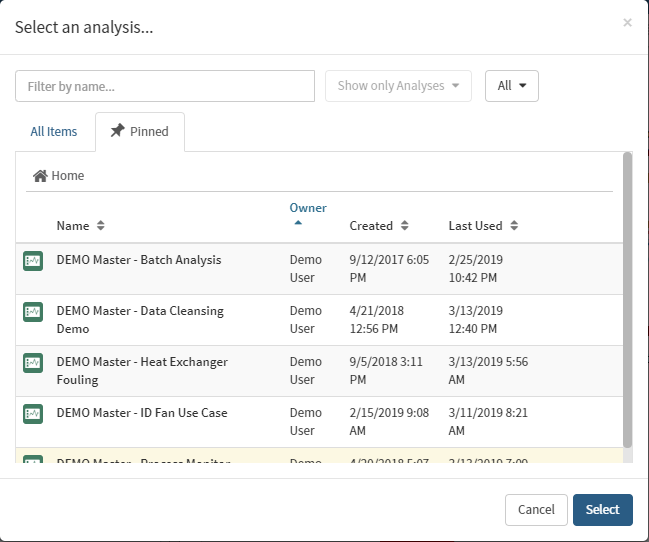
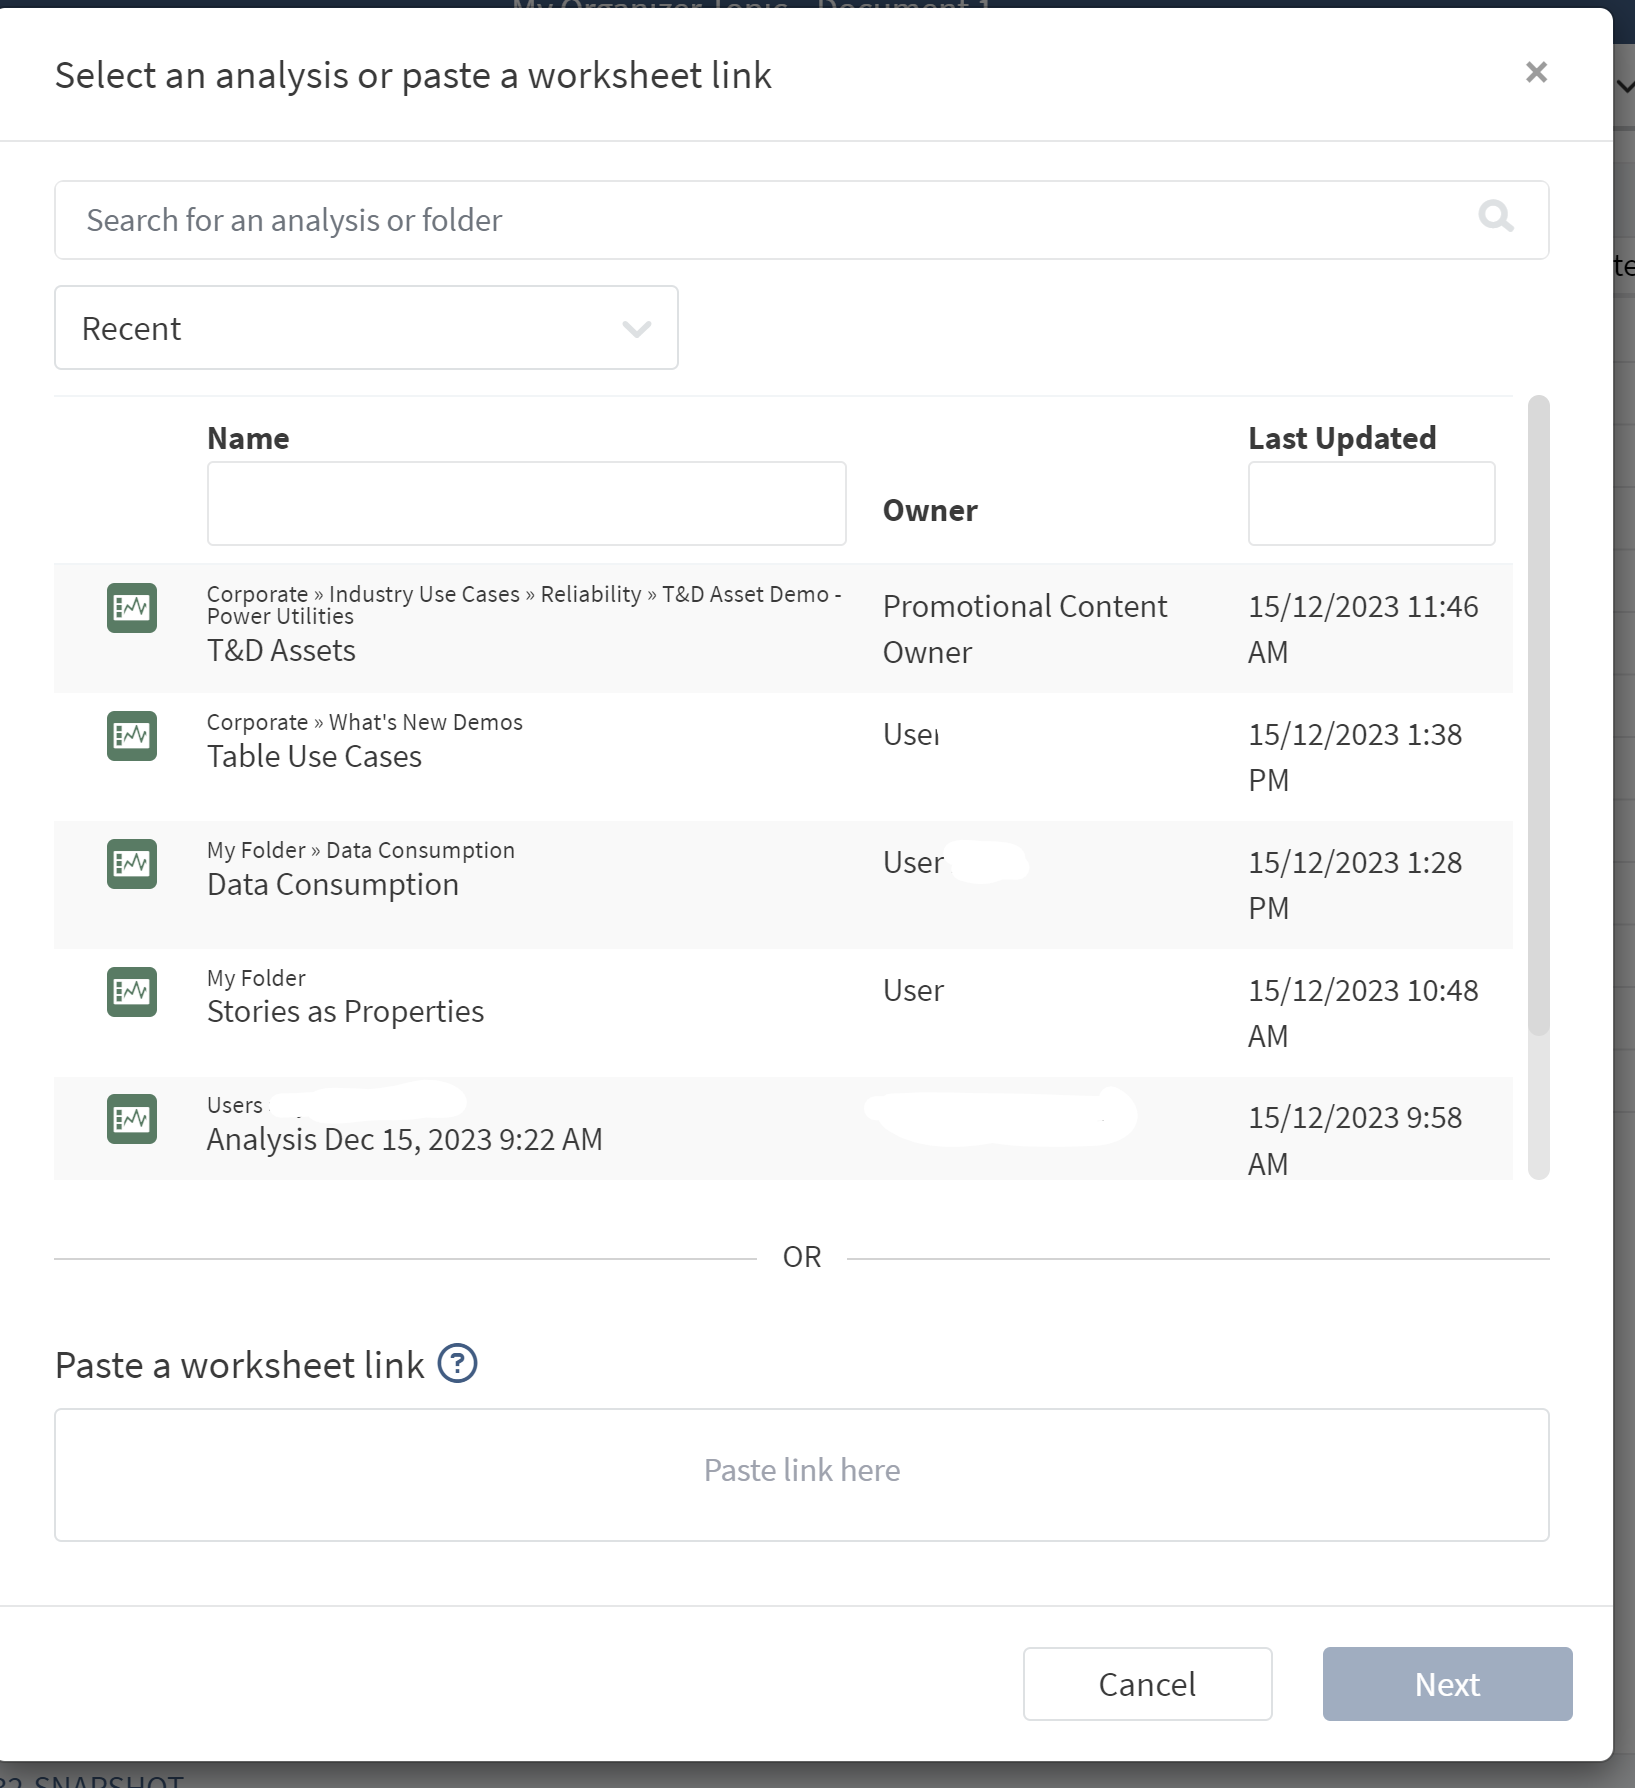
Select an Analysis or Vantage Room...
First navigate to and select the Analysis or Vantage from the menu. Note all filtering and search functions available on the home page can be applied (Public Items, My Items, etc.). Pinned workbooks are also available through this interface.
Select the item from the menu and the next pop-up will automatically appear.
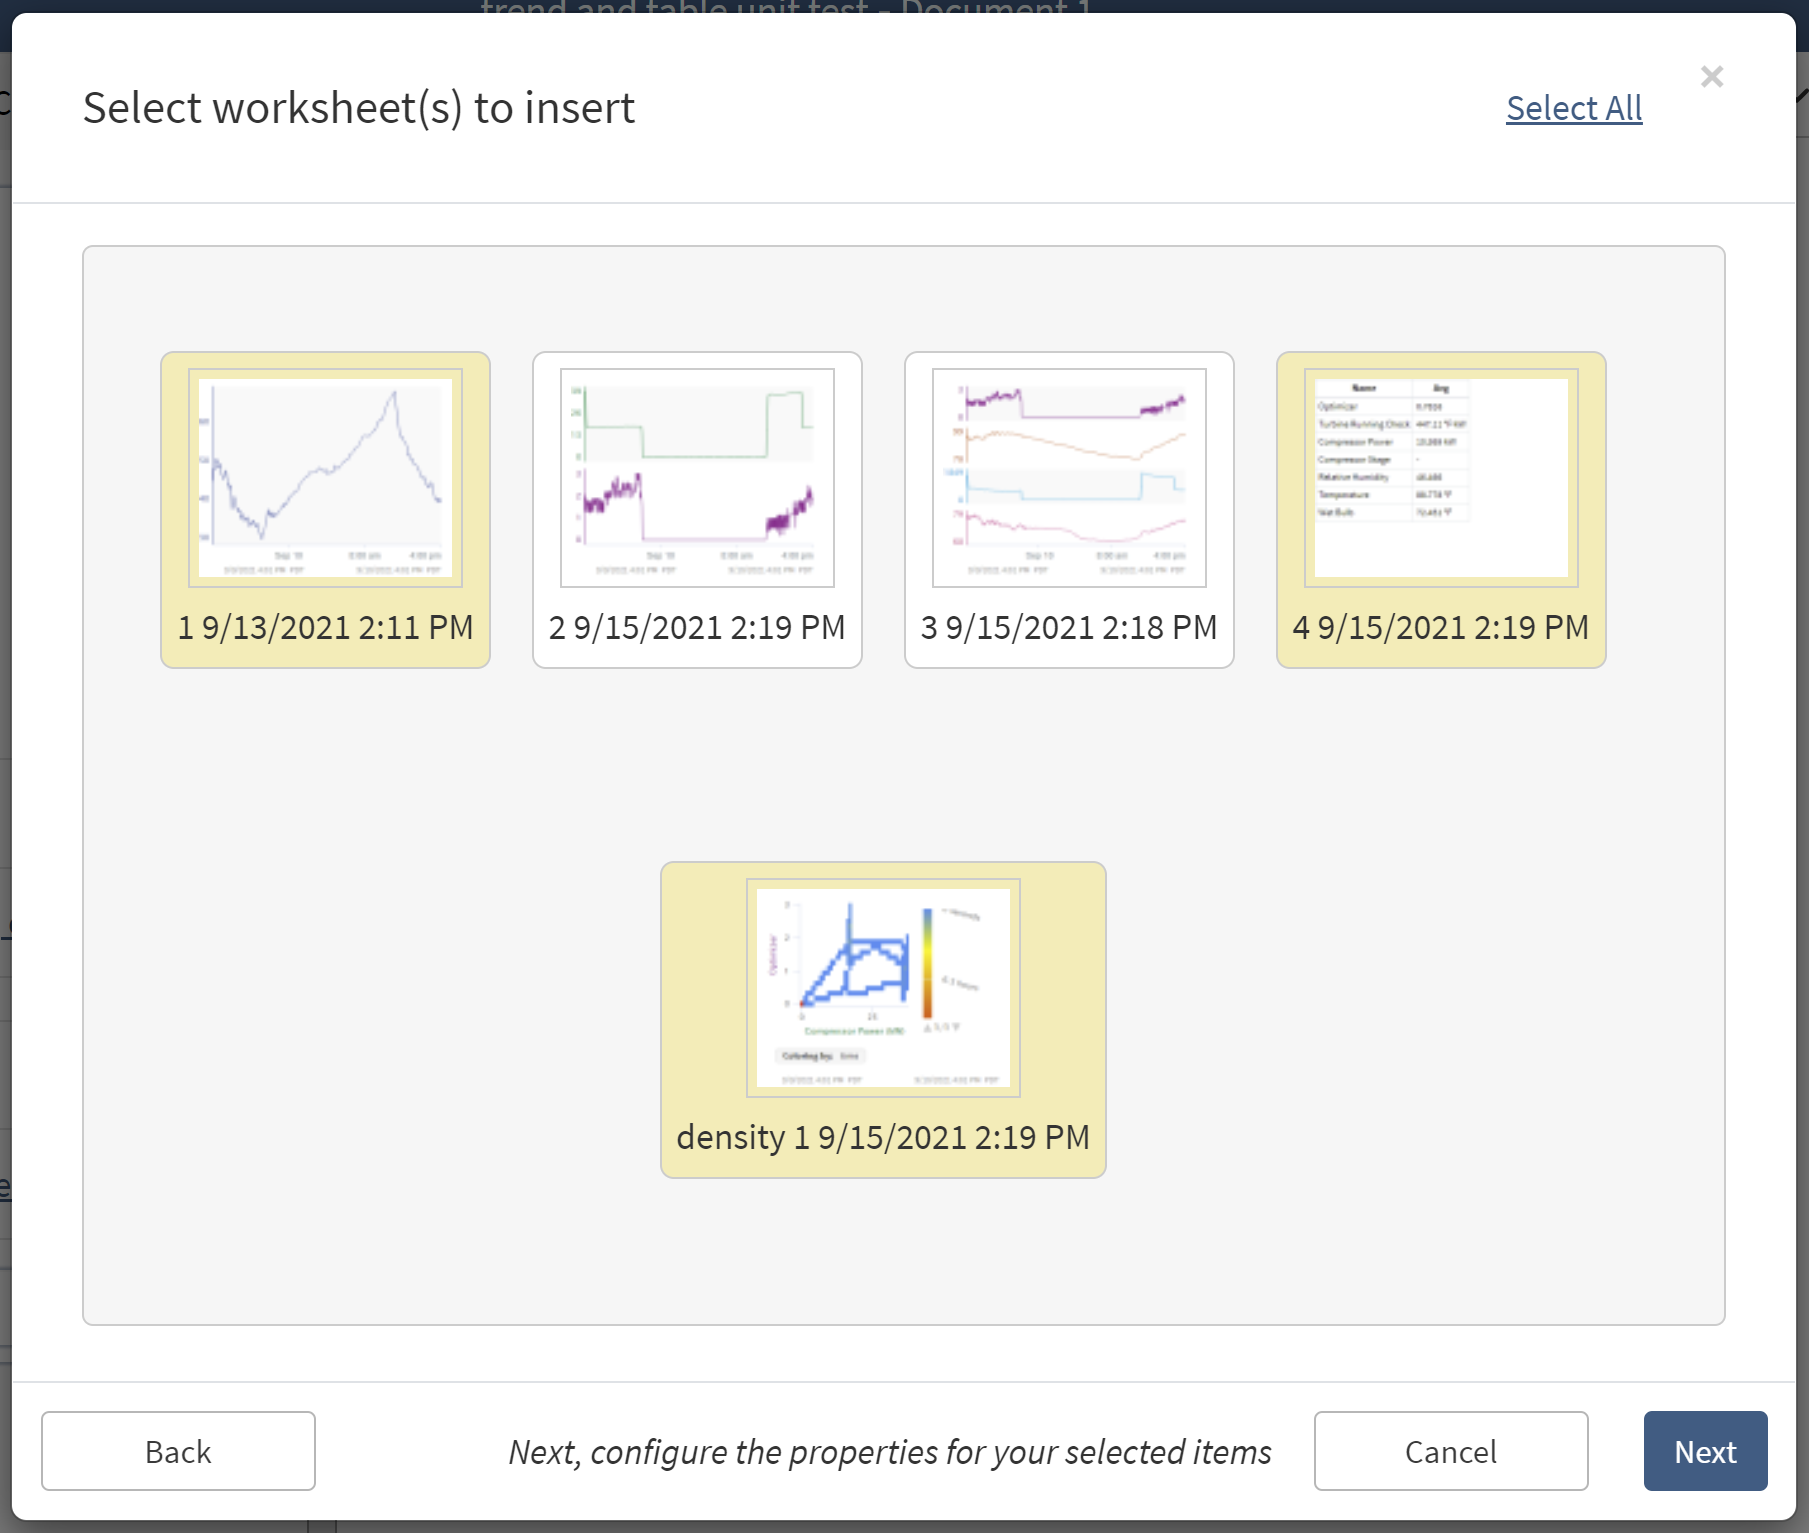
Select a Worksheet or View...
Find and select the worksheet within the Analysis or the view within the Vantage room that will be inserted into the Organizer Topic. Double click or single click and then click "Select." Multiple worksheets can be selected or unselected with single clicks, or the select/unselect all button in the top right. Then click “Next”.
Inserting Content from a Link
Copy the URL from the Seeq worksheet to be inserted into the Organizer Topic and paste into the lower portion of the pop-up. The box where the URL is pasted will turn green if it is a valid Seeq link. Invalid links will not be inserted.
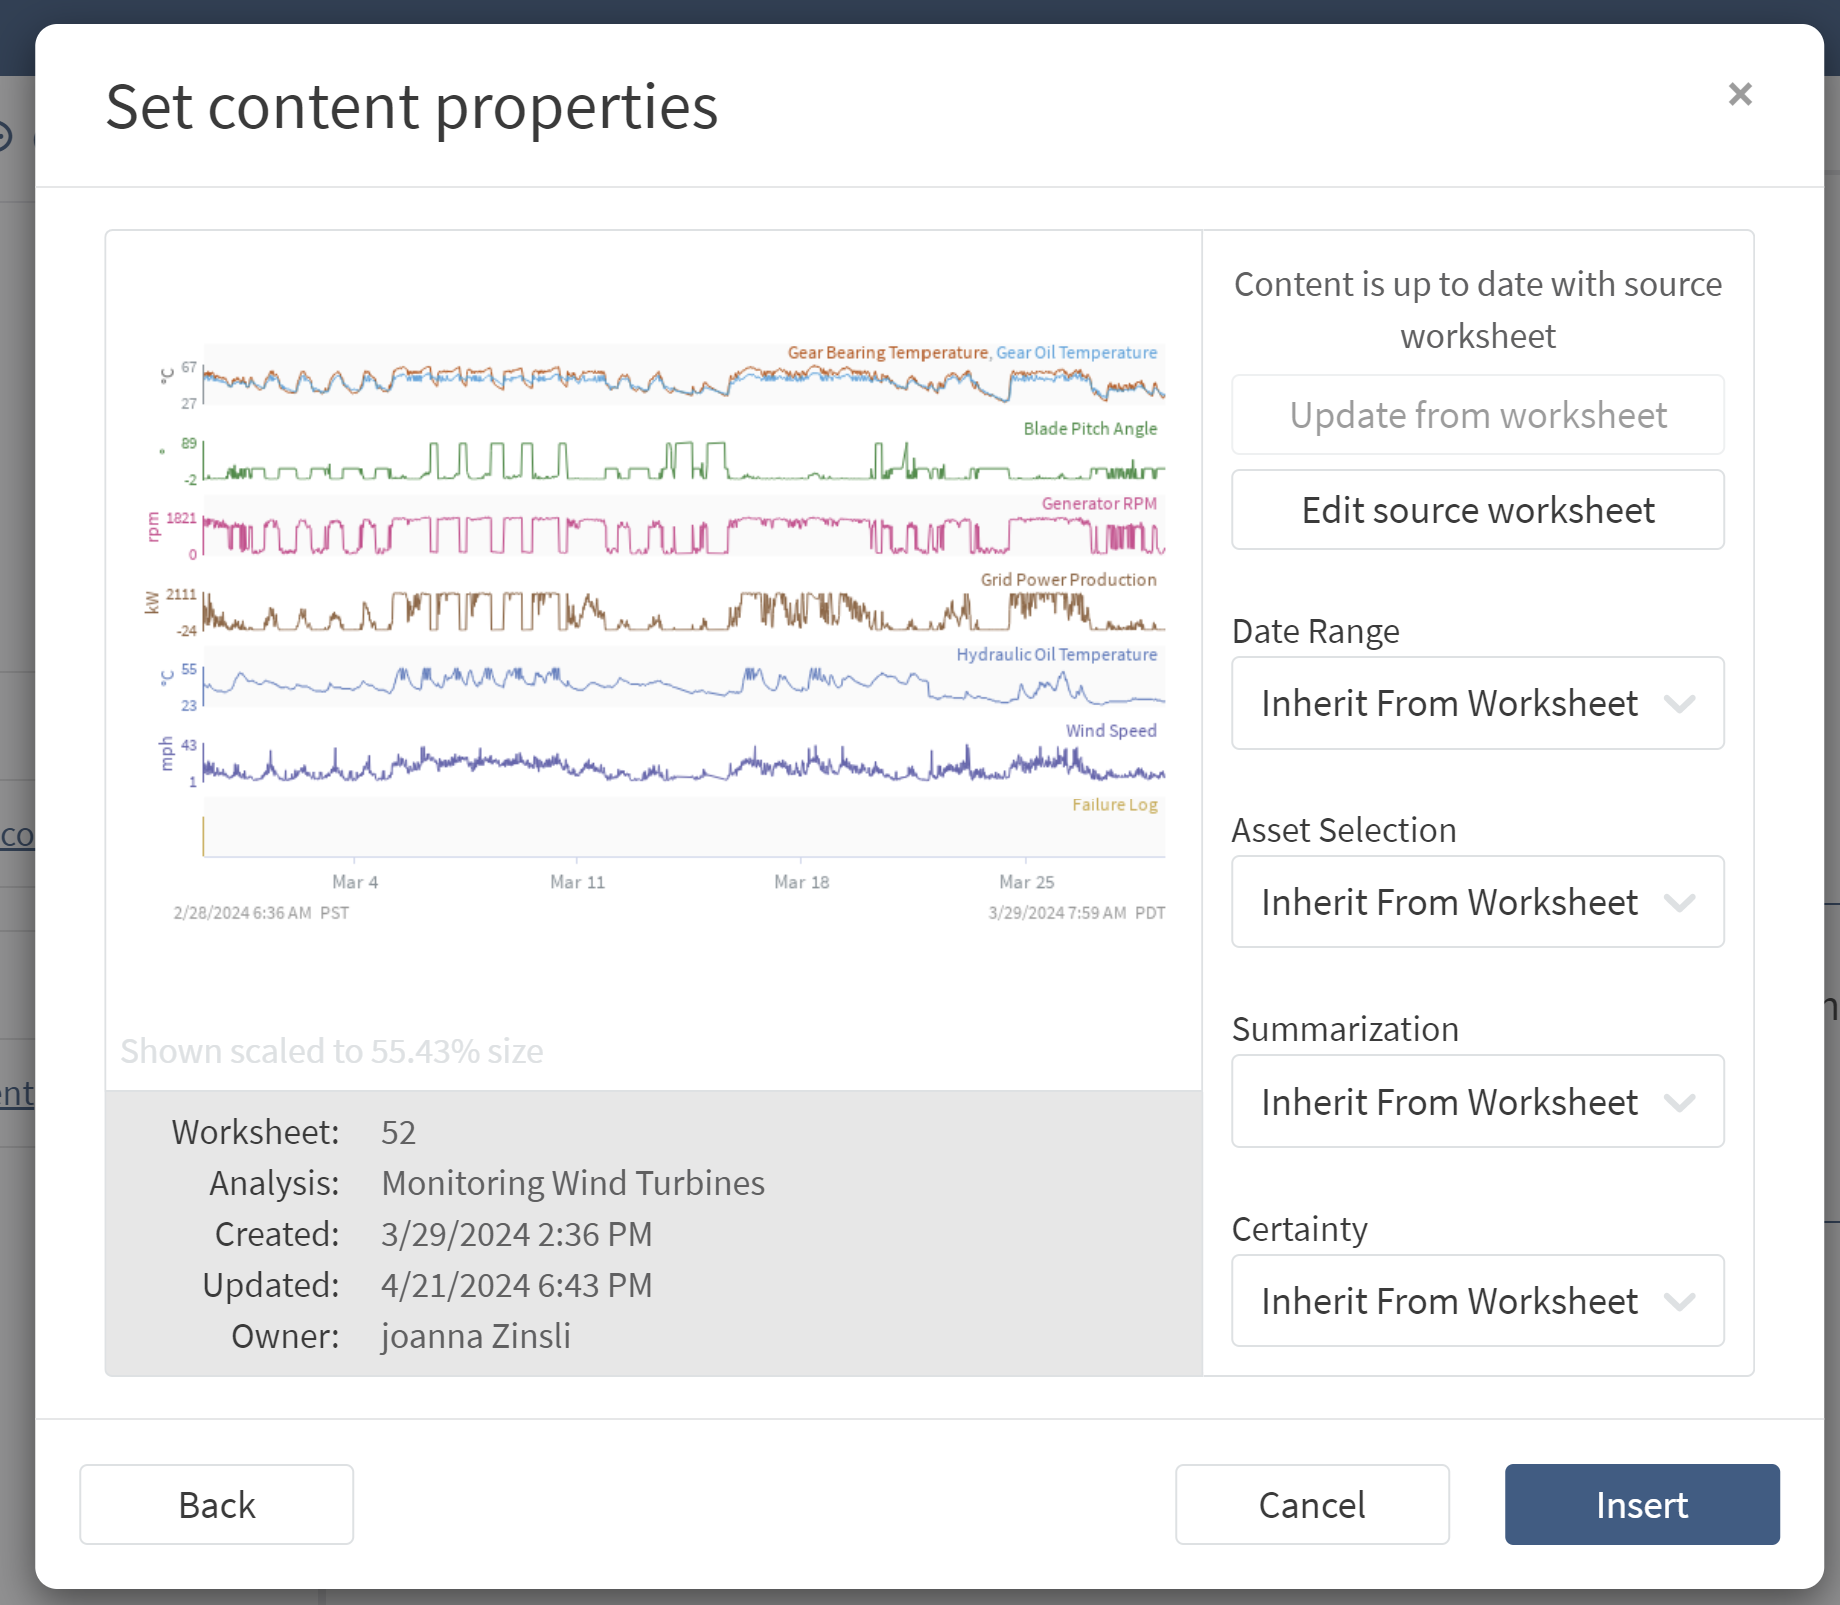
Set Content Properties
All content in Dashboards are interactive (hover over to see values on trends, sort and filter tables).
Size and shape are established by adjusting each piece of content and are not configured in this modal. Drag the lower right corner of each piece of content to adjust size and shape after inserting.
Date Range: Select a date range to apply to the image. Default is Inherit From Worksheet, but more than one date range can be configured to enable a document to have the same trend with varying dates, or a combination of trends and tables with different date references.
Asset Selection: Select an asset selection to apply to the content. Default is Inherit From Worksheet, but an Asset Selector can be configured to enable content to be updated to display data from a different asset than what is displayed in the original worksheet. Asset selection is not relevant for Vantage content.
Summarization: Visual summarization can be applied to show fewer samples than displayed on the original analysis. Read more about signal summarization here.
Certainty: If a calculated result may change, Seeq defaults to display that as a dashed line or a hollow capsule. If you don’t want viewers to see this indicator that the result may change, you can opt to Hide uncertainty Indicators when inserting content. Read more about data certainty and uncertainty here.
The above properties can also be updated for more than one piece of content at a time as described in Modifying Seeq Content.
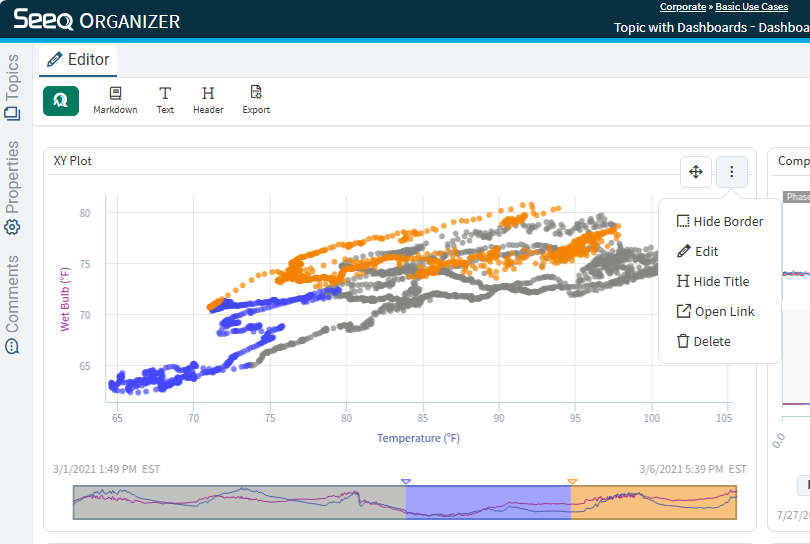
Content defaults to display a title that is the same as the worksheet it came from, but this can be hidden using the three dot menu in the upper right corner that appears when hovering over content.
After inserting content, use the three dot menu in the upper right corner to make modifications or remove the content.
Use the double arrow button that appears when hovering over content to drag to a new location.
You can resize content by clicking and dragging any edge or corner when selected. Content can also overlay other content if desired. There are some limitations to overlaid content upon page resize, so consider what page size is most likely to be used for viewing the dashboard when creating it.
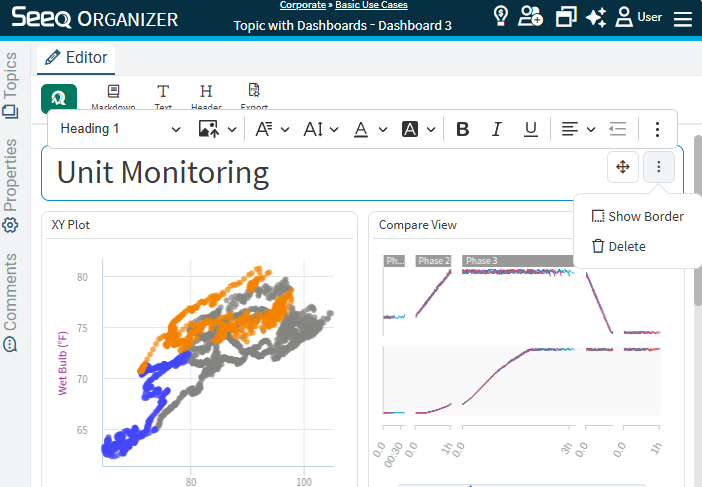
Inserting Text or Headers
It can be helpful for dashboard viewers to have more information about the data they are viewing. Titles or additional text can add relevant information. Either can be inserted with the icons in the toolbar.
Using the Header button will default to insert at the top of the dashboard with Heading 1 formatting while the text button will insert a text box at the end of the dashboard with Paragraph formatting. Both Text and Header icons insert a text box that can be modified using the floating toolbar associated with each text box.
Images and external links can be added through these text boxes. This can be helpful to bring in flow diagrams created in other applications to view with Seeq content alongside or on top.
If you are working with the AI Assistant and want to copy any output from a chat to a dashboard, you can copy from the chat and paste into a Markdown in your dashboard.
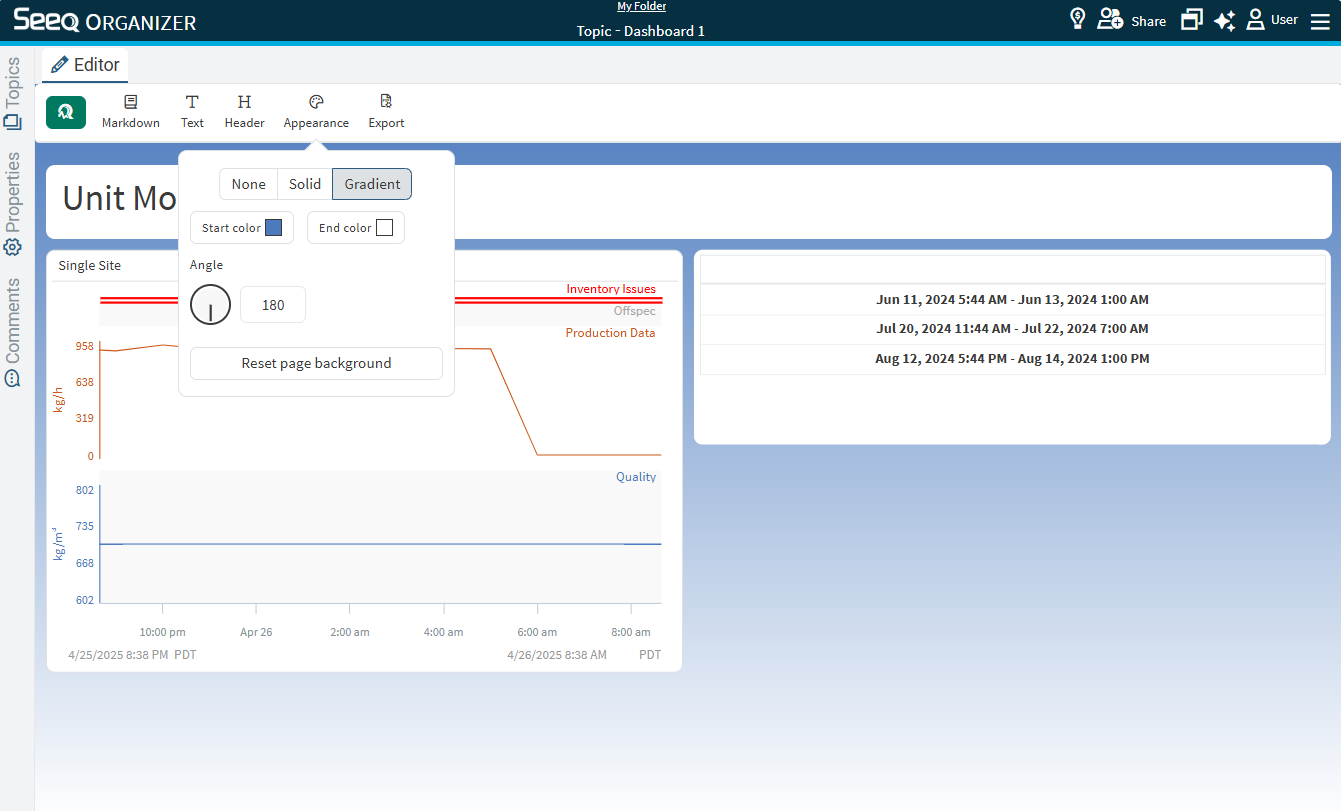
Modifying Background Colors
For personalization and more attractive dashboards to share with your colleagues, you can modify the background color of the Dashboard using the Appearance icon in the toolbar. Choose from None, Solid, or Gradient background, then select the colors desired from the color picker.
Each piece of content can also have a background color that is configured with the Appearance option in the content menu.
The Border color and thickness can be configured with the Border option in the content menu.