Signal from Condition
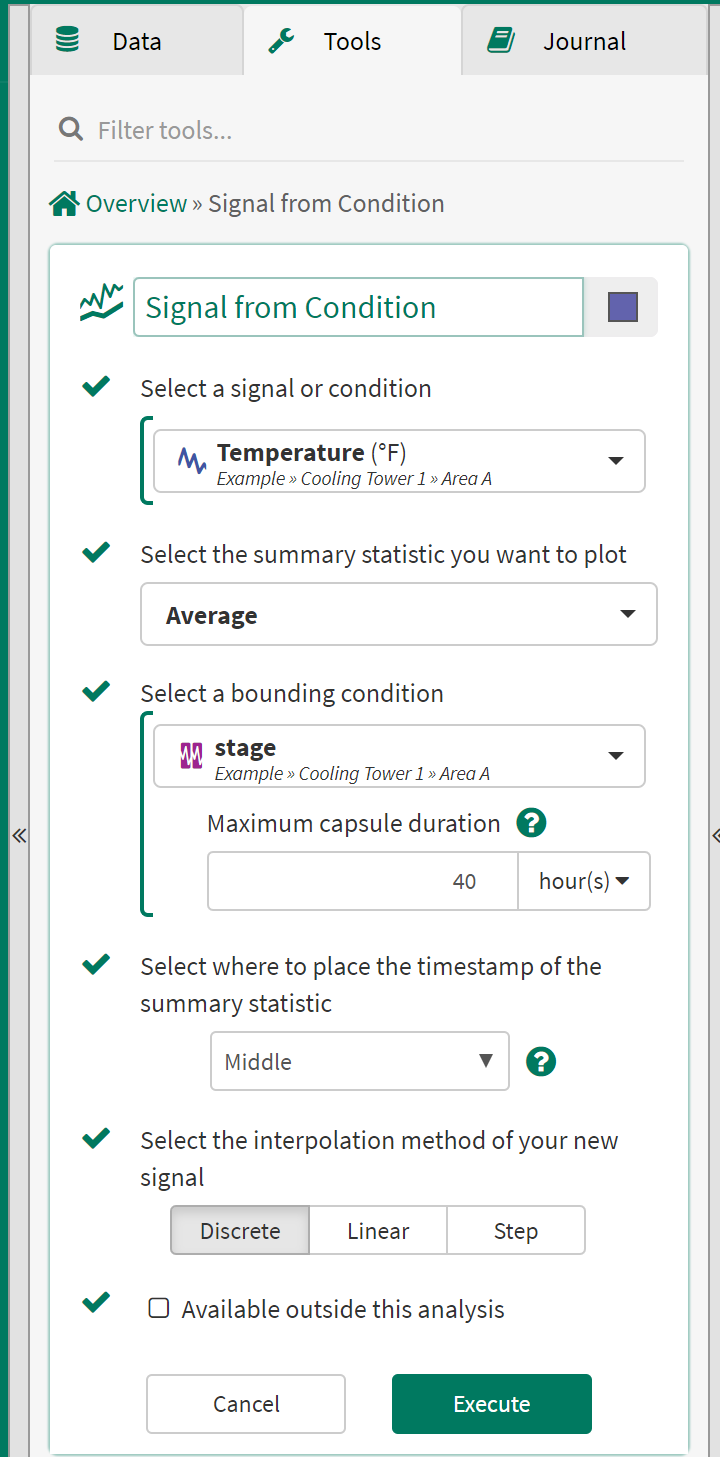
Signal from Condition enables users to create a new signal from statistical functions applied to a signal or condition when it is within another condition. One signal sample will be calculated per capsule for the new signal.
Using the Signal from Condition Tool
Examples Using Signal from Condition
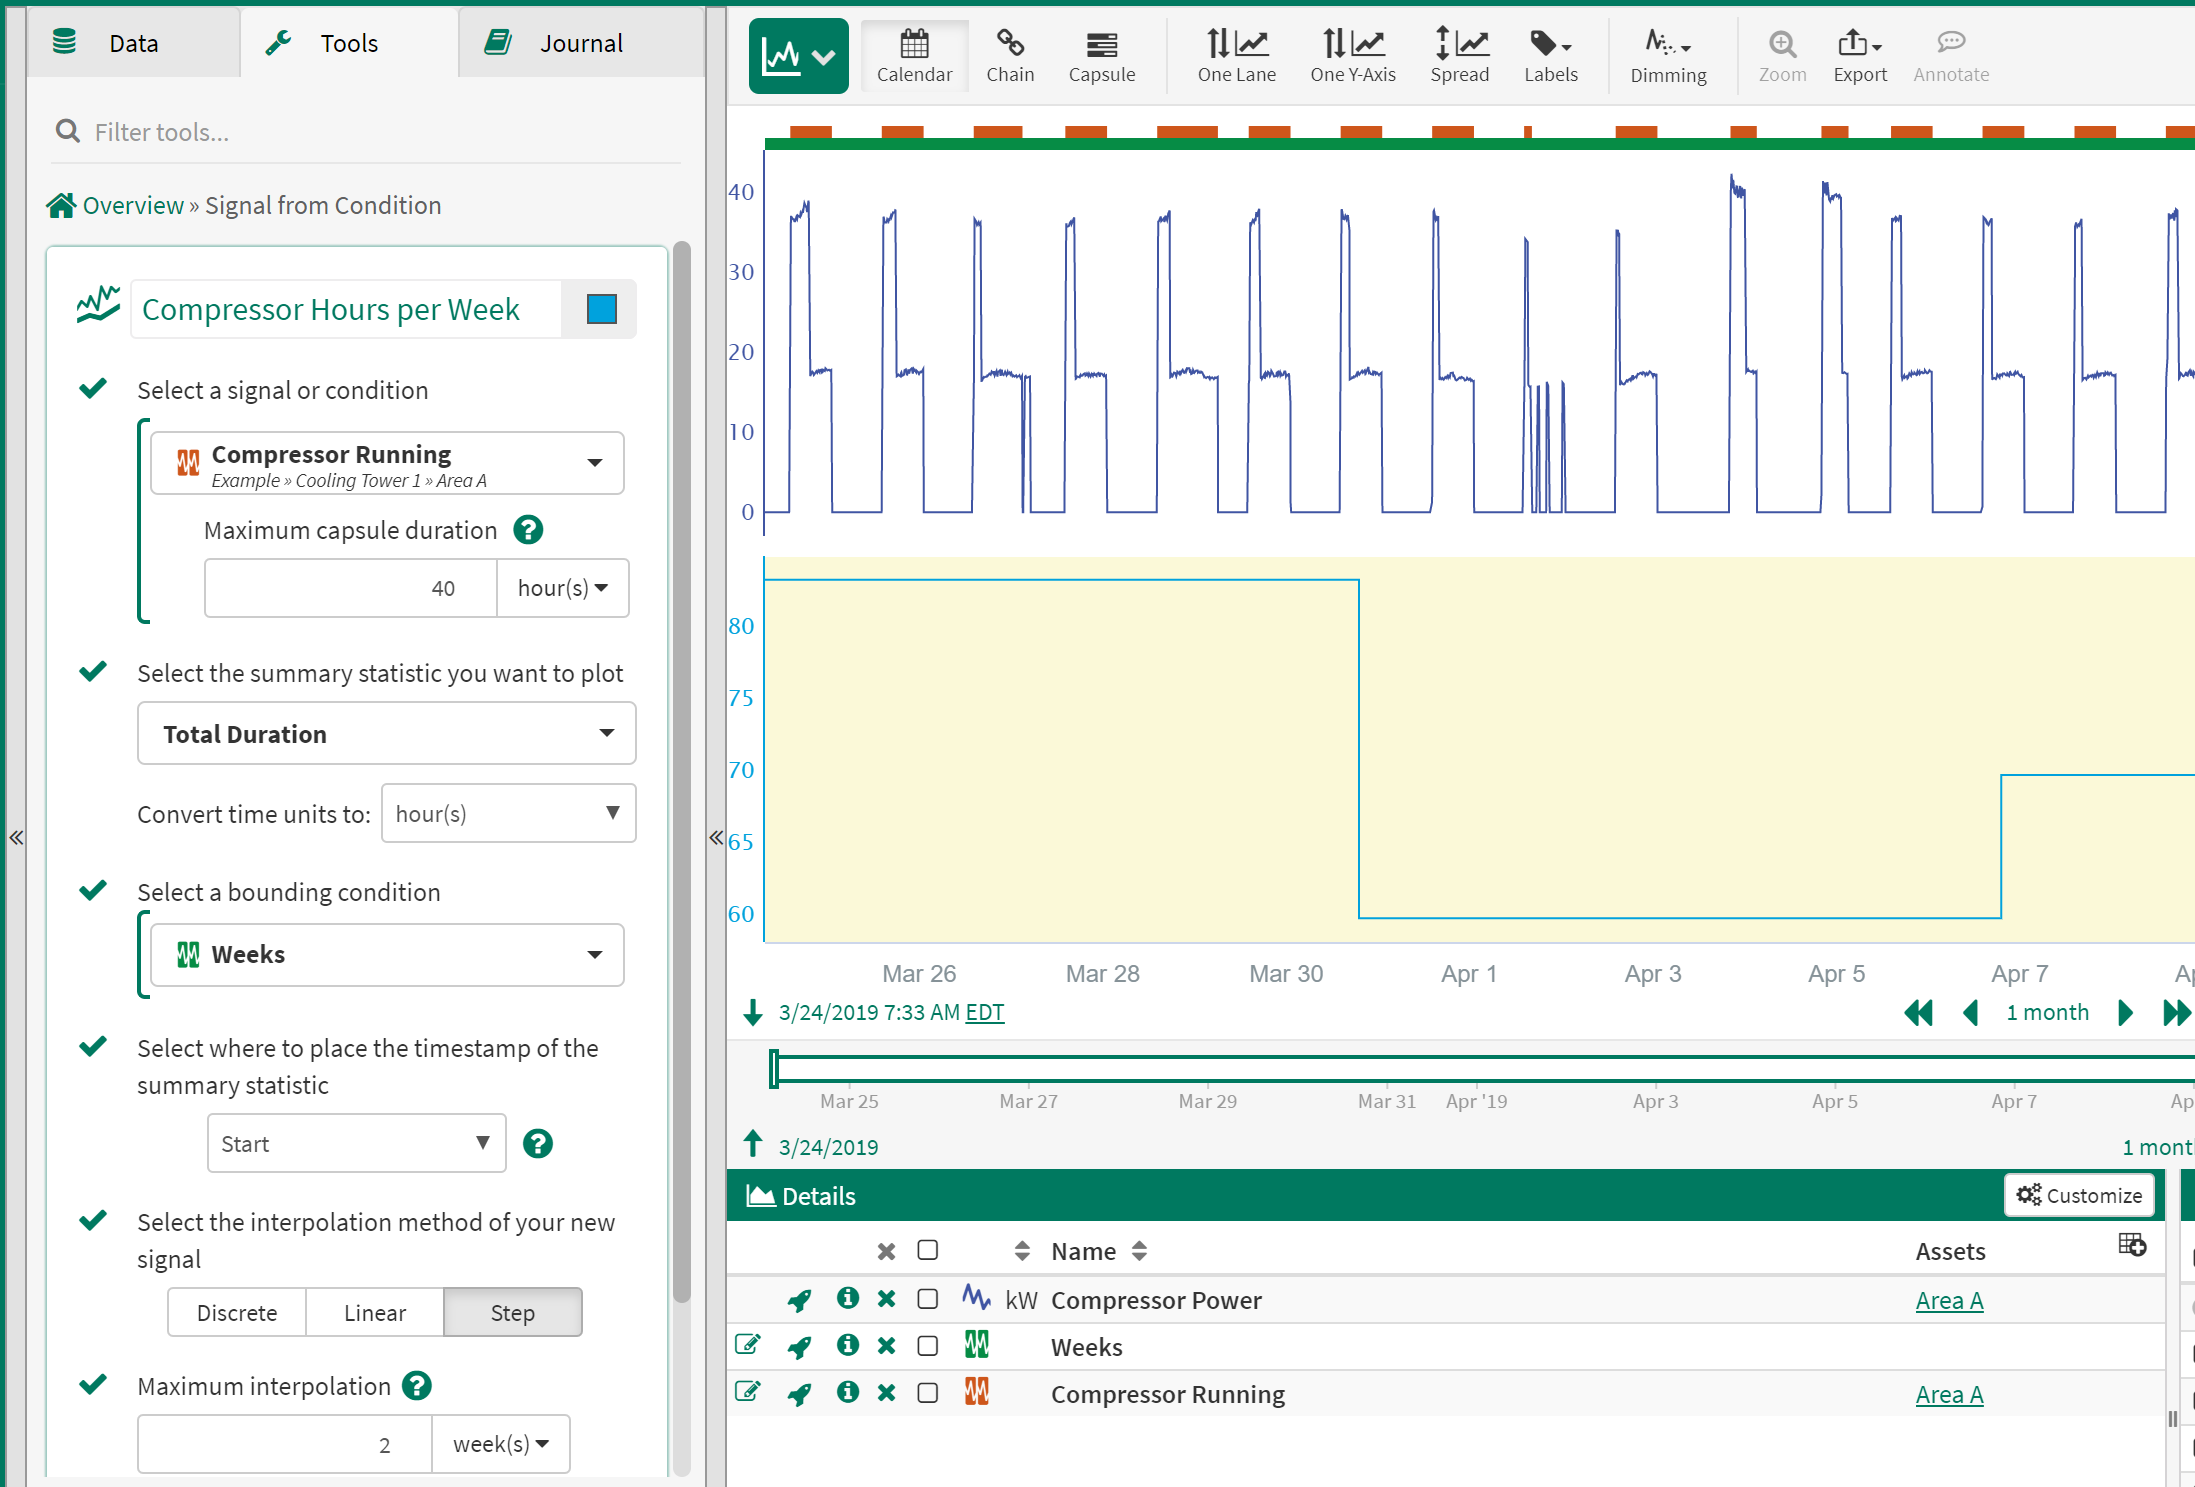
Calculate Equipment Run Hours per Week
Using the Value Search and other tools create a condition which captures when a piece of equipment is operating. Next, create capsules using the Periodic Condition tool which represent the time ranges you would like to aggregate over. For example, if you want to calculate run hours per day, create a daily condition. If you want to calculate run hours per week, create a weekly condition.
Selections in the Signal from Condition Tool
Select a Signal or Condition - Equipment running condition
Summary statistic - Total Duration
Convert time units to - Seconds/Minutes/Hours
Select a bounding condition - Time period condition
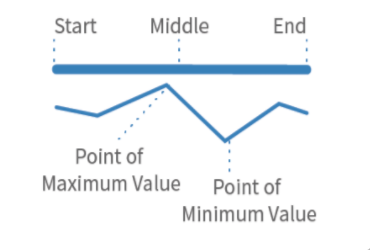
Select where to place the timestamp - Start (preferred selection for time aggregations)
Select the interpolation method - Step (preferred selection for time aggregations)
Calculate Equipment Run Hours per Week
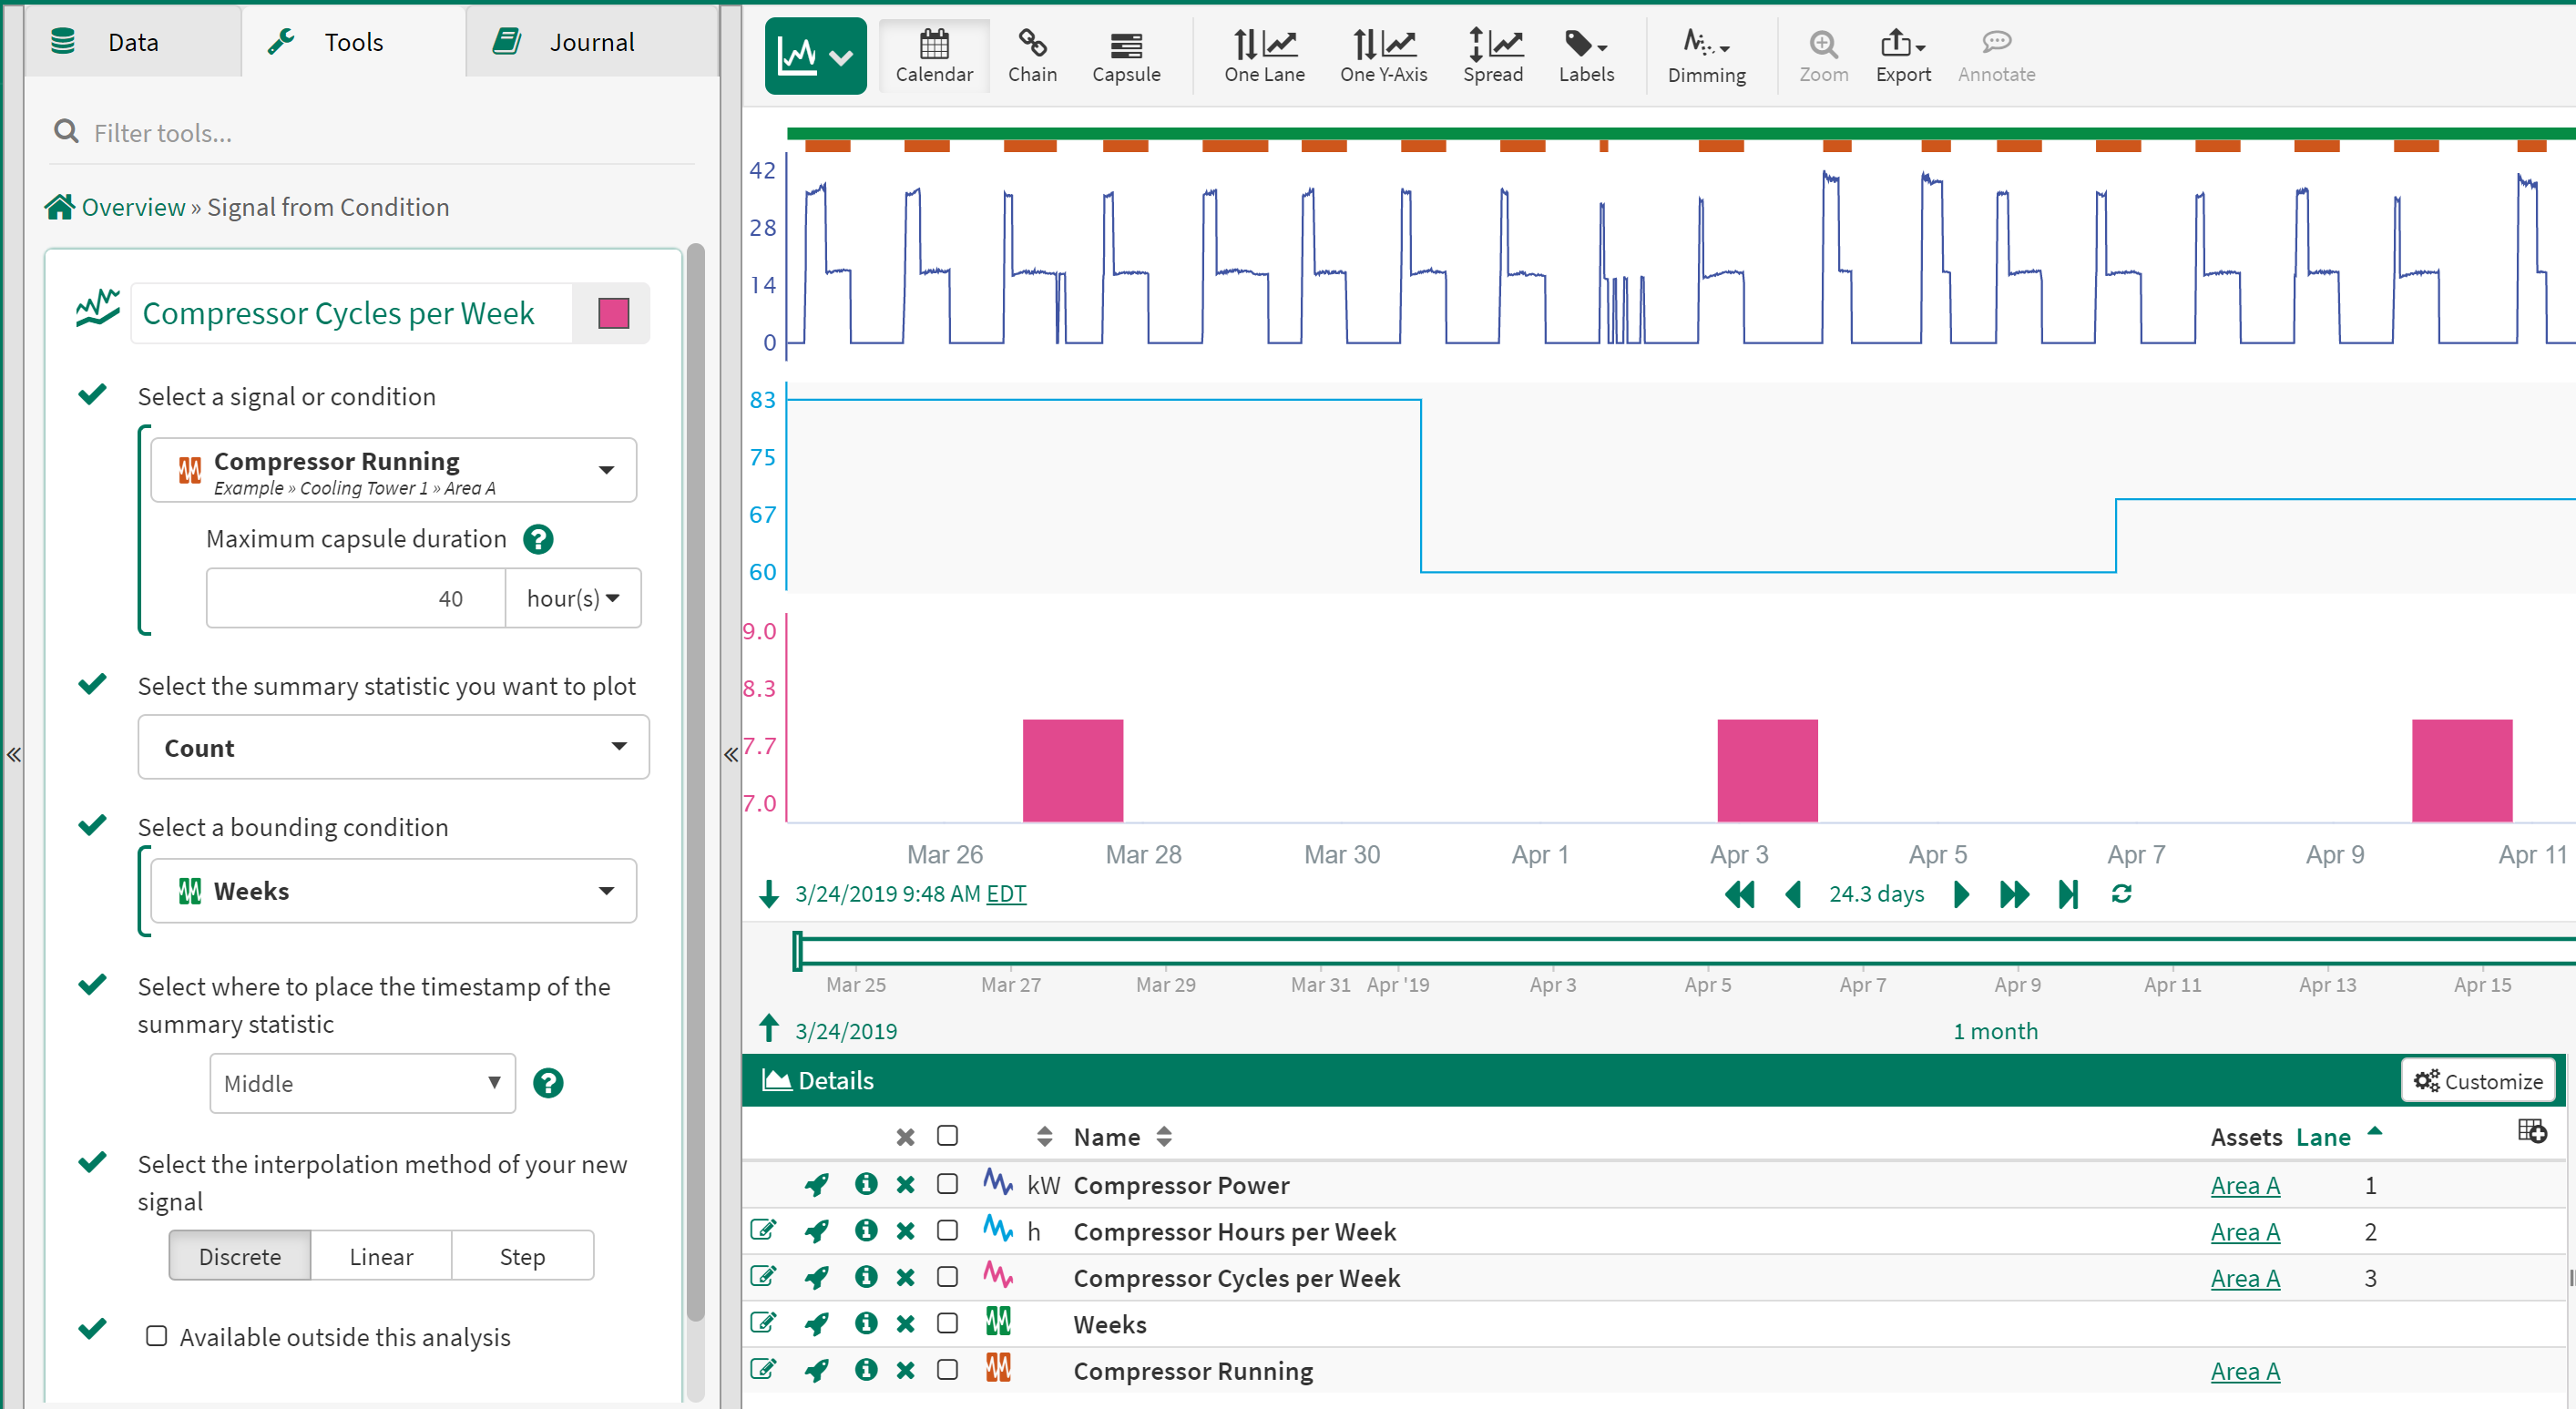
Calculate Equipment Cycles per Week
Calculate Equipment Cycles per Week
Using the Value Search and other tools create a condition which captures when a piece of equipment is operating. Next, create capsules using the Periodic Condition tool which represent the time ranges you would like to aggregate over. For example, if you want to calculate cycles per day, create a daily condition. If you want to calculate cycles per week, create a weekly condition.
Selections in the Signal from Condition Tool
Select a Signal or Condition - Equipment running condition
Summary statistic - Count
Select a bounding condition - Time period condition
Select where to place the timestamp - Middle (preferred selection for discrete interpolation method)
Select the interpolation method - Discrete (creates bar chart view)
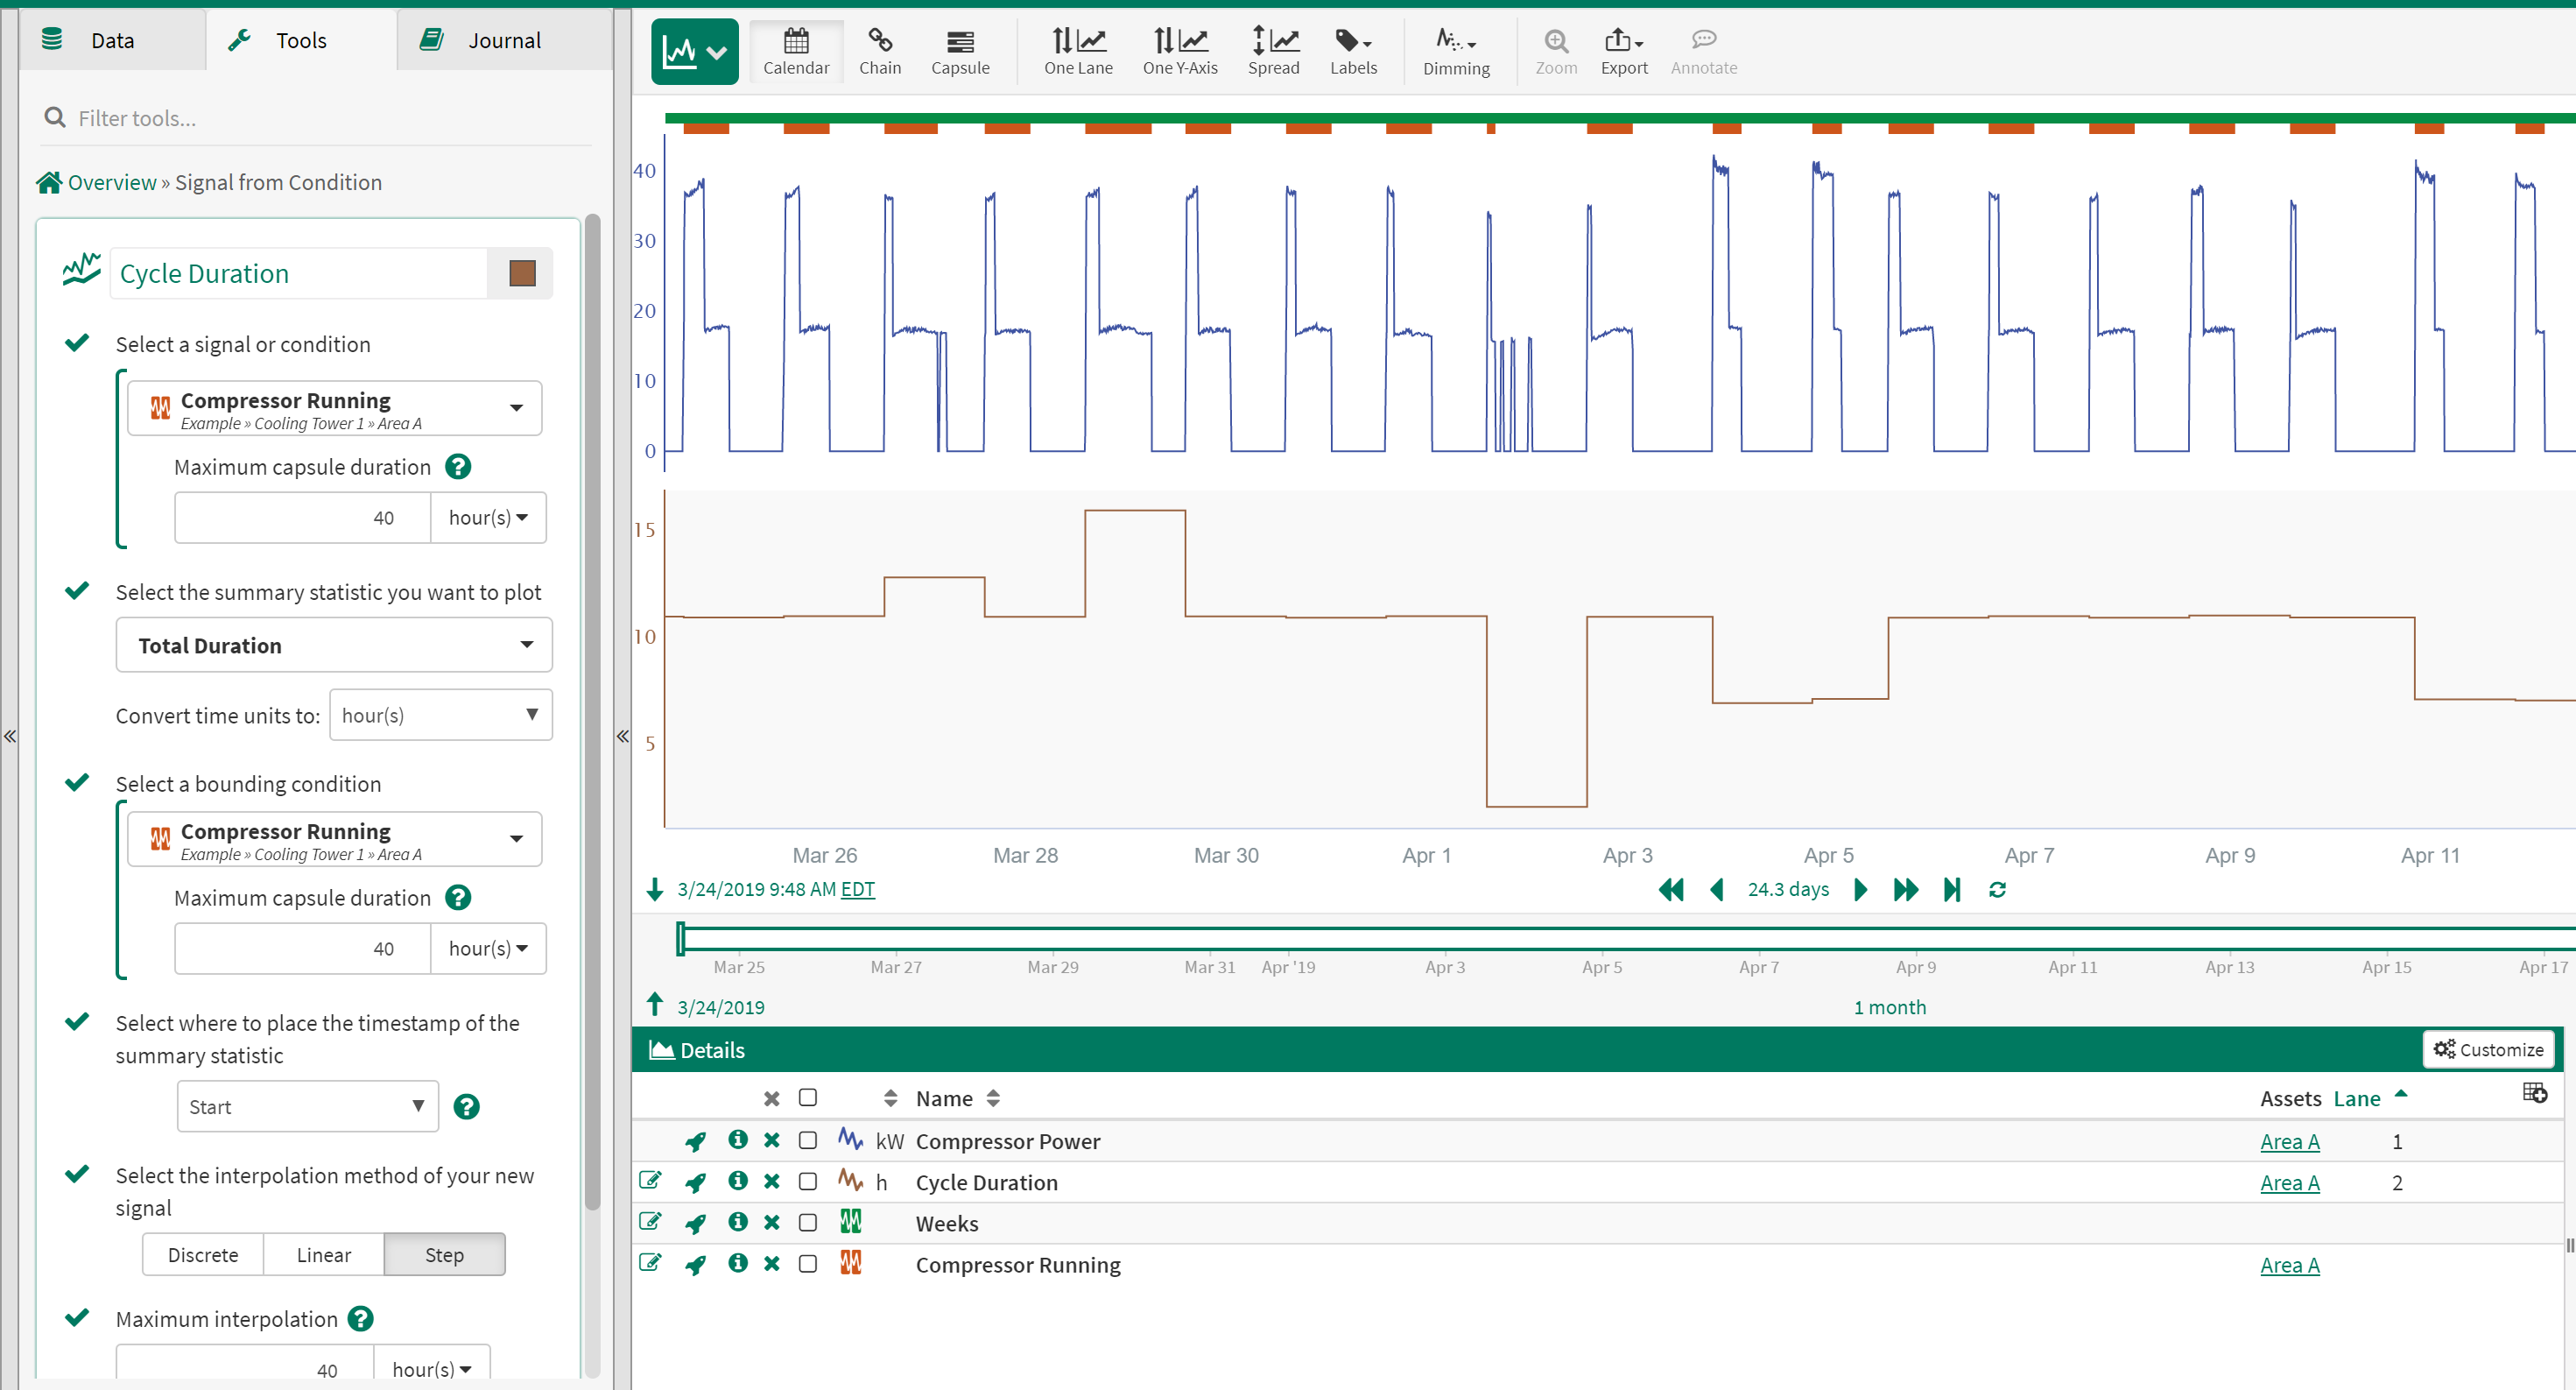
Calculate and Trend Cycle/Batch Duration
Using the Value Search or other tools create a condition which captures when a piece of equipment is operating or when a batch starts and ends.
Selections in the Signal from Condition Tool
Select a Signal or Condition - Equipment running condition
Summary statistic - Total Duration
Convert time units to - Seconds/Minutes/Hours
Select a bounding condition - Equipment running condition
Select where to place the timestamp - Start/Middle/End
Select the interpolation method - Step/Linear/Discrete
Calculate and Trend Cycle/Batch Duration
