Golden Batch Modeling - Reference Profile
Reference Profiles
Use the Reference Profile tool to create a profile of the expected behavior of a signal during a given period (such as start-up or production period). Golden profile calculations are often +/- standard deviation, but you can calculate average, min/max, max deviation, etc. as well, making this a flexible technique for boundaries and "centerline" modeling.
Objective
Create a golden batch/reference profile to find when the data goes outside the “typical” boundaries/profile of the given process.
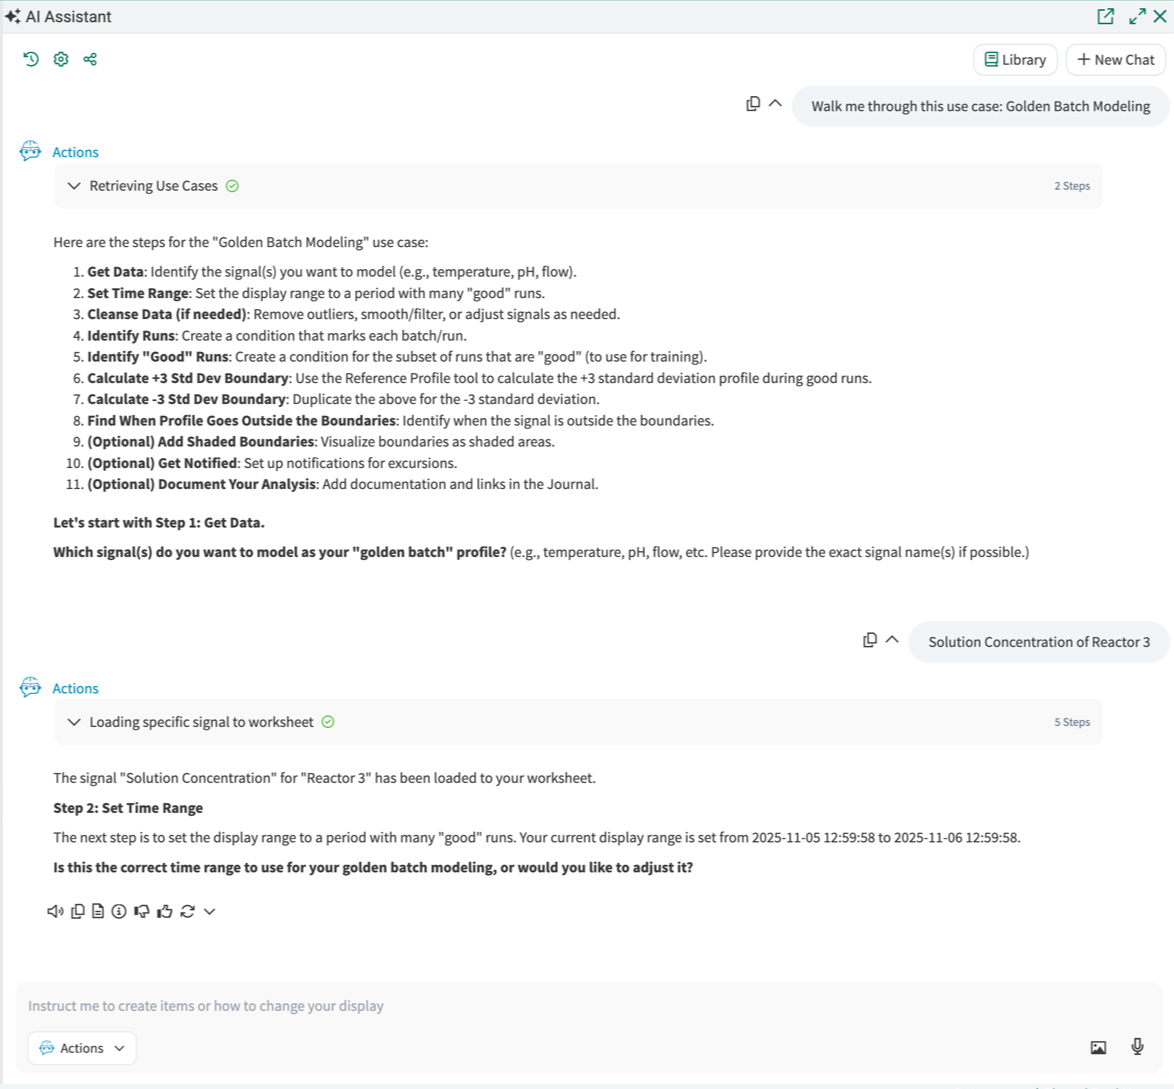
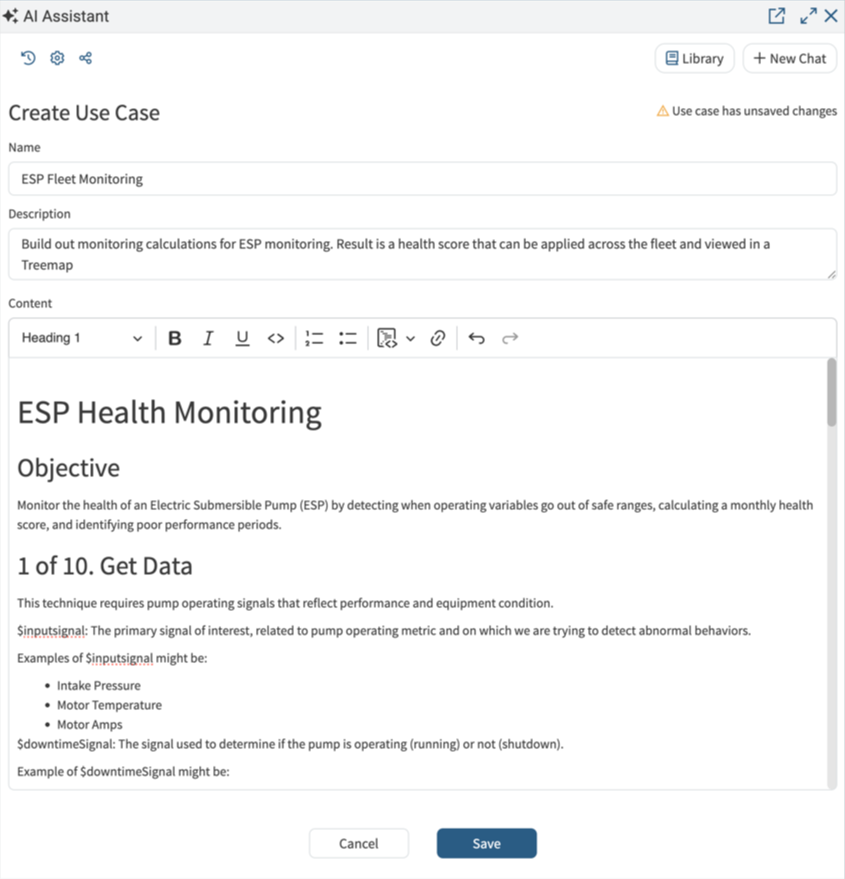
1. Get Data
This technique works on data that have a repeating or profile that should remain consistent in amplitude and , such as temperature in chemical batch reactions and distillation columns, pH in paper manufacturing, CO2 in fermentation batch reactions (food & bev), gas flow rate in Chemical Vapor Deposition (semiconductors), or Biomass growth (OD600) and dissolved oxygen in bioreactors.
2. Set Time Range
Set the display range to a period of "good" operation, when you had many batches/profile repetitions ("runs") that ran as they should.
3. Cleanse Data (if needed)
To build a linear forecast, Seeq will make an Ordinary Least Squares linear fit of the data (see regressionModelOLS() in the Formula documentation) and apply that equation going forward from "now" (it will update as "now" changes). To make a good fit, the data should not contain outliers, bad data, downtime, or other data points that could skew or bias the fitted line. So, consider cleansing the data first.
There are three main categories of data cleansing:
Get more info in the Skill Explorer if needed to identify what kind of cleansing you need, along with recommended Formulas and techniques, then try Actions Agent (or manual tools) to complete it.
4. Identify Runs
As shown in the picture at the top of this Journal, the first step is to identify the Runs (individual profiles). Common approaches include:
Use Value Search Tool on a status signal of some kind. (e.g. "Production" status, numeric status that indicates a run, etc.). Keep in mind that Value Search on text (string) data is case sensitive.
Ask AI! Describe how you would determine the start and end of a Run period, and ask it "How would you make a Condition that (....)". Start with the General or Formula Agents, or try Actions!
Use one or more of the common ways to identify a Condition shown in the Skill Explorer; you can flexibly also combine or adjust Conditions if you can, for instance, easily identify the start and end of production, but have trouble making a condition for the duration.
As a last resort, try the Profile Search Tool; Profile Search works better on more complex profiles.
5. Identify "Good" Runs
Identify "good" Runs, which will be used to calculate the golden/reference profile. (suggestion: name it "Good" or "Training" Runs)
Common approaches include:
Visual determination: Open the Manual Selection Tool and click on the "good" Run capsules at the top of the Display Pane to add them to the Manual Condition.
Try Capsule View (see toolbar at top of trend), which overlays all the capsules, to compare the profiles. This can help visually identify when signals deviate from the norm, or which ones might be more "normal" or consistent.
Use a run quality indicator, such as lab data, density, etc. to identify good runs. In Formula, try touches() or another condition combination function to combine the Runs and Good Quality conditions. Try AI Formula or Actions Agents!
Note: you do not have to make a “Good” condition over which to train the boundaries; you can simply train during the "training window" defined in the tool.
How many runs do you need to train over?
It can vary; get as many as you can during operations that mimic what current operations "should" be.
Broadly, training the golden profile with runs that are more "dissimilar from each other" will make the +/- 3 Std Dev boundaries wider or less "strict," as the std deviation will increase.
Training with more similar/tightly controlled runs will result in narrower boundaries, and, when you apply those boundaries to data, you may see more deviations (excursions outside the boundaries).
Iteration is key in training boundaries; you may make the "Good Runs" condition, train the boundaries, find deviations, and then go back and tune the "Good Runs" condition to be more or less strict as needed based on the deviations.
6. Calculate +3 Std Dev Boundary
The +3 Standard Deviation is often used as an upper golden profile. We will use this statistic here, but you can also use other statistics (see "Reference statistic" chooser in the Reference Profile tool).
Use the Model & Predict > Reference Profile Tool to calculate the +3 Standard Deviation of your profile data during the Good Runs condition.
Reference Profile inputs:
Name: +3 Std Dev - (profile data name)
Input Signal: your profile data
Input Condition: Good Runs
Training Window: choose a training window that contains all the capsules of the training condition that you want to include in the calculation. In general, the current Display Range should be used as the training window, since the user previously set it to show the desired selection of Good Runs.
Gridding: as appropriate for your data; longer gridding times will make a smoother profile. If not specified, default to 5 minutes.
Statistic: Standard Deviation
Multiplier: 3
Apply to Condition: Runs (this will apply the +3 Std Dev to ALL Runs capsules, even those outside the current time range).
Put this +3 Std Dev - (profile data name) signal on the same lane and axis as the original signal.
7. Calculate -3 Std Dev Boundary
Duplicate the +3 Standard Deviation and calculate the -3 (instead of +3) Standard Deviations of the original profile data during Good Runs.
In the Details Pane, by +3 Std Dev - (profile data name) created above, click the three-dot icon, then the Item Properties icon.
Use the Duplicate button at the bottom of the panel.
Change the Name to -3 Std Dev - (profile data name)
Change the Multiplier to -3 instead of 3.
Put the -3 Std Dev - (profile data name) signal on the same lane and axis as the original and +3 Standard Deviation signals.
Select Chain view to see just Production Runs and boundaries with no intervening data, then Capsule view to overlay capsules.
8. Find When Profile Goes Outside the Boundaries
Ask Actions Agent: Find when (profile data signal) is outside the (+ and - 3 StdDev boundaries).
Insert the actual names of these signals.
Use the Identify > Value Search tool and the "not between" operator.
Note: you do NOT have to visualize boundaries in any particular way in order to find when the signal goes outside the boundaries (using Value Search); as long as you have the signal and the boundaries (which can be calculated using Reference Profile, Formula, or brought in from your historian), you can use Value Search alone.
But folks often like to use the visualization techniques below to better monitor their batches/runs.
9. (Optional) Add Shaded Boundaries
Visualize the standard deviation profiles as shaded boundaries. This must be done in the Scorecard Metric Tool; there is no Formula shortcut. As the actions agent you are not able to create Scorecard Metrics on behalf of the user; help them do this themselves with the following inputs:
Open Scorecard Metric: From the tools panel, open a new Scorecard Metric. This tool will help you visualize the boundaries as shaded areas.
Configure the Scorecard Metric:
Name: Give your scorecard metric a name, such as "Shaded Boundaries."
Type: Choose "Simple" for the type.
Item to Measure: Select your original profile data signal.
Statistic to Measure: Choose "None" since you are focusing on visualizing boundaries.
Thresholds: Add the +3 and -3 standard deviation signals as thresholds. You can do this by clicking "Add Threshold," selecting a threshold color, and then using the "Switch to item selector" button to choose the standard deviation signals.
Return to Calendar or Chain View (if not there already) to see the shaded boundaries on the trend.
10. (Optional) Get Notified
Add an email notification for the Outside the Boundaries condition (step 8).
Note: Notifications are only available for SaaS customers.
Notes:
Seeq will check the condition for a new capsule every 15 minutes (Admins can change this check interval). When a new capsule is detected, an email will be sent out.
You can view the last seven days of your notification history. Click on your name at the top right > Notification History.
Tip: Look in the Capsule pane for the Start Date (when maintenance is needed).
11. (Optional) Document Your Analysis
AI can help you add documentation or links in the Journal.
NOTE: This action is able to traverse entire calculation hierarchies. So, if you want to document an analysis, be sure at a minimum your highest-level calculations are in the Details Pane when you call this action.
Tell Actions Agent:
Add a summary of my analysis to the journal, including links to each step within the analysis. At the bottom, include a table with all items that were a part of the analysis. Include their direct links in addition to the table.