Scatter Plot Selection Tool
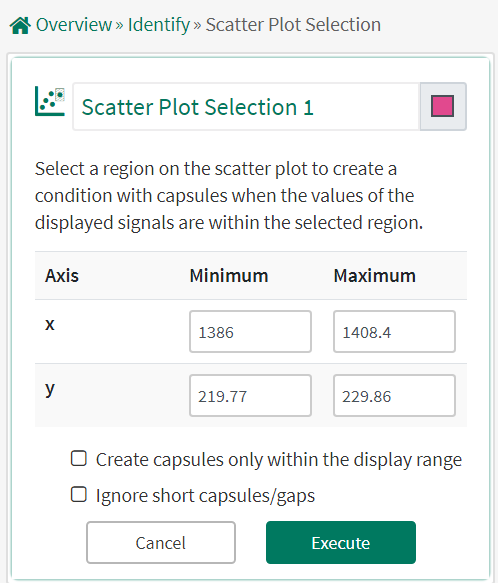
The Scatter Plot Selection tool allows users to create a new condition from a region selected on the scatter plot. The condition created will have capsules when the values of both of the plotted signals are inside the selected region.
Using the Scatter Plot Selection Tool
Selecting a Region on the Scatter Plot: Plot two signals on the scatter plot, then click and drag to select a region of interest. Click the Condition button in the toolbar (outlined in red) to open the Scatter Plot Selection tool, or navigate to the tool in the Tools pane. The minimum and maximum x and y values of the selected region appear in the tool's input boxes.
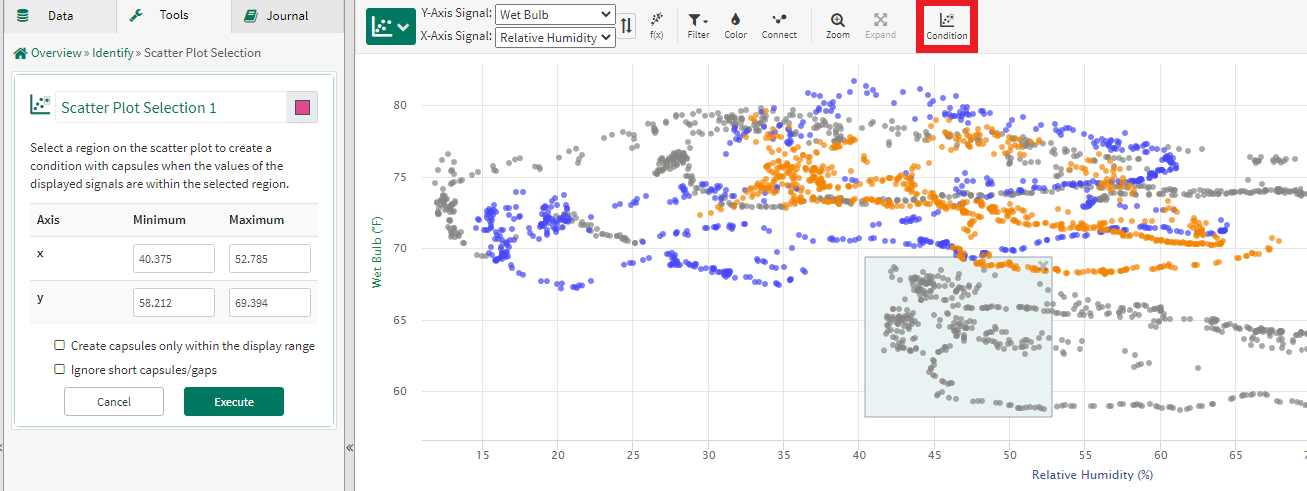
Manually Specify Values: You can also manually specify the minimum and maximum x and y values for the selected region. Typing new values into the boxes in the tool will update the region selected on the scatter plot.
Create capsules only within the display range: If this box is checked, the condition will only contain capsules within the display range. If the box is not checked, the condition may contain capsules outside the display range.
Ignore short capsules/gaps: Eliminate capsules or gaps shorter than the specified time periods. Note that if you ignore short capsules, then the condition may not contain all samples within the selected region, while if you ignore short gaps, the condition may include some samples outside of the selected region.
Execute: Clicking Execute will create the condition based on the selected region.
Example Uses
You see unexpected outliers when viewing two signals on the scatter plot. You create a condition representing that region of the plot, and use it to highlight these time periods in Trend View to investigate other signals and possible causes of aberrant behavior.