Tables & Charts
See statistics and KPIs in table form for the whole display range (Simple Table) or each capsule in a condition (Condition Table) in a Table View. Tables can be used to create a variety of other charts for visual comparison or display in Organizer Topics. See Displaying Signal or Capsule Properties and Statistics for configuring tables in the Details and Capsules Panes while working with data in Workbench.
Basics
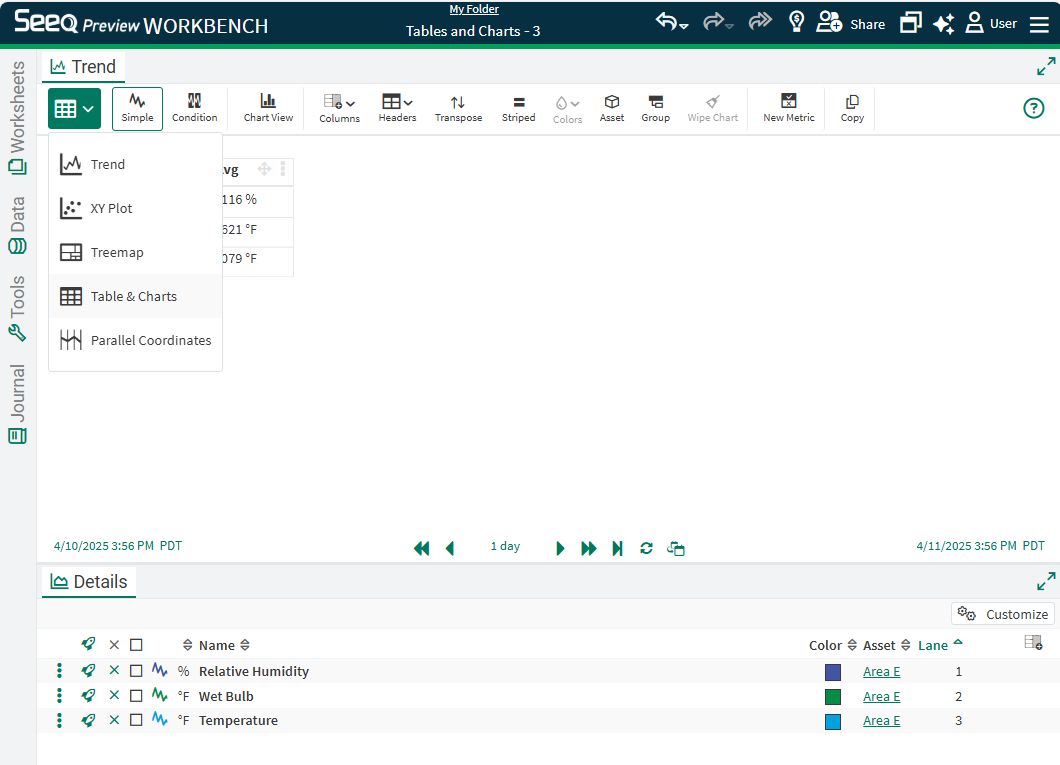
To enter into Tables & Charts View, click the mode button in the upper left corner followed by the Tables selection.
There are two types of supported Table views: Simple Tables and Condition Tables.
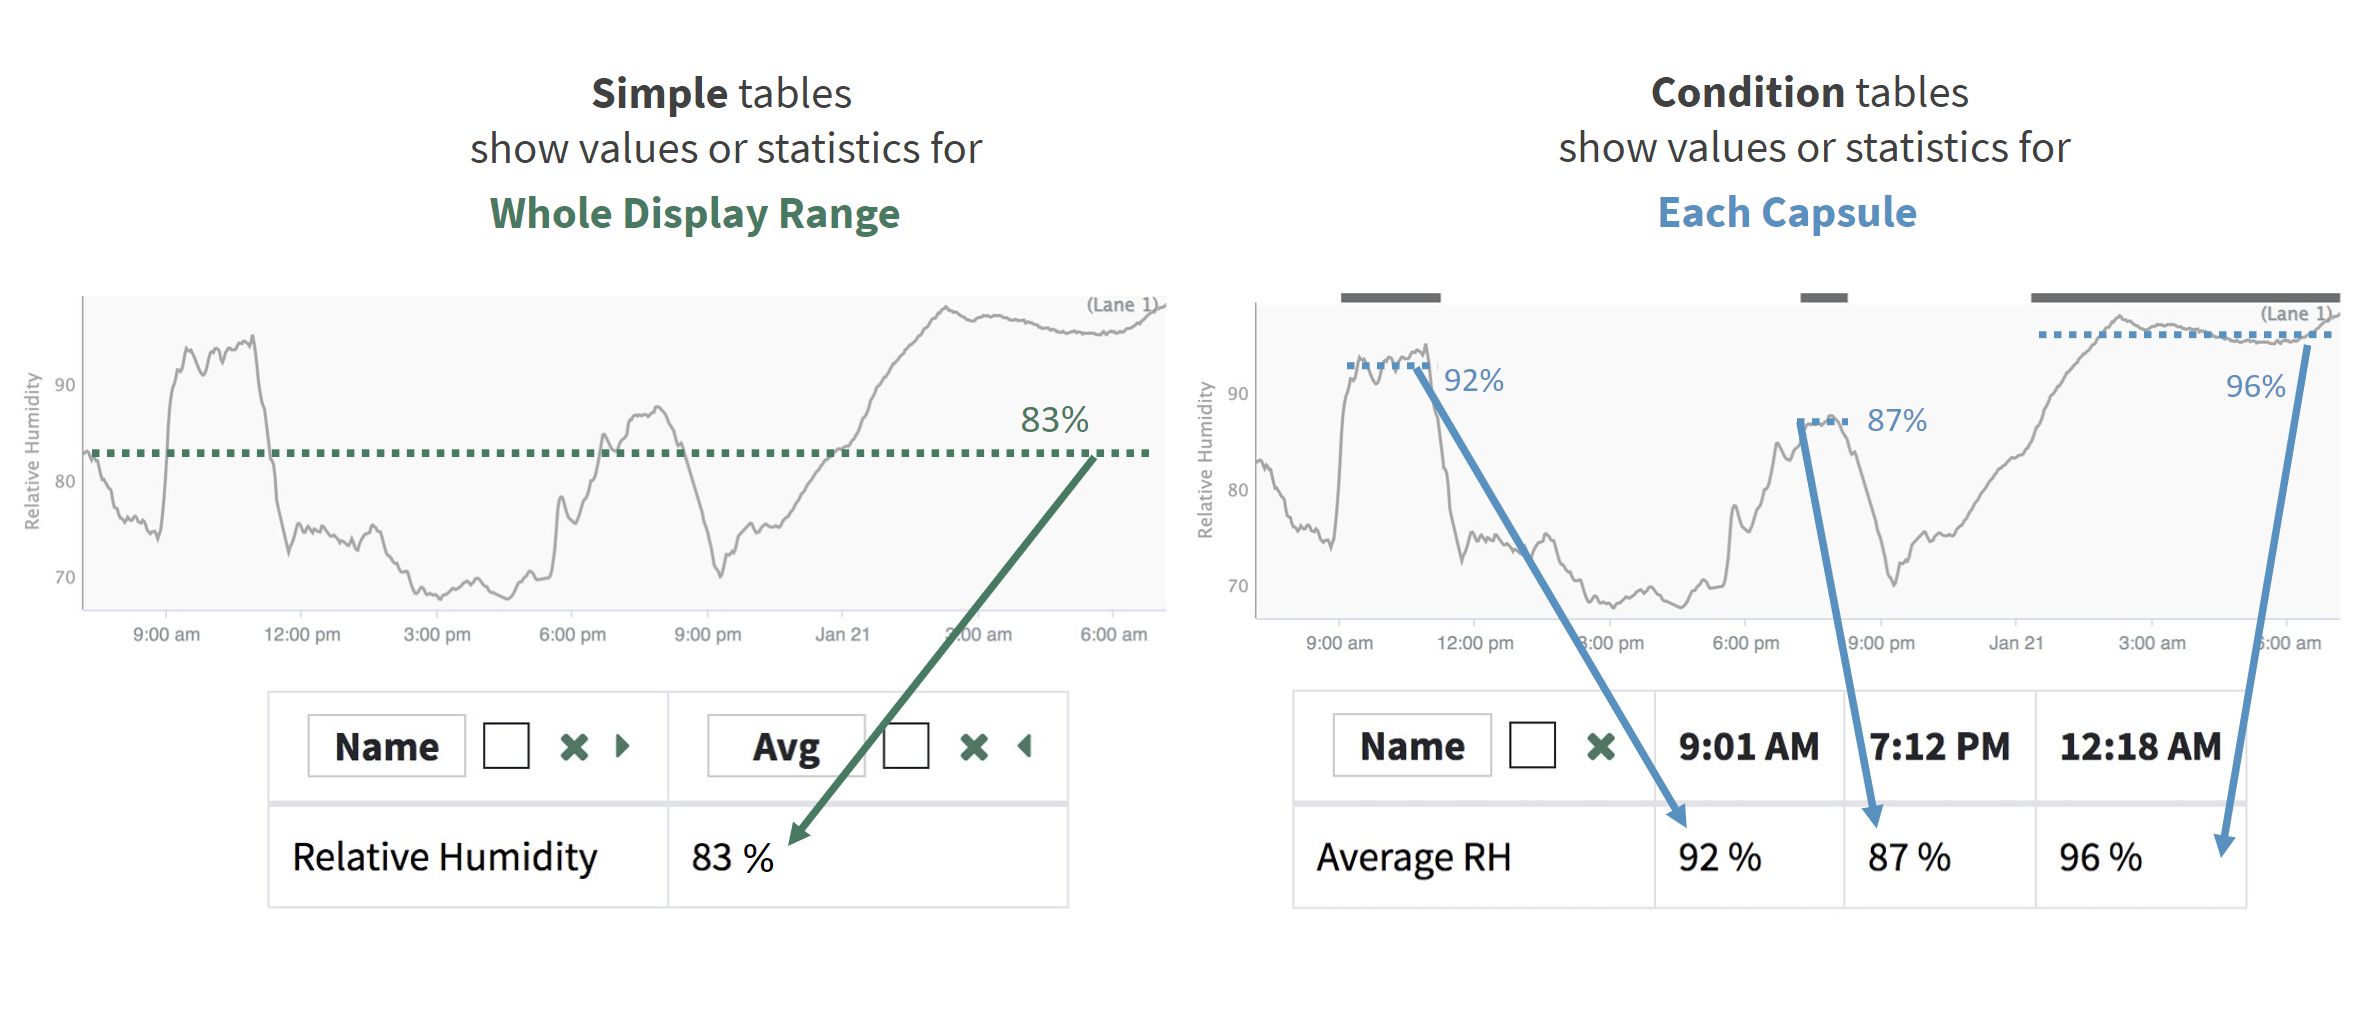
Simple tables show values or statistics over the entire Display Range. Condition tables show values or statistics for each capsule present in the Display Range.
For Simple Tables, control which signals or conditions are displayed with selection in Details Pane.
Default ordering is set by Details Pane ordering. Reorder lanes or sort in Details Pane to change order of items displayed in the Table.
Transpose or apply zebra striping for readability with buttons in the Toolbar. Condition tables will default to Transpose on so that the conditions appear down the display instead of across, but this can be changed when desired.
Sorting
Both table views support multiple column sorting. Apply a sort order using the options accessed from the three dot menu on each column or row as appropriate. As each new sort is applied, it takes precedence over the other sorts. Clicking the icon at the top of the table indicating sorting has been applied will reverse the sort. Remove the sort from the three dot menu.
The sort is applied to the values in the cells without considering the unit of measure column, so 100 degC will appear lower than 150 degF when sorting descending.
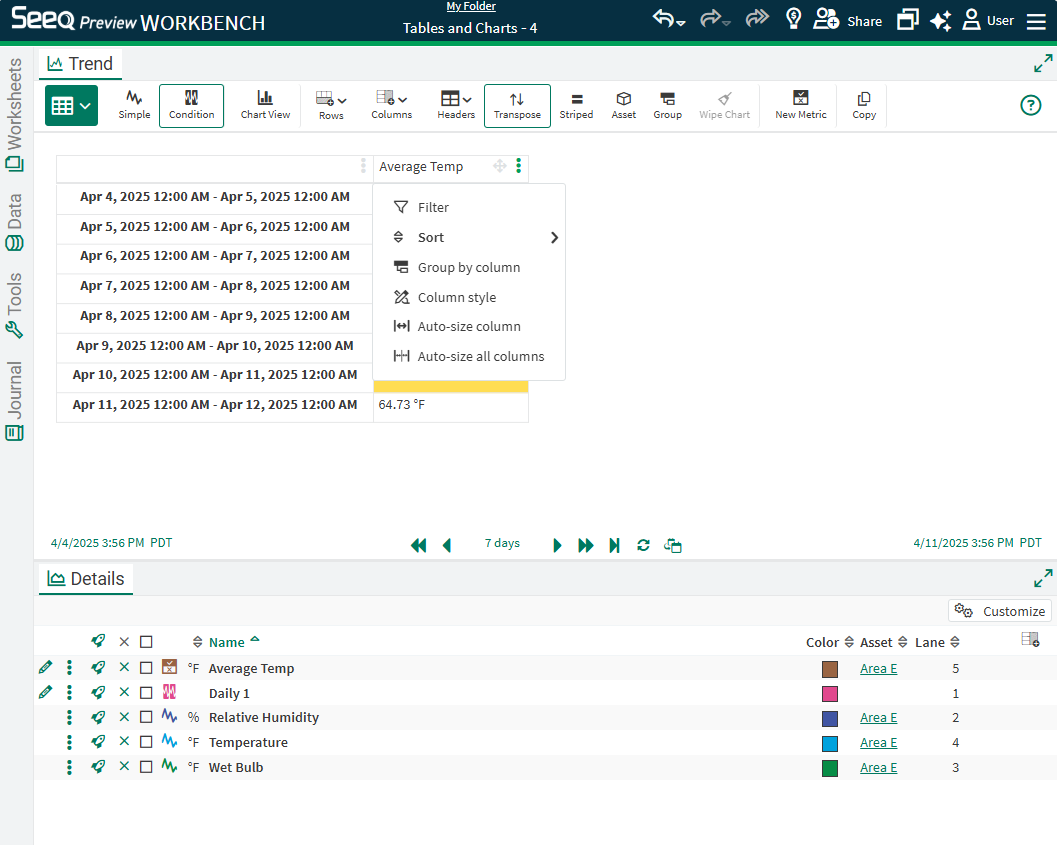
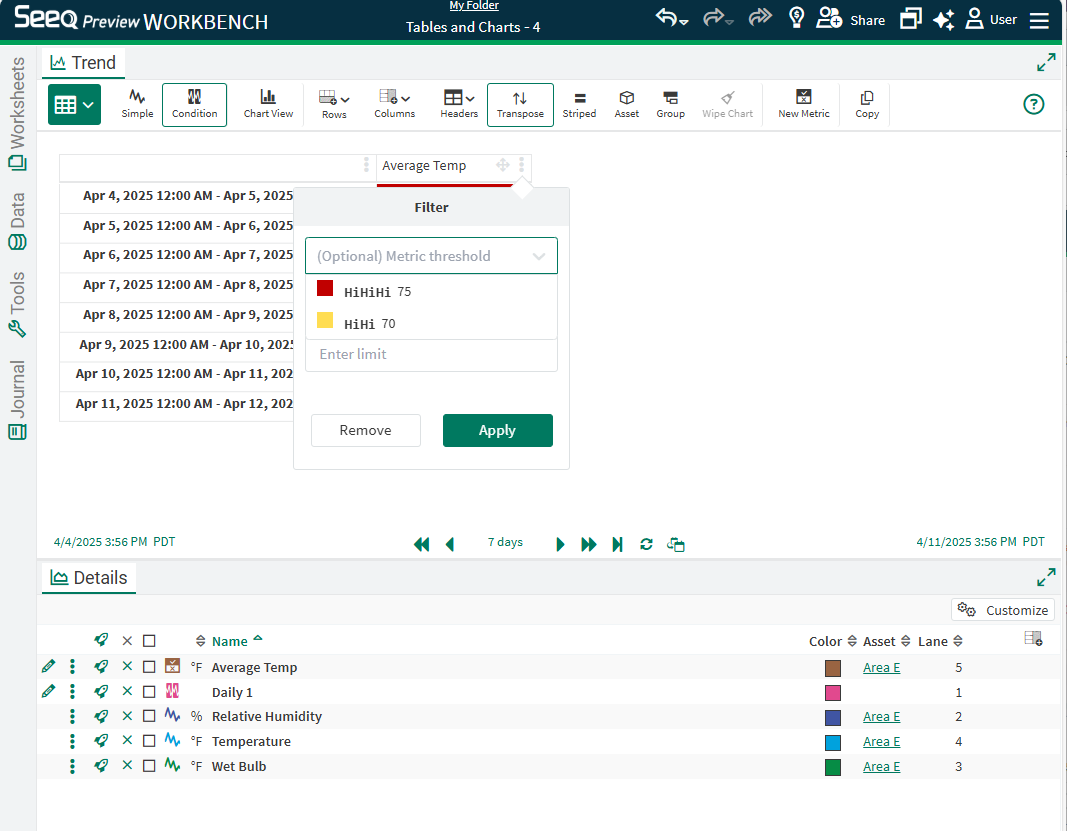
Filtering
Where Metrics are present, optionally use the Metric thresholds to filter the data. Otherwise, select the appropriate numeric logic and enter a number below to filter.
When a string column is selected, filter by match or does not match with corresponding text or regular expression.
Text filters will generally provide a pick list to select which text to consider based on the logic selected (match or not match). There are a few instances where text pick lists may not be available. In each of these scenarios, the regular expression or clear text filter will still work. Current limitations include:
Filtering the asset column of a condition based tables taken across assets where the condition is not asset based (a daily condition reflected across assets).
Filtering a condition based table displaying a metric by the Value column of the underlying condition
Value (Original).The data type must be consistent in the column for filtering to work.
Grouping and Aggregating
Grouping and aggregations is now possible in order to roll up any individual column over the grouped rows and provide a higher level summary.
Enable grouping mode with the Grouping button in the toolbar. If the Grouping button is disabled, transpose the table in order to use grouping.
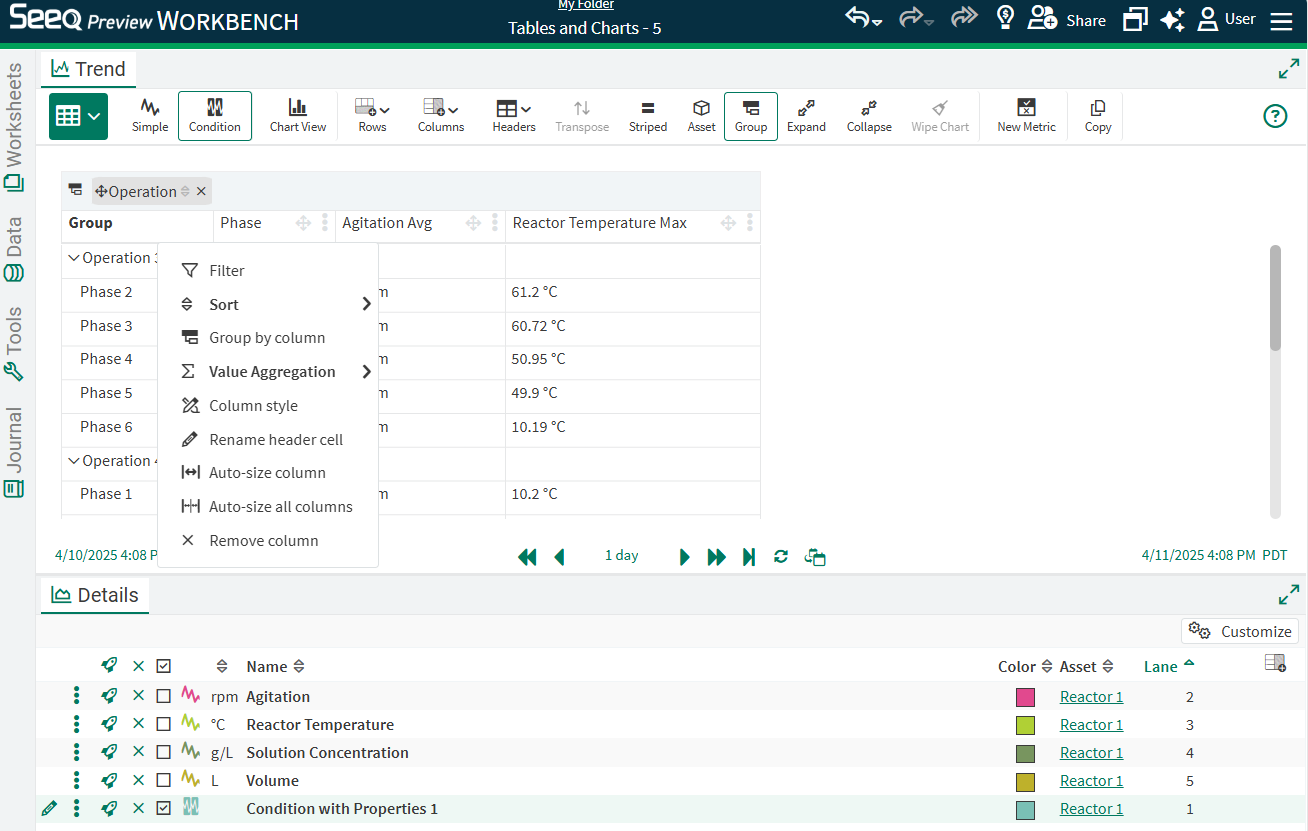
When grouping is enabled, drag any column header into the area above the table, or select “Group By” in the dropdown for each column’s three dot menu.
All rows that are grouped will automatically collapse but can be expanded. The order of grouping can be changed by dragging the grouped names in the shaded region above the table. Remove grouping by disabling the Group button or removing each grouped column name in the shaded region.
Aggregations in Grouped Tables
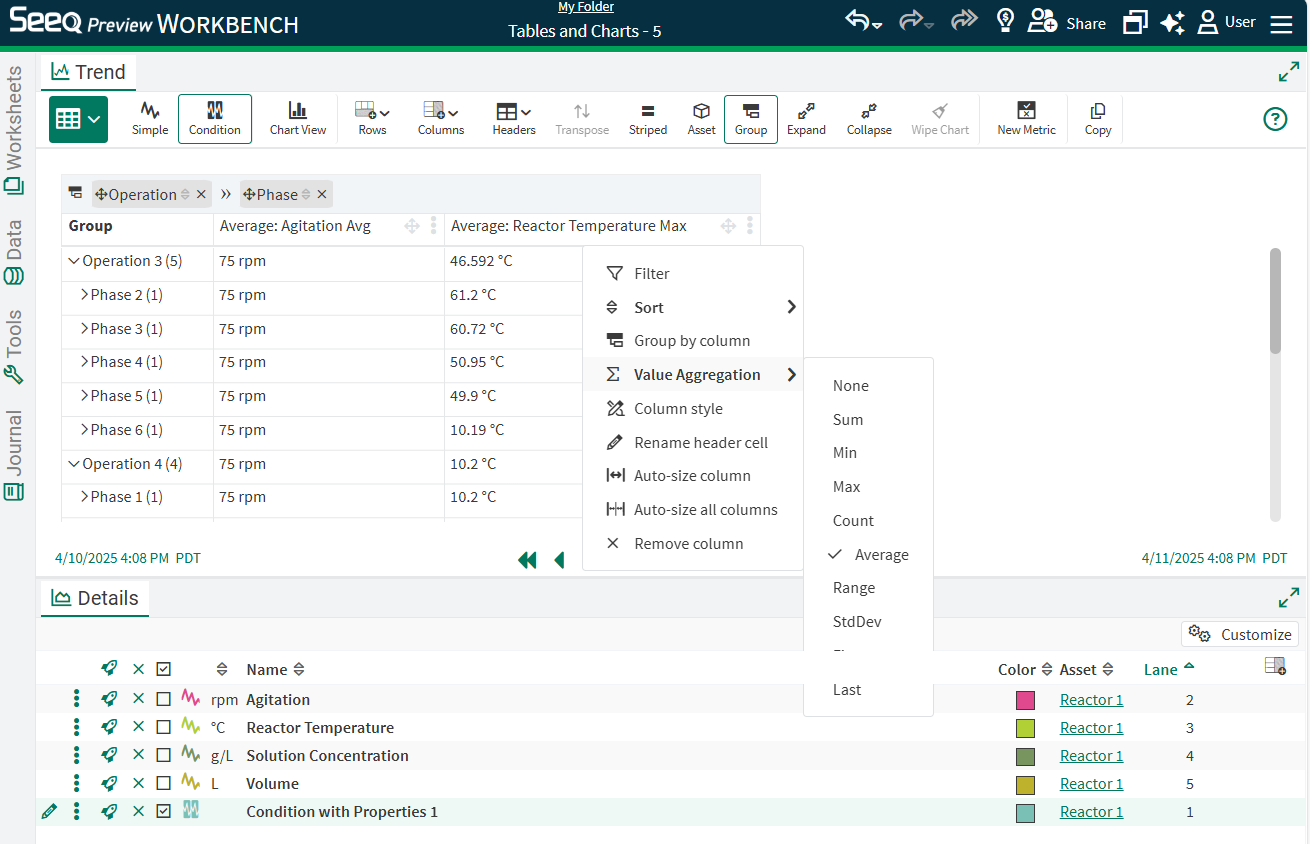
When grouping has been applied, navigate to another column and select the three dot menu. Find Value Aggregation in the list and choose which aggregation you would like to apply to that column of grouped values. The column header will automatically change to reflect the aggregation applied in addition to the name of the column. The user can change the name of the column but not the text indicating which aggregation has been applied.
Supported aggregations include Sum, Min, Max, Count, Average, Range, Standard Deviation, First and Last. The standard deviation is calculated as if the table represents the whole population.
Applying any filters to any columns will remove those entries from aggregated results as they are no longer shown in the table.
To remove the aggregation, use the three dot menu and select None in the Value Aggregation slide out.
Aggregations are not yet supported in Chart Views.
Formatting
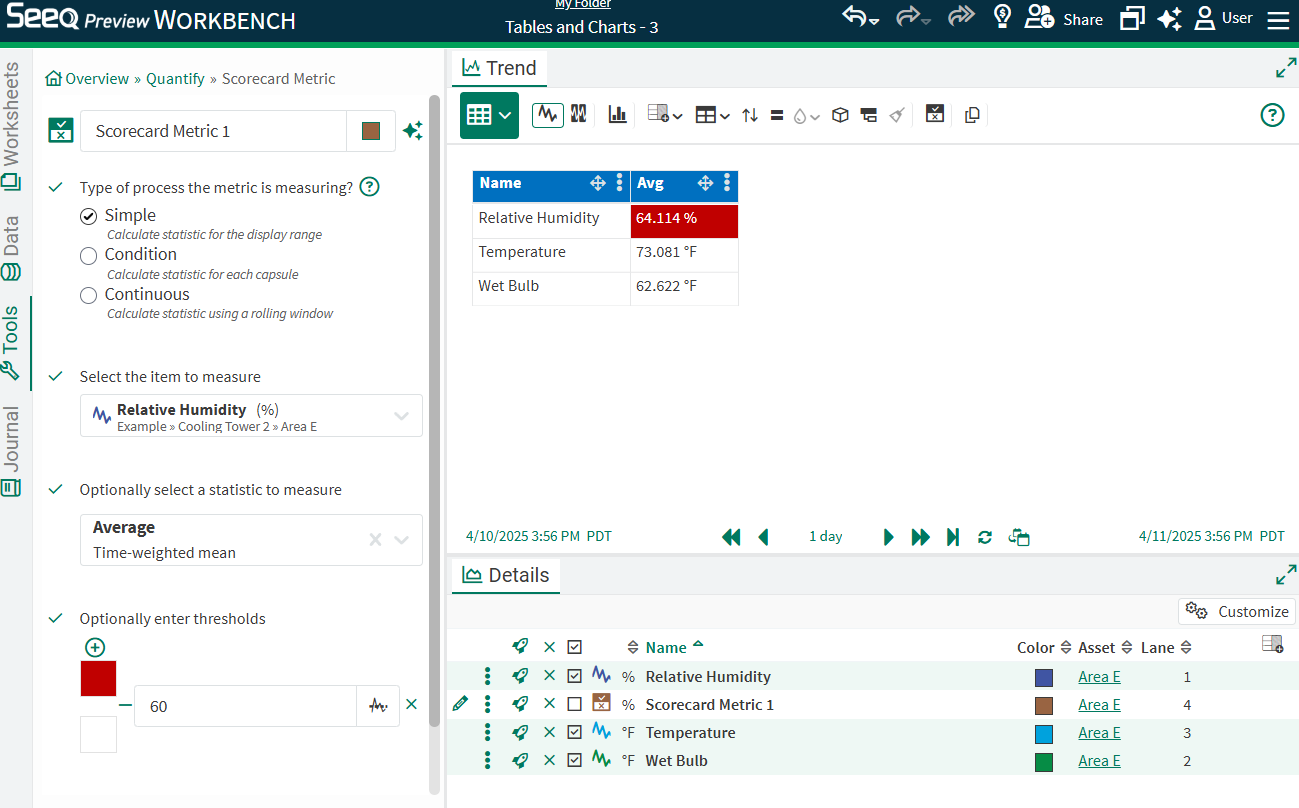
To color a cell by its value, use Scorecard Metrics. Simple Metrics will color cells in Simple Tables and Condition Metrics will color cells in Condition Tables.
Other formatting can be applied to headers or row styles like cell and font color, alignment, bold or italicized. After editing one header style, you can apply to all or apply to select headers. This can help you create better looking tables to match desired formatting in Organizer Topics.
In R65 and later, columns in both Simple and Condition Tables have font style and alignment options when you select Column Style from the three dot menu of each column.
Simple Tables
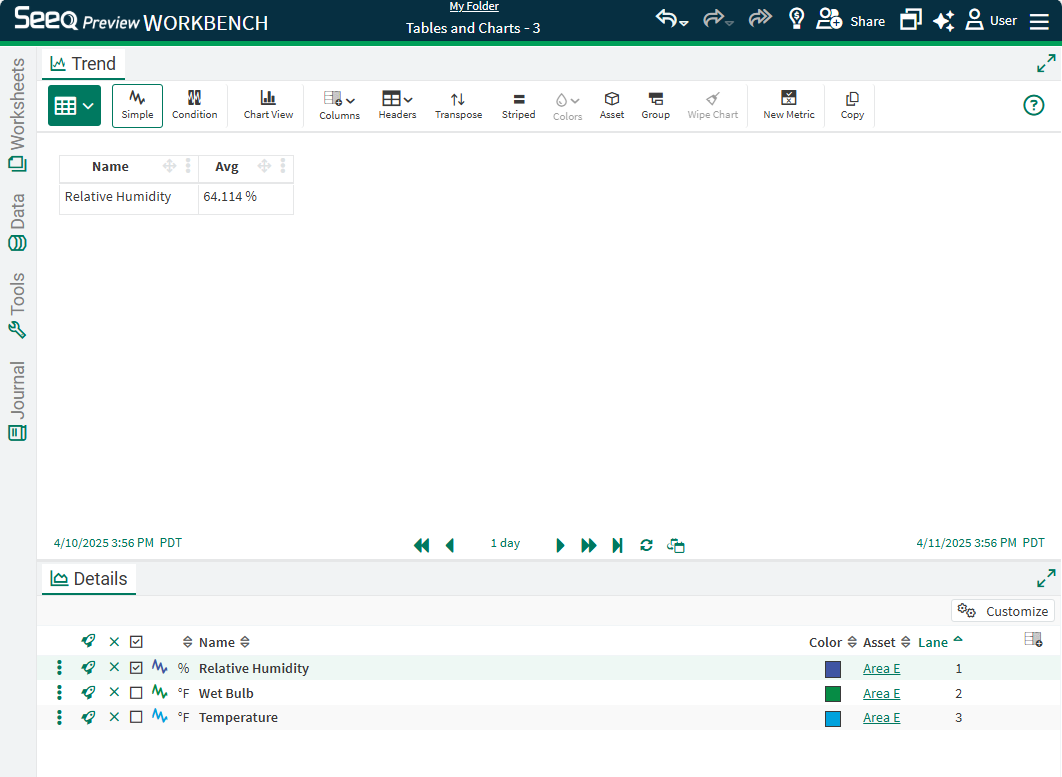
Simple mode displays Simple Metrics and allows quick statistic selection for signals and conditions over the whole display range.
Add statistics as new columns in the table.
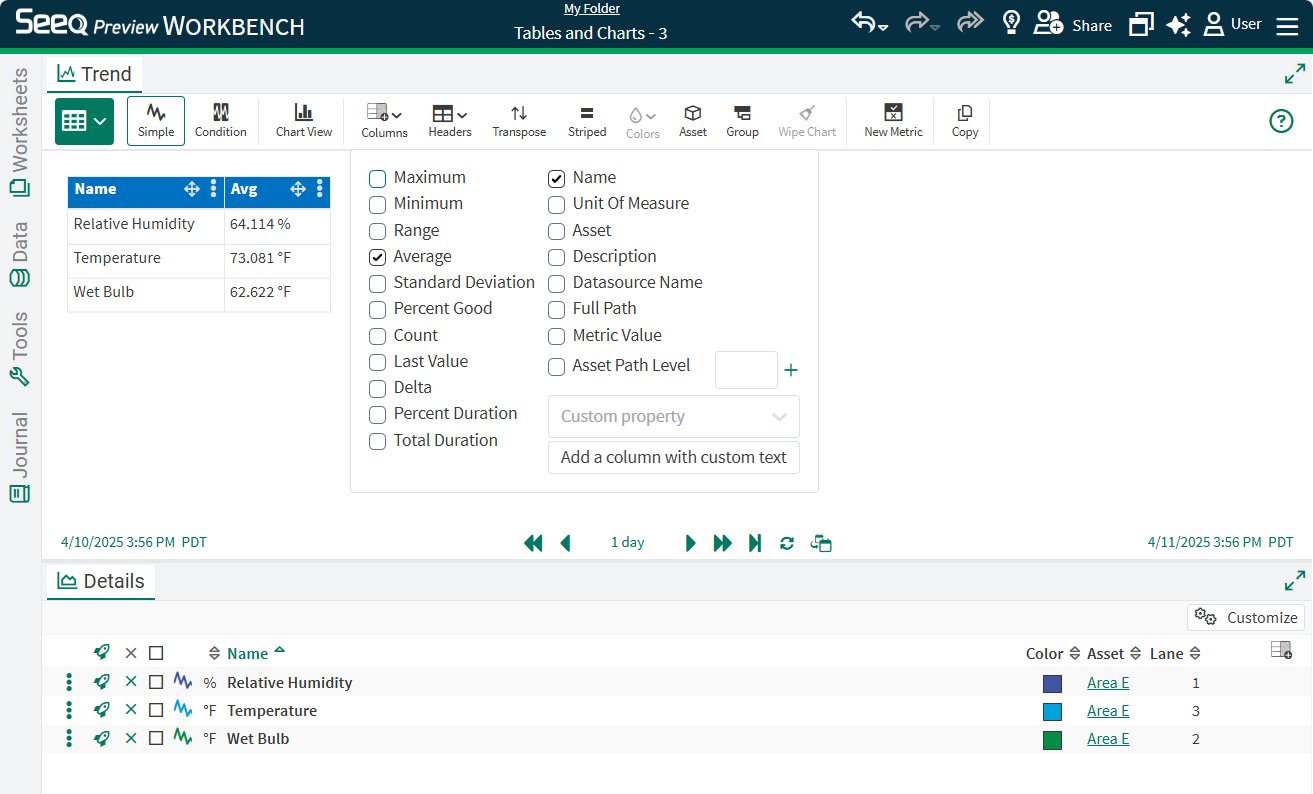
If Simple Metrics are in the Details Pane, their coloring will apply to the Simple table cell that has the same signal/statistic combination.
Metrics will provide the click through behavior to go from the table to a trend of that metric. Clicking on non-metric cells will not change the view.
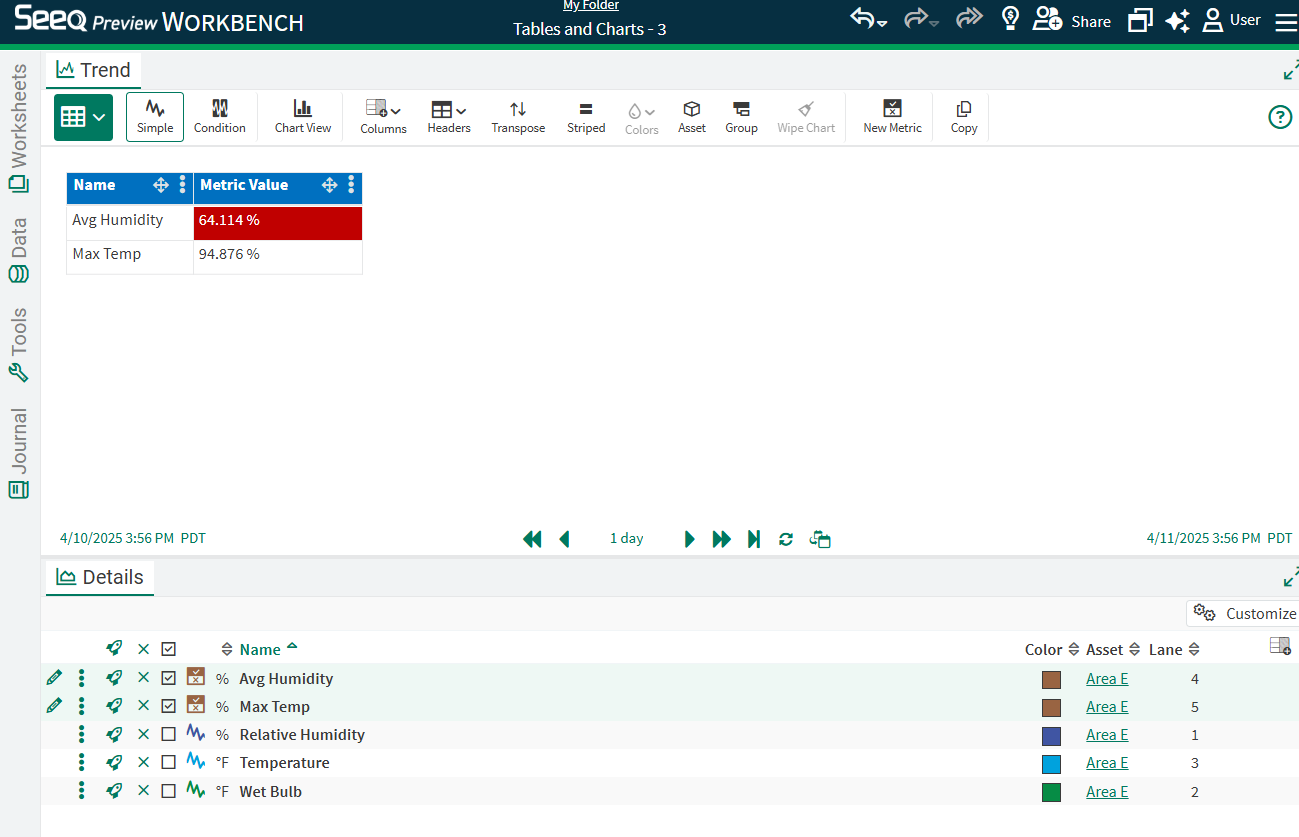
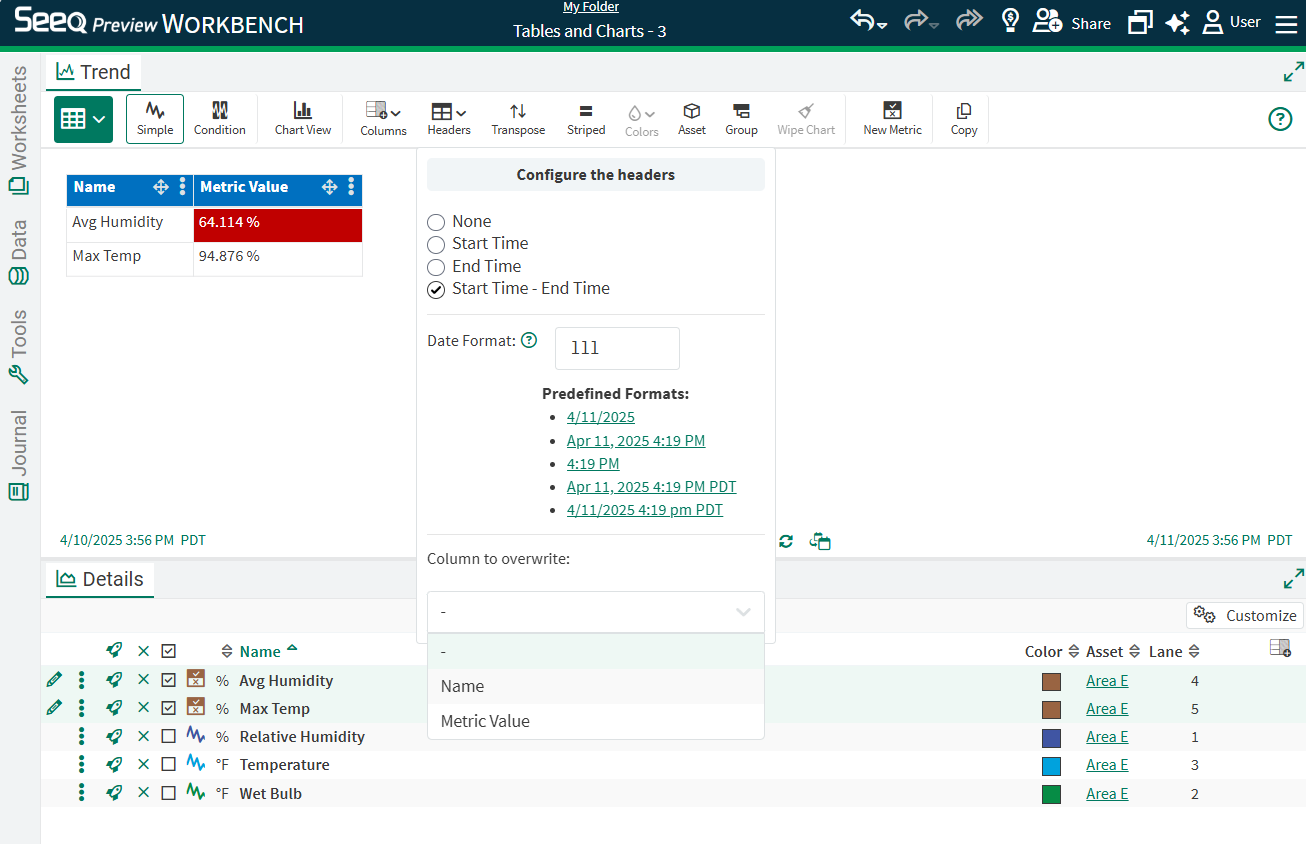
The Metric Value column will collect all Scorecard Metric values in a single column if they are calculated using different aggregations.
The headers of each column can be overridden with free text entry or by configuring the date range options in the Headers button on the Toolbar.
Condition Tables
Use the Condition Table to display Condition and Continuous Metrics. Simple Metrics will not display in Condition Table. Conditions can also display here without Metrics, but Metrics will be needed to color cells relative to values against thresholds or to click on the value and see the underlying metric in Trend View.
Select Condition or Continuous Metrics to display in the Details Pane. Adjust column header formatting with Header button in Toolbar.
Capsule Properties can also be used as headers. Some examples of when this will be useful is for capturing operational modes, product grades, or batch IDs.
Selecting the Value (Original) property corresponds to the Value property set for the Stages condition in Seeq Formula.
Condition tables will show any capsules that are in conditions in the details pane and Condition or Continuous metrics. Where the same condition is used, duplicate rows will be removed.
Add a new column as a signal/statistic combination as previously possible in the Capsule Pane, or add a property. Drag and drop these columns manually added to reorder. Condition and Continuous scorecards will display as columns that cannot yet be reordered.
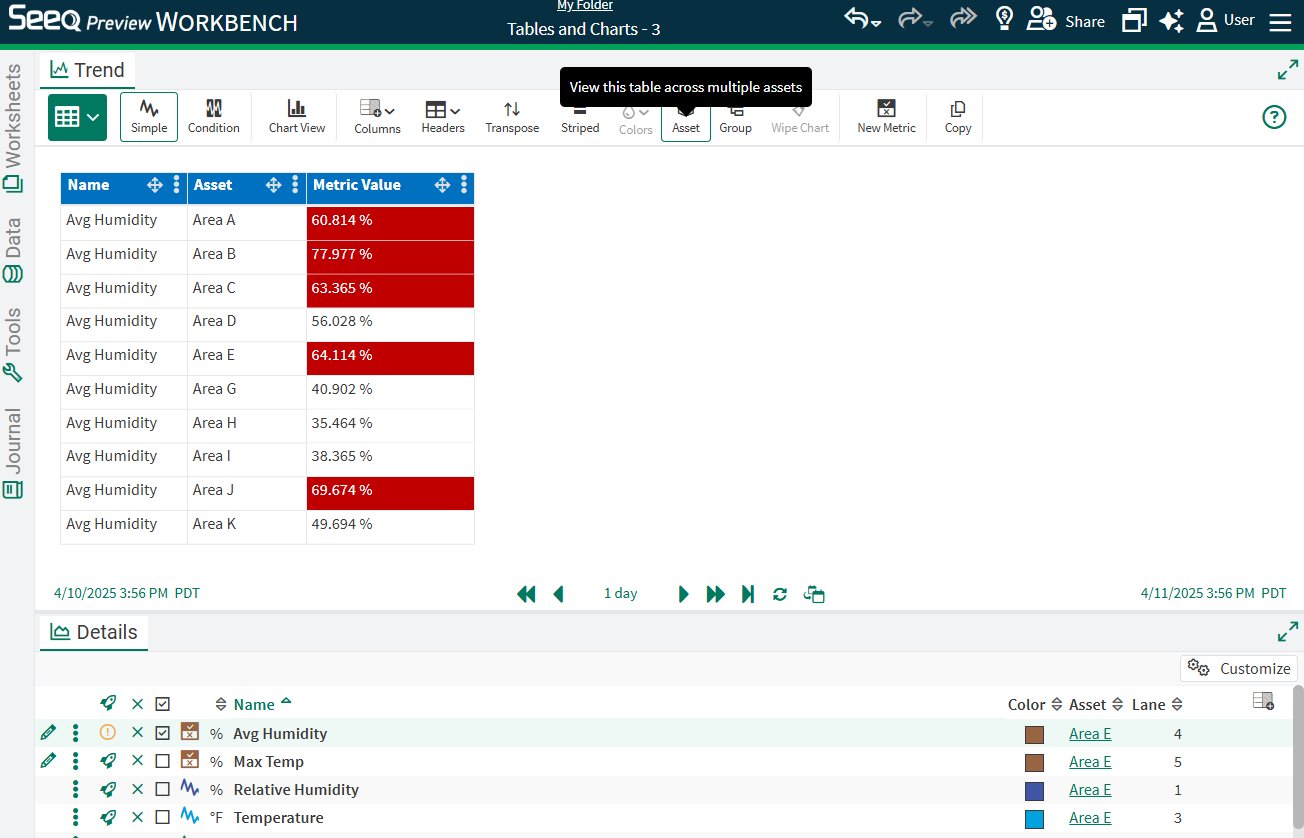
Tables across Assets
If there is at least one calculation/item shown in your table that is based on an asset, use the Asset button in the Toolbar to select a parent asset to reflect the results in the table. Selecting a parent will display a table across any descendants (no matter their location in the tree). In the table to the left, Example >> Cooling Tower 1 is selected to see Average Temperature results across all Areas below Cooling Tower 1.
Changing the Number Format for the signal in the Details Pane pane will update the same signal’s statistics in the table and will also reflect that number formatting across available assets when assets are selected.
Unit Conversion
A Table across assets will automatically convert units where applicable. For example, if a Flow signal for one asset is measured in kgal and a Flow signal for another asset is measured in cubic meters, the table will automatically convert to the units of the original asset in the Details Pane (kgal, in the example to the right). The Unit of Measure column can be configured, which will disable this automatic conversion. Conversion can be enabled by checking the Convert Units box in the the Asset button in the toolbar.
Charts
Simple and Condition tables can be used to create a variety of other visualizations.
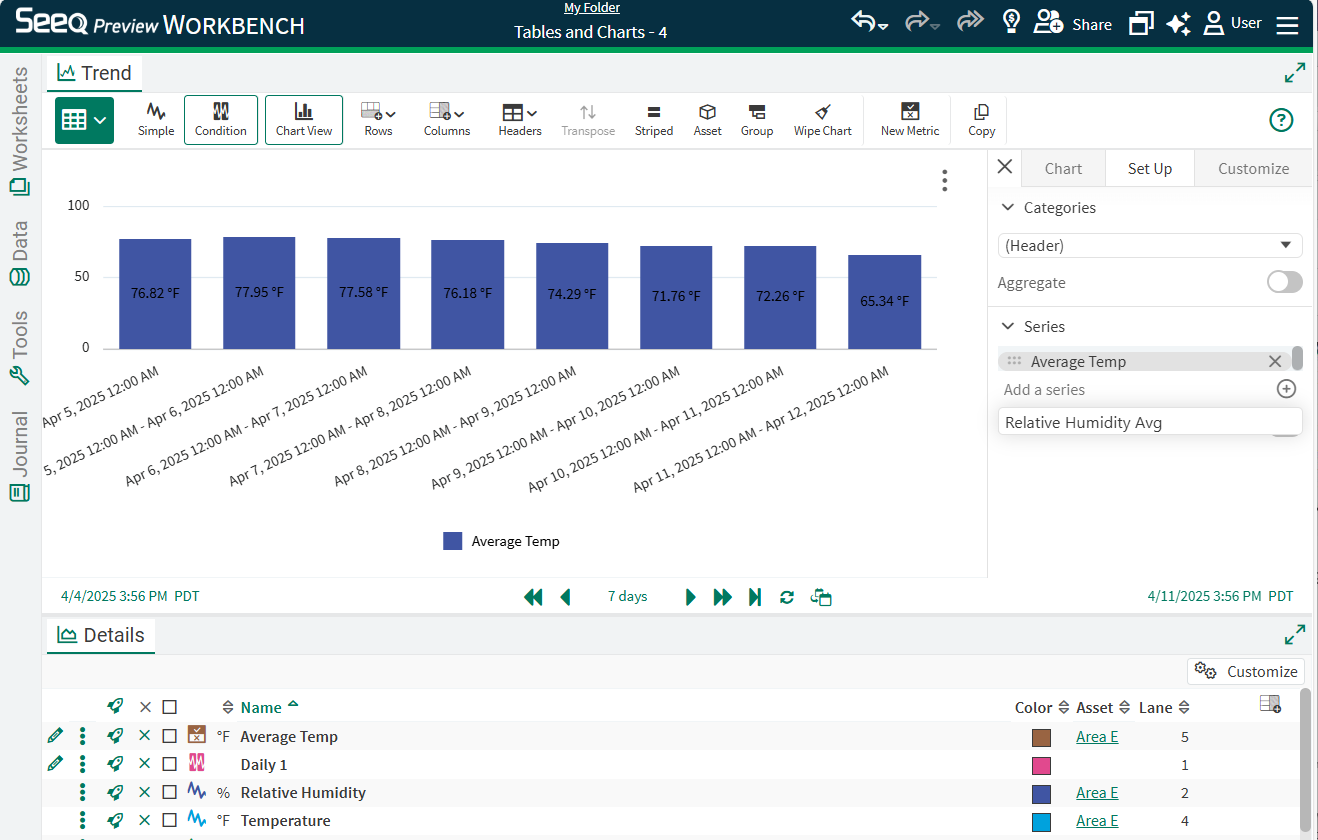
When you first toggle to Chart View using the button in the toolbar, a menu on the right will open that allows you to configure chart type, set up which columns will be used, and customize formatting options. Customization includes adding a chart title, modifying font type and sizes of legends, axis, and series. When done modifying the chart, this menu can be collapsed by clicking on the X in the menu on the right. It can be accessed again with the three dot menu on the chart.
Chart types include a variety of column, bar, pie, XY, line, area, polar, and combination chart options. Each of these charts are based on the data displayed in the table prior to switching to chart view.
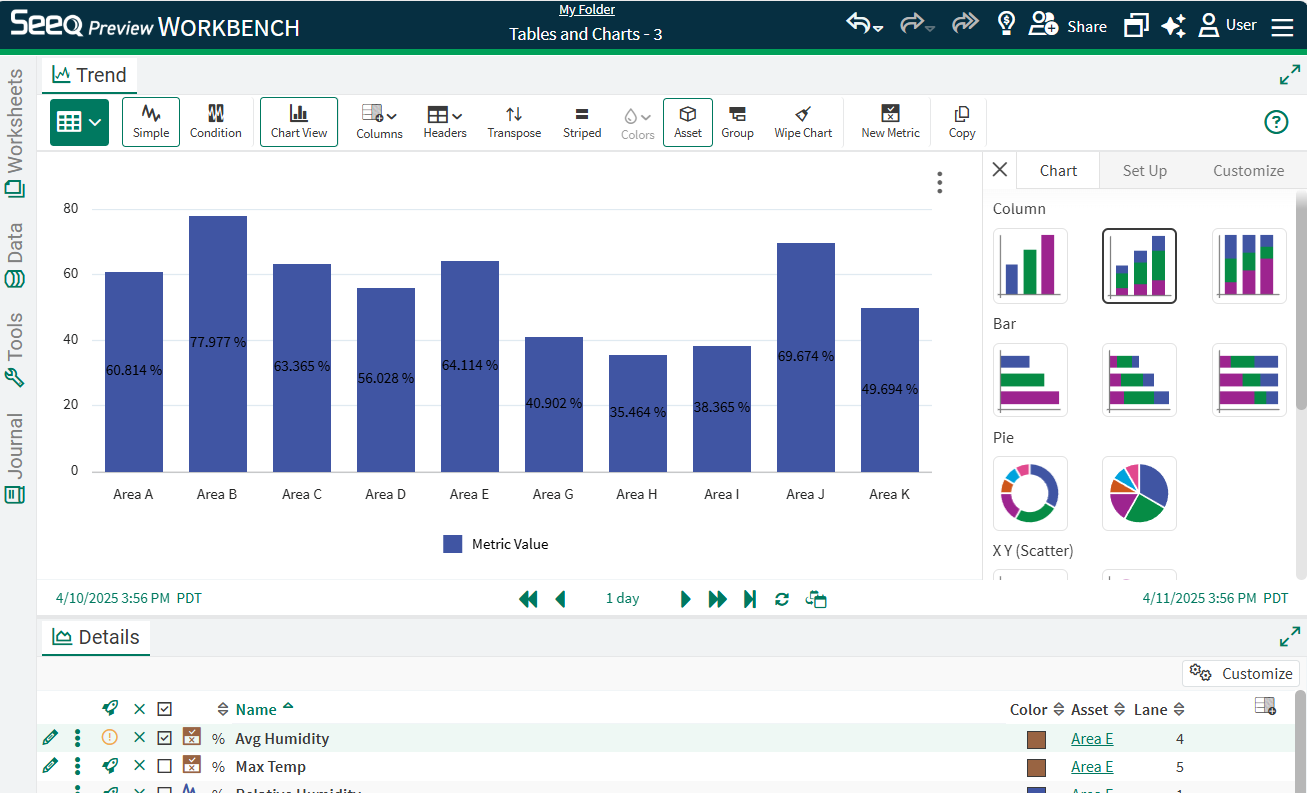
Each numeric column in a table comes through as a different series that can be selected in the Set Up tab of the menu on the right. By default, all columns will be selected for bar and column charts, but unselecting on the Data tab will reduce data shown. Only one series can be selected for traditional pie charts, but multiple series can be displayed on a donut chart.
Any text columns will appear in the Categories section to apply to the horizontal axis. If using the generic header column, it will follow formatting of that column that can be changed using the menu in the Headers button in the toolbar. This can change date formatting or select a property instead of a date. If working with properties, it is likely that grouping prior to displaying a chart will be beneficial. Read more on that below.
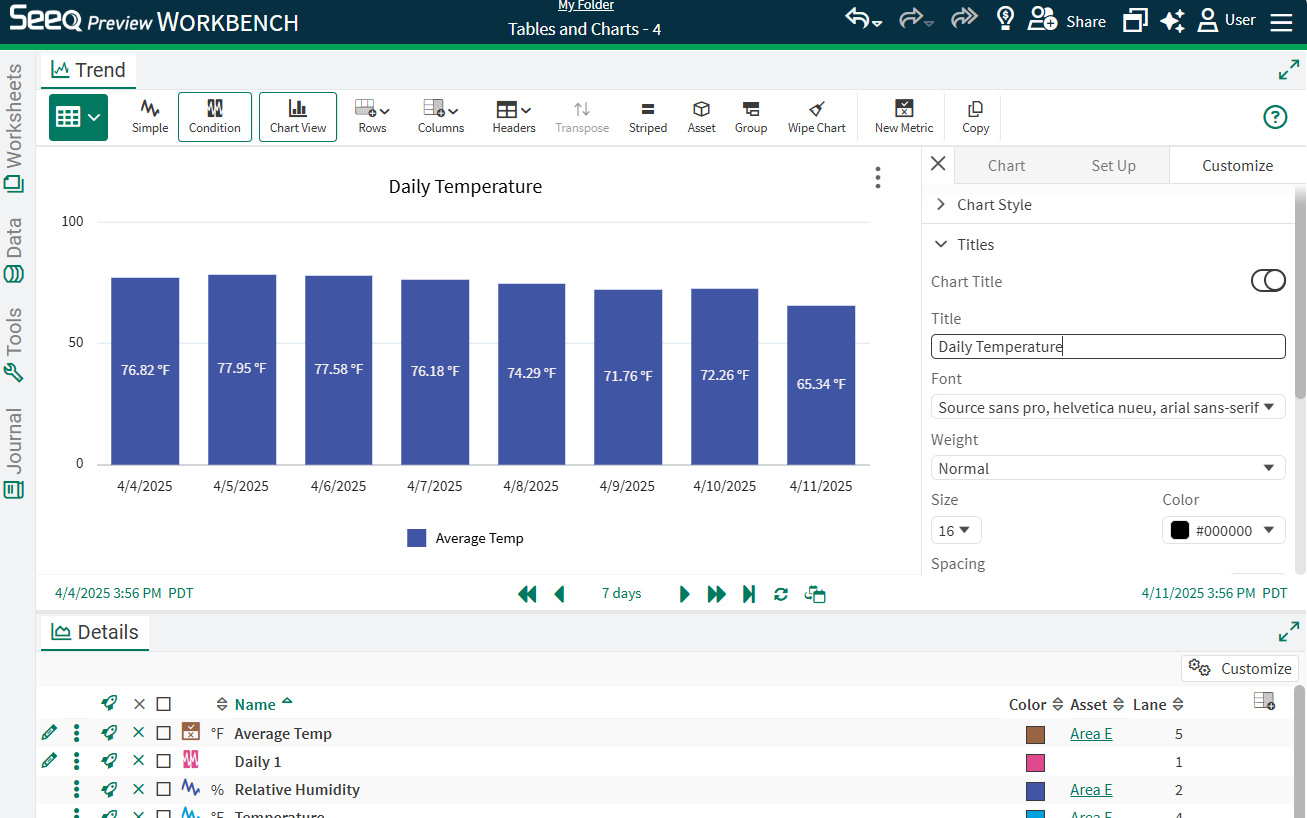
There are a wide array of formatting options available on the Customize tab. This includes but is not limited to
Display of various components including Title, Legend, and Labels. Change the title by double clicking on “Condition Table Chart”, or choose to hide it in the Format tab by unselecting “Enabled” under Chart → Title.
Font size and color for axes, series, legend, and title.
Spacing (padding) for axes, legend, and title.
Chart background color.
There are several other icons in the Toolbar to help visualize data in the Chart.
Expand - When grouping has been applied to a condition table, clicking the Expand button will show all nested values in the Table, instead of the default collapsed group rows.
Collapse - When grouping has been applied to a condition table, clicking the Collapse button will collapse any expanded sections so that only the highest level grouped rows display.
Wipe Chart - Clicking the Wipe Chart button will clear all changed formatting previously applied to a condition table chart to go back to the default configuration.
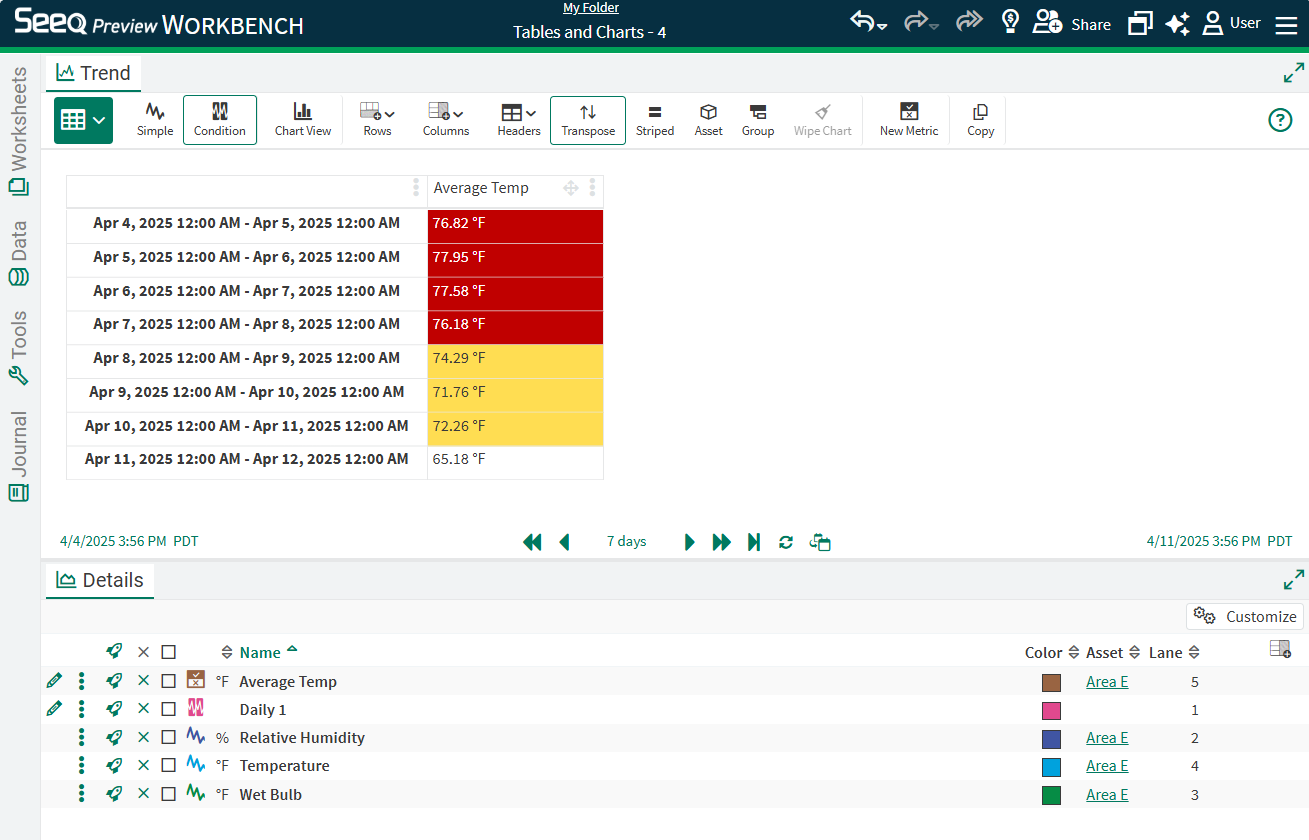
The following video shows examples for a bar chart with daily temperatures, aggregating a value over batch Operations and Phases, sorted downtime durations across assets, comparing various processes with XY charts from a table, cumulating flows with an area chart, and comparing temperatures across assets with a radar chart.
The images above show examples of a chart based on a condition table with a daily condition and average temperature. For many condition tables, it is likely that grouping and aggregating is an important step to getting the desired chart. Below are two examples of how grouping and aggregating can be used for condition chart visualizations.
Example: Comparing Downtime Durations Across Assets
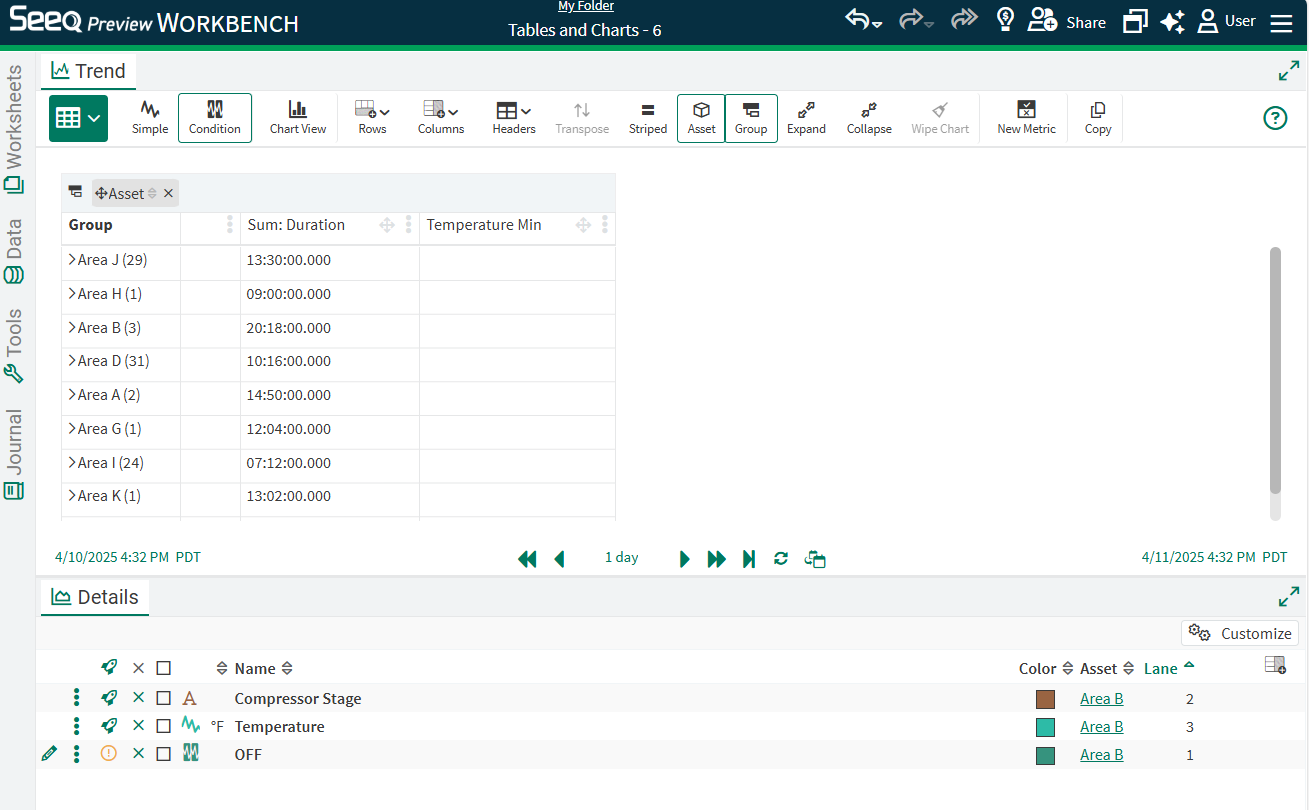
The table to the right is based on identifying a downtime condition (Compressor Stage == OFF) and displaying the duration of each capsule across all levels of the Example Asset Tree.
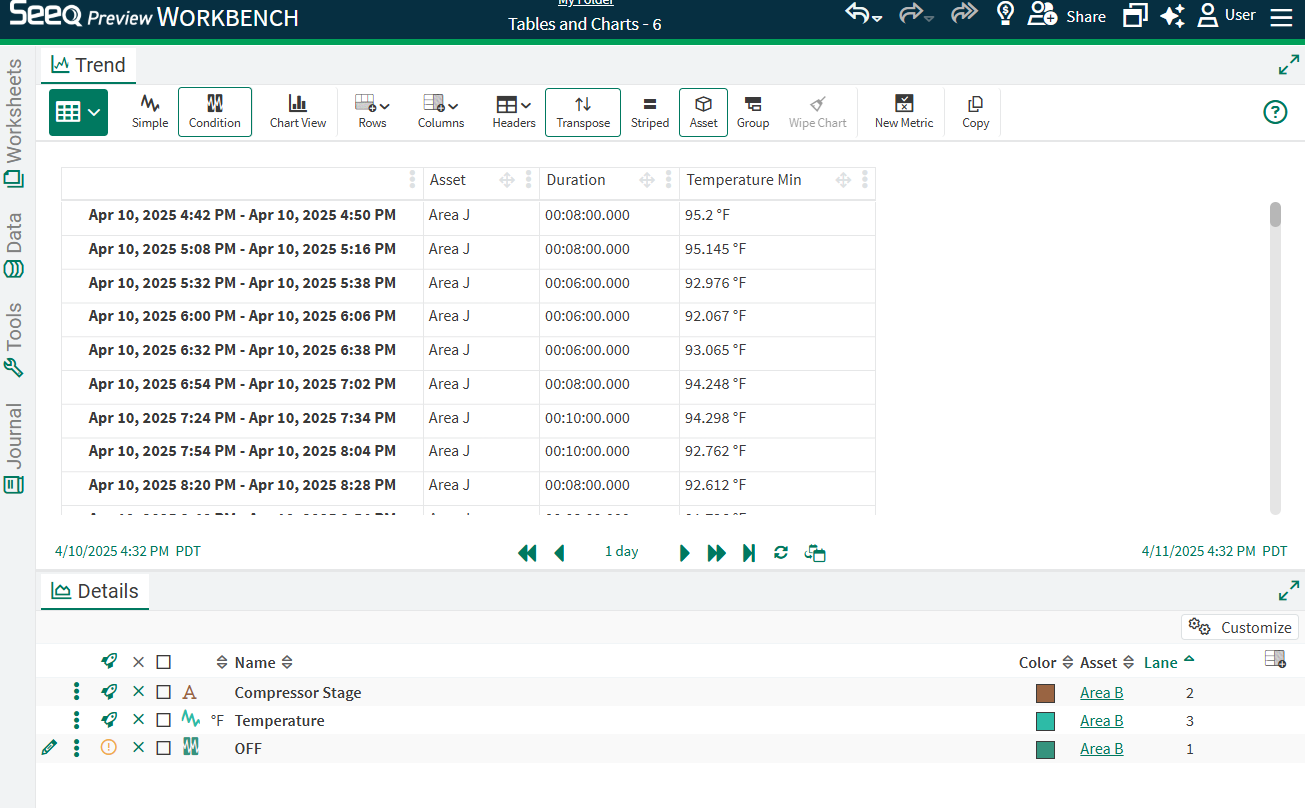
In order to get a comparison of total downtime of each asset over the period, enable grouping by Asset by selecting the Group button in the Toolbar and then dragging Asset column to the “Drag here to set row groups” area above the table, or use the three dot menu on the Asset column to group by that column. Now the table shows a row for each Asset.
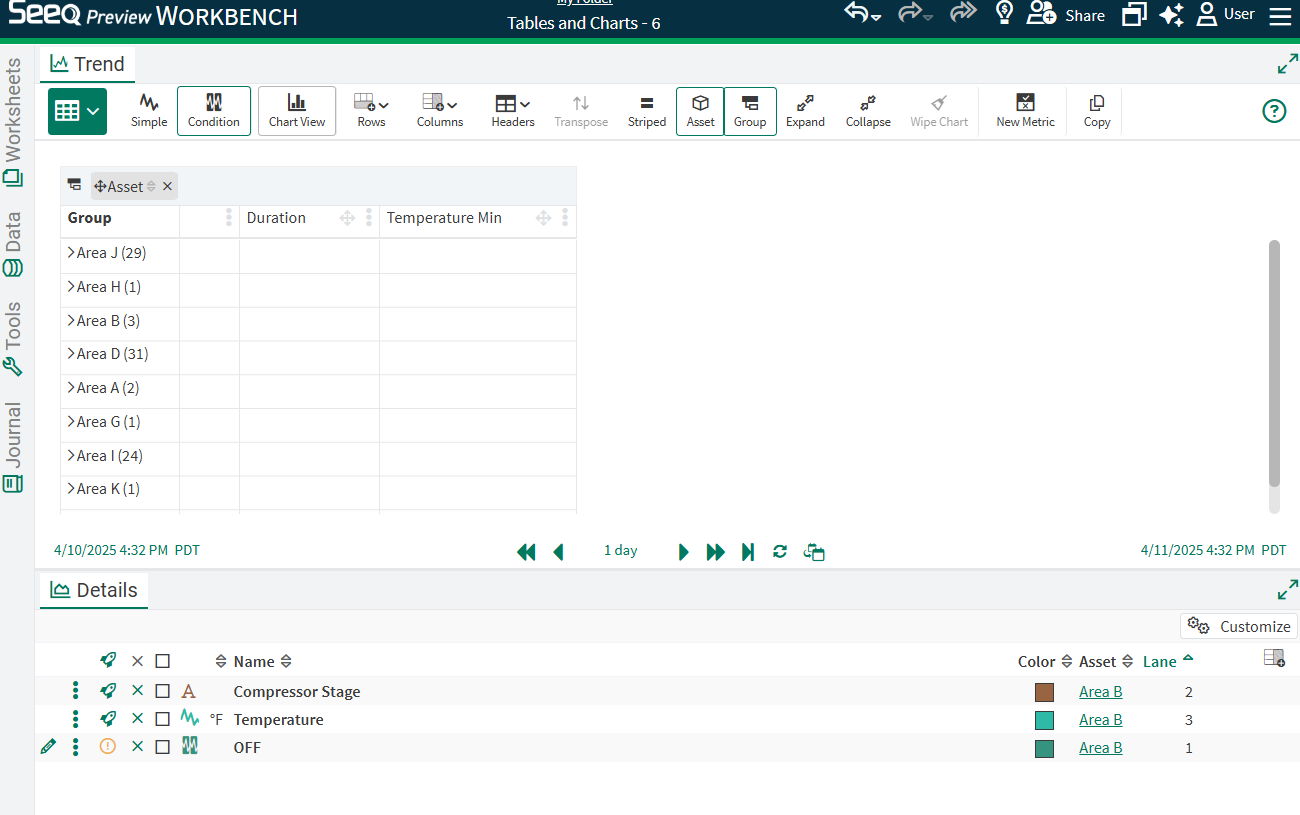
The next step is to Aggregate the Duration column, summing each individual capsule duration.
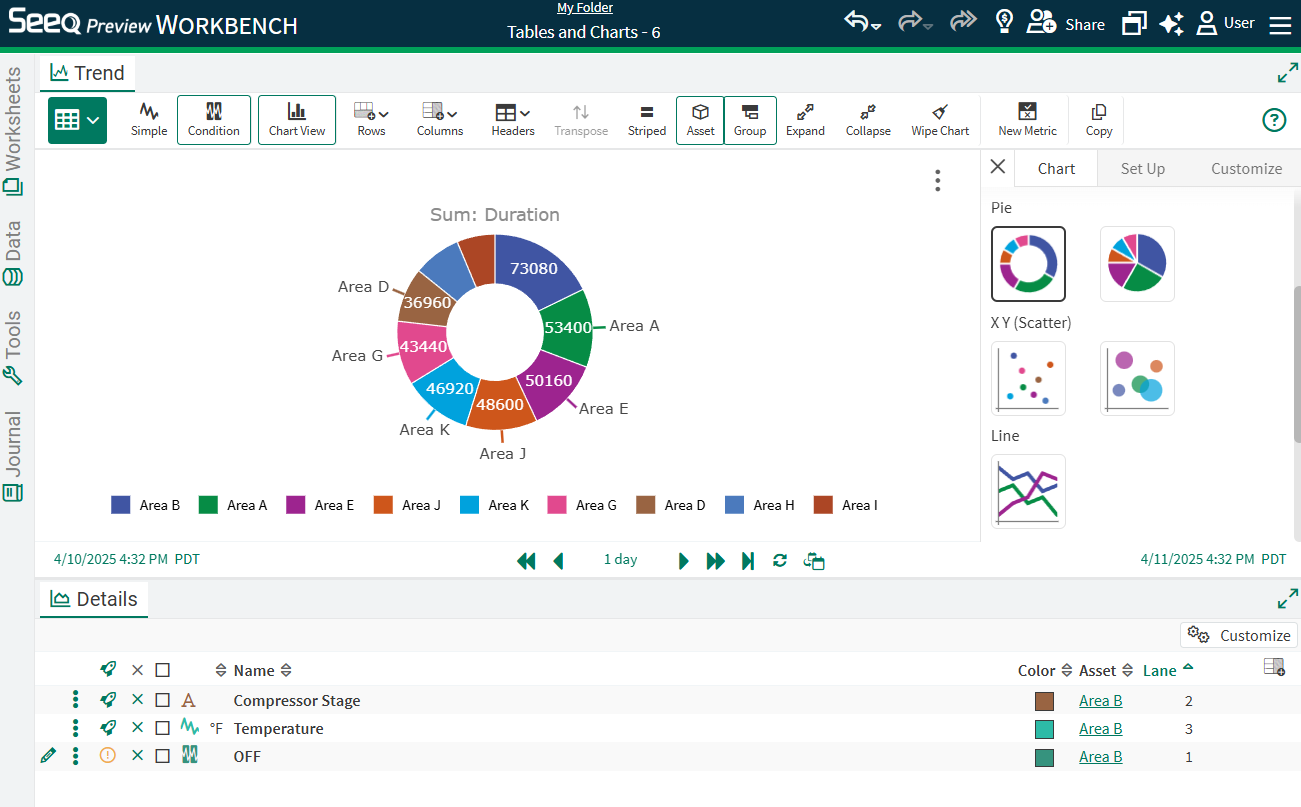
After this aggregation is done, select the Chart View button and select different chart types in the menu to the right if a column chart is not the desired chart.
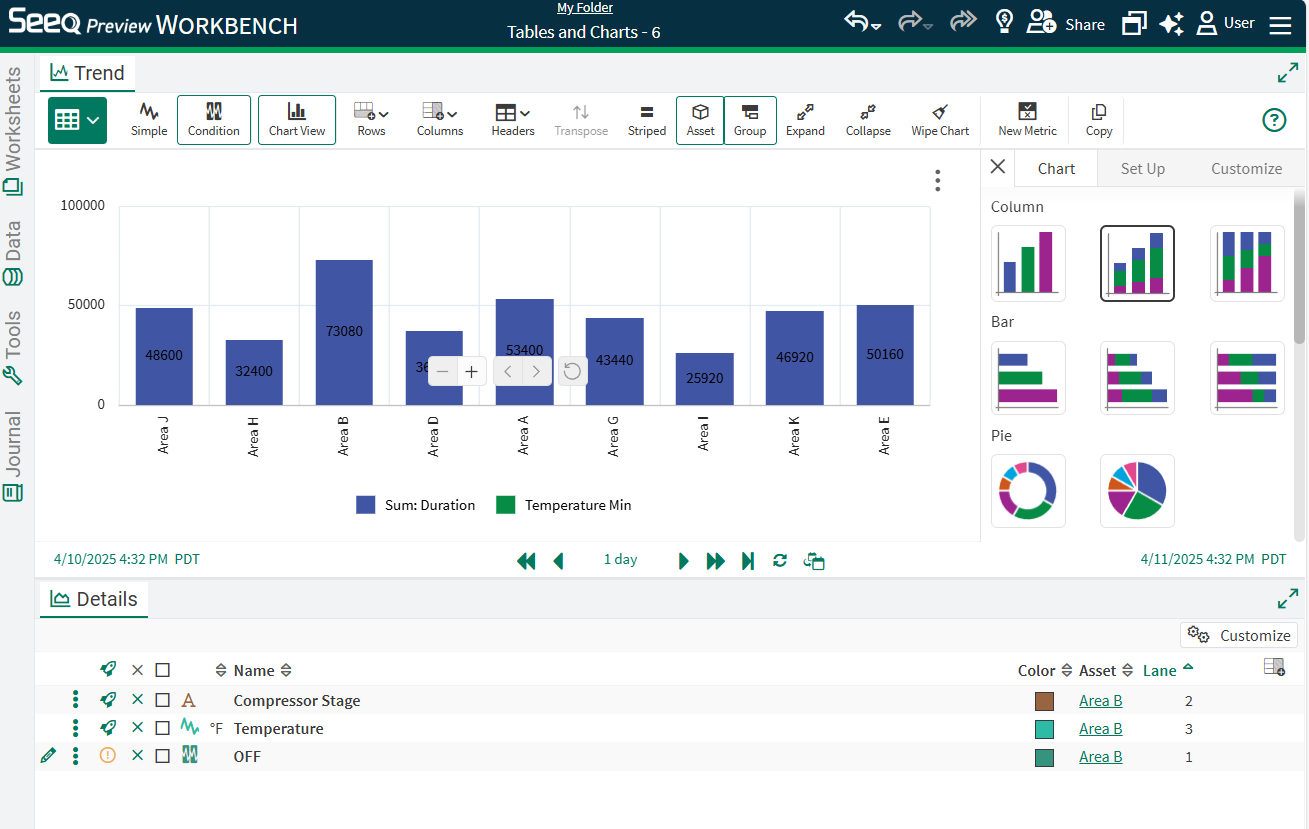
Rename the chart or apply other formatting as desired. Apply any sorting or filtering in Table view to update how the chart displays. In the image to the right, duration is sorted descending in the table.
Example: Comparing Different Operations
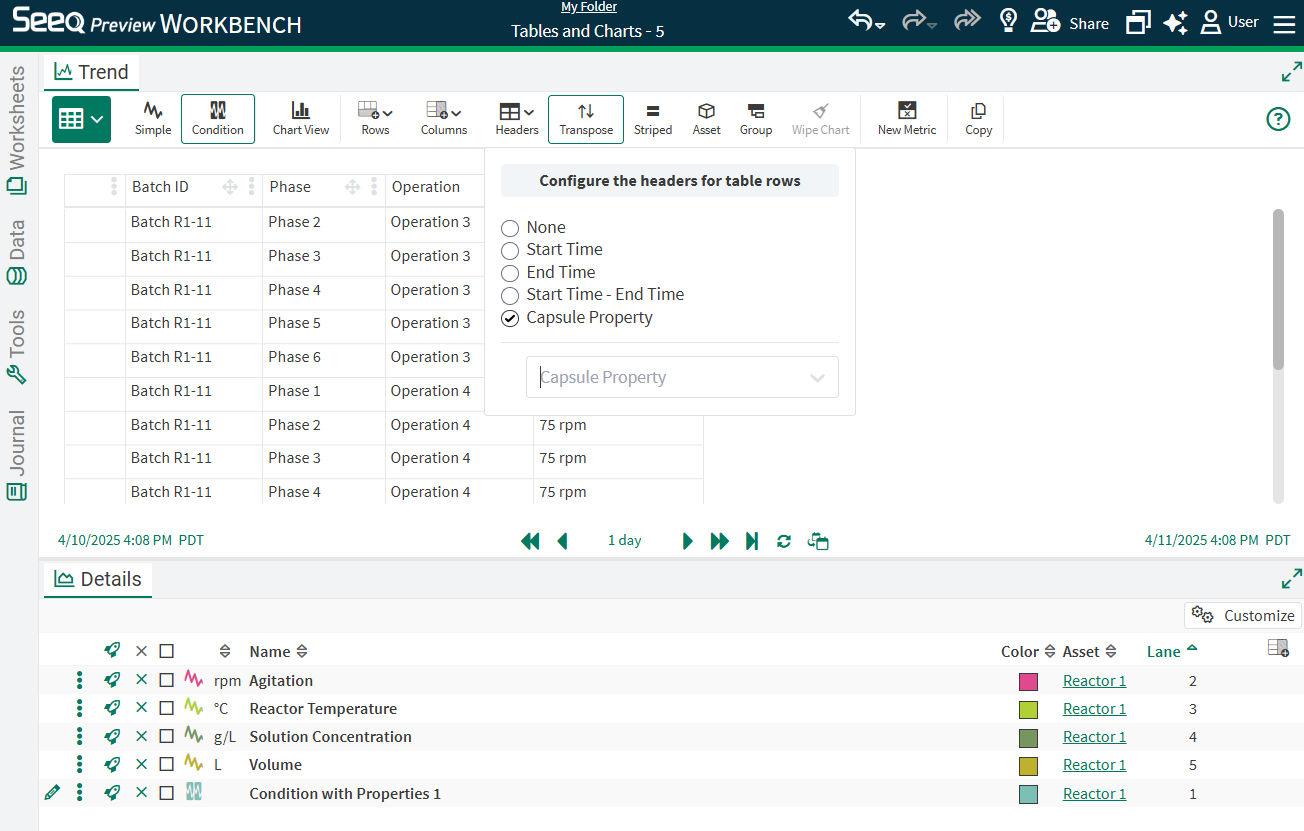
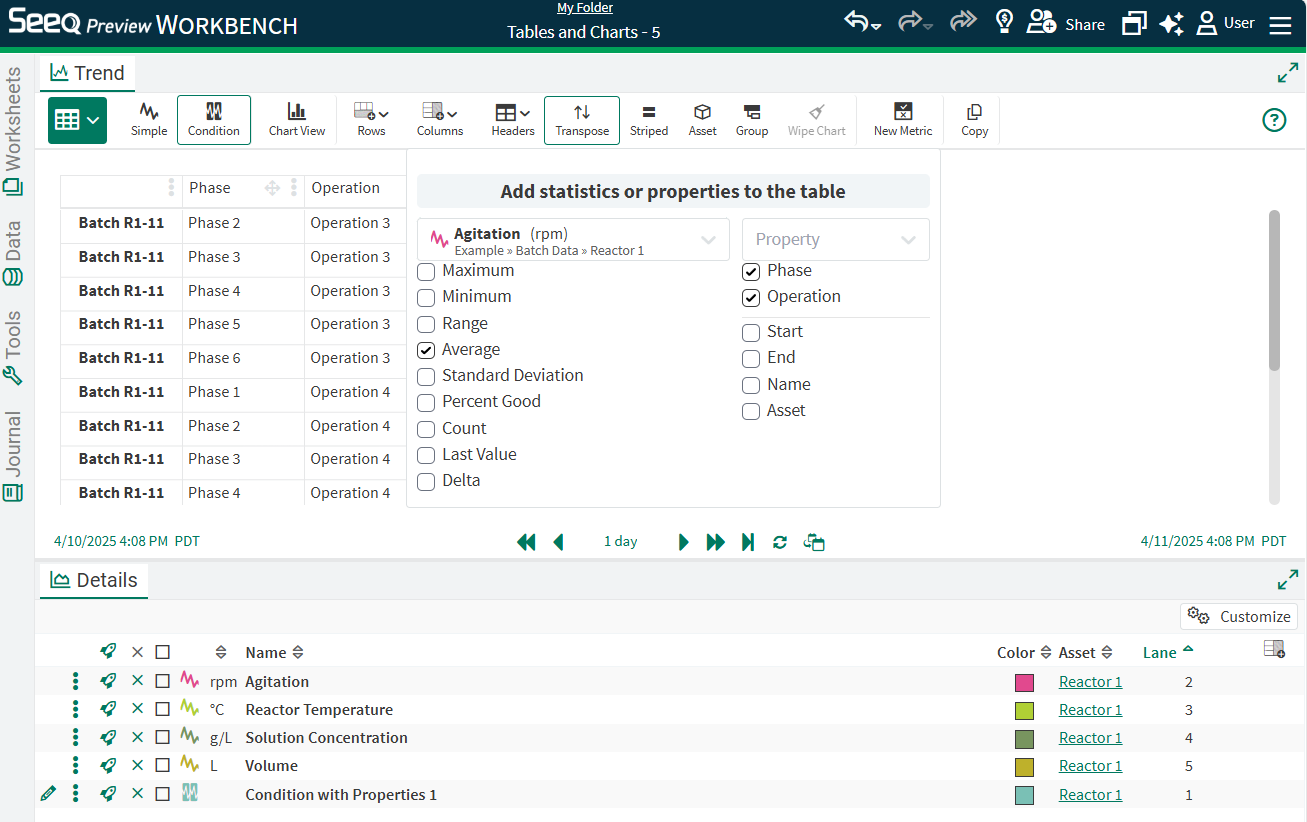
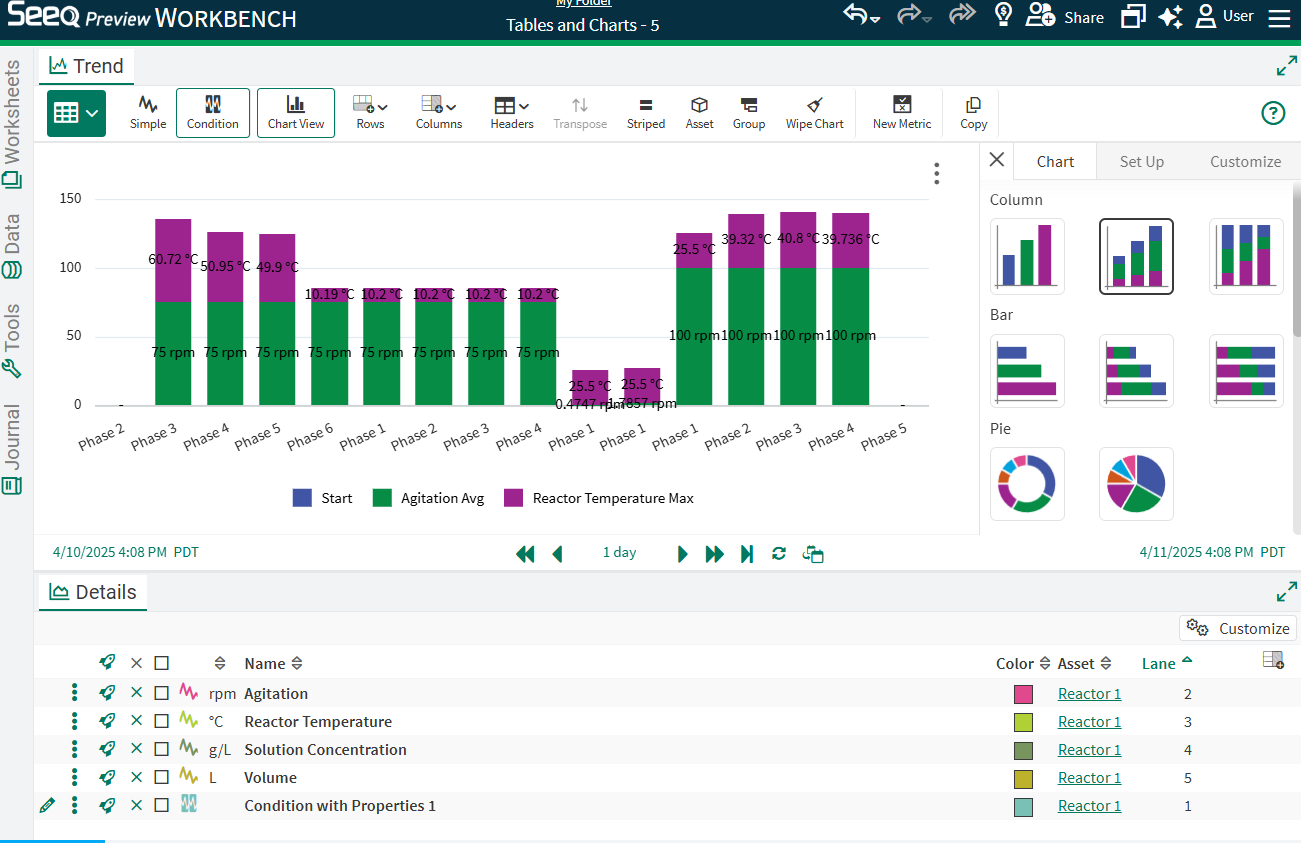
When conditions exist with properties highlighting different phases of operations, capsule properties or condition names can be used for grouping, aggregation, and visual comparison. In this example we have properties that include Phase, Product, Batch, and Operation. There are also process signals for Agitation, and Reactor Temperature.
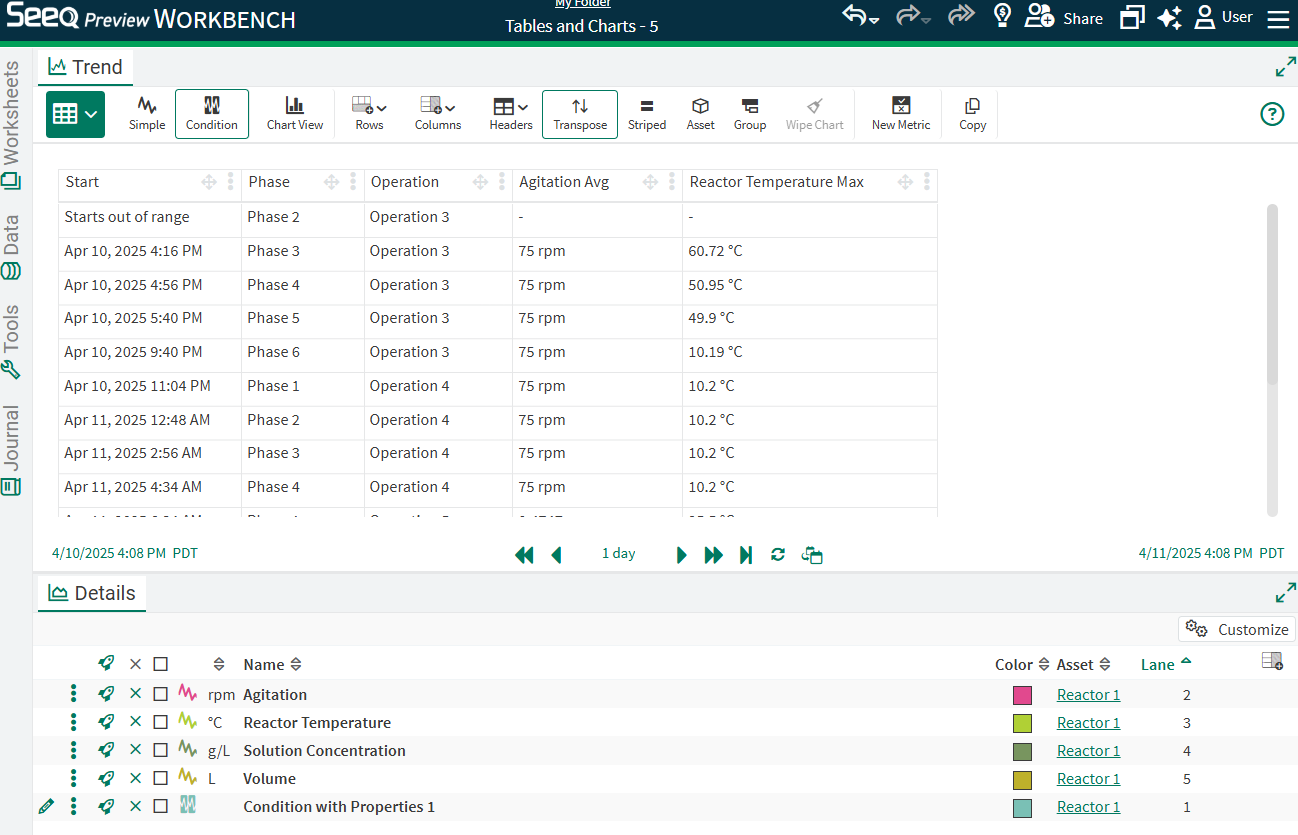
In this table, Headers are set to None with other columns configured for properties and Start. The default chart is shown to the right. In order to compare between different operations or other properties, grouping and aggregation in the table needs to be done first.
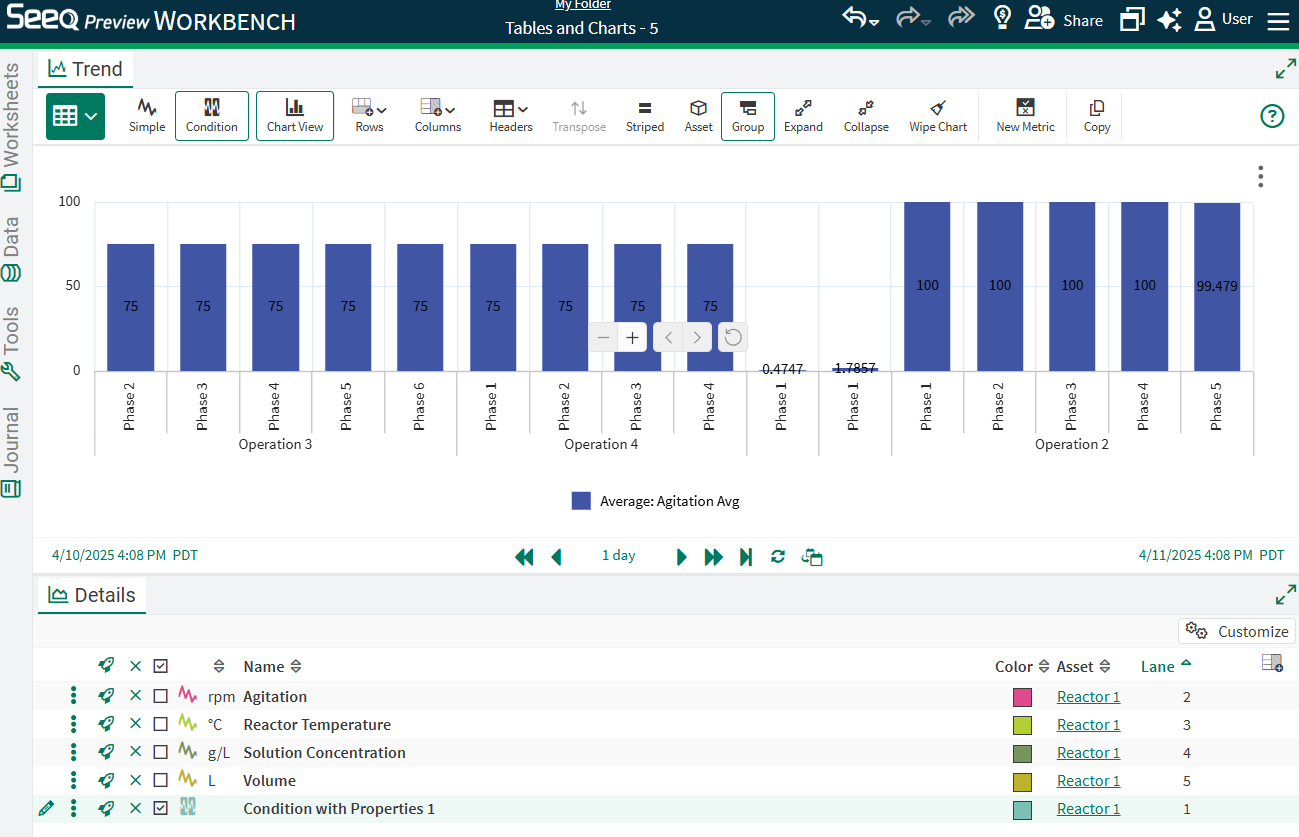
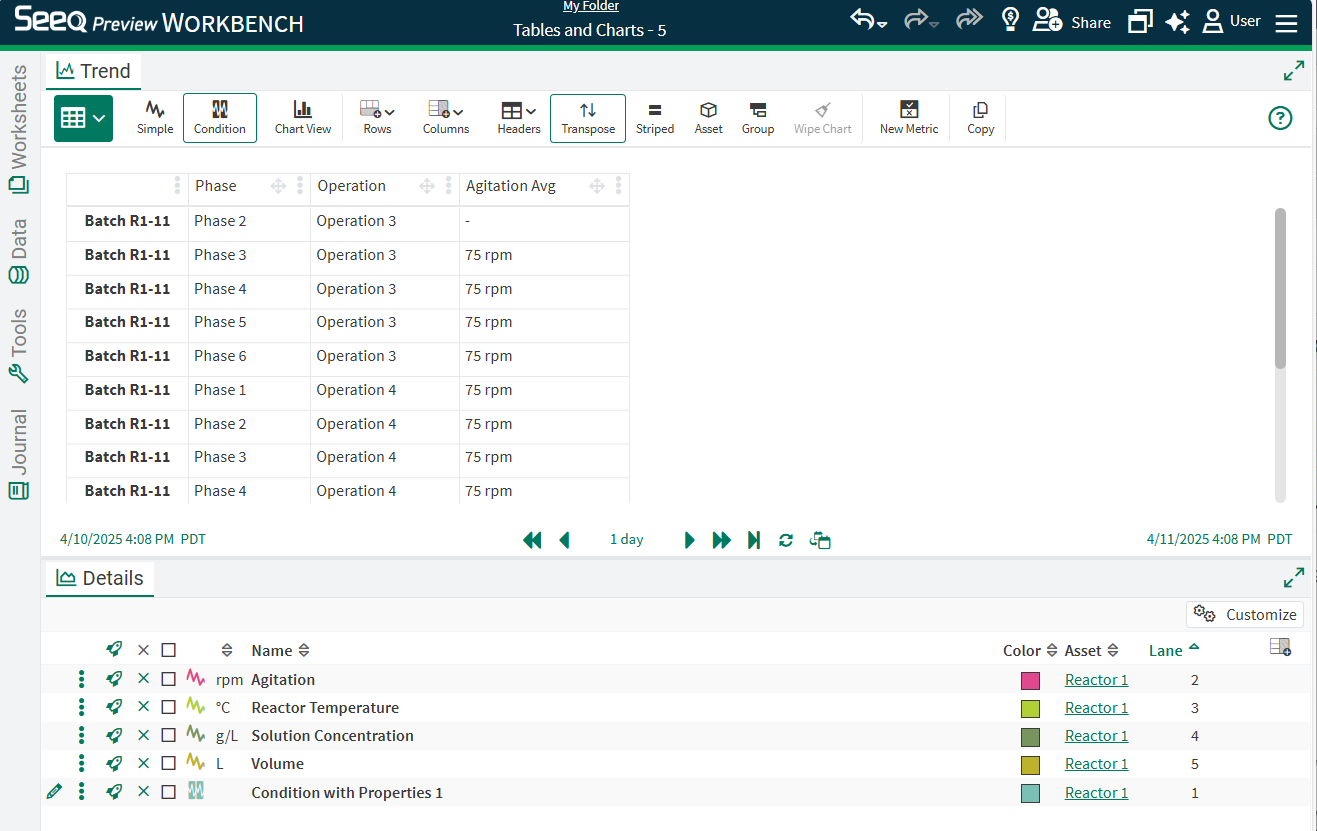
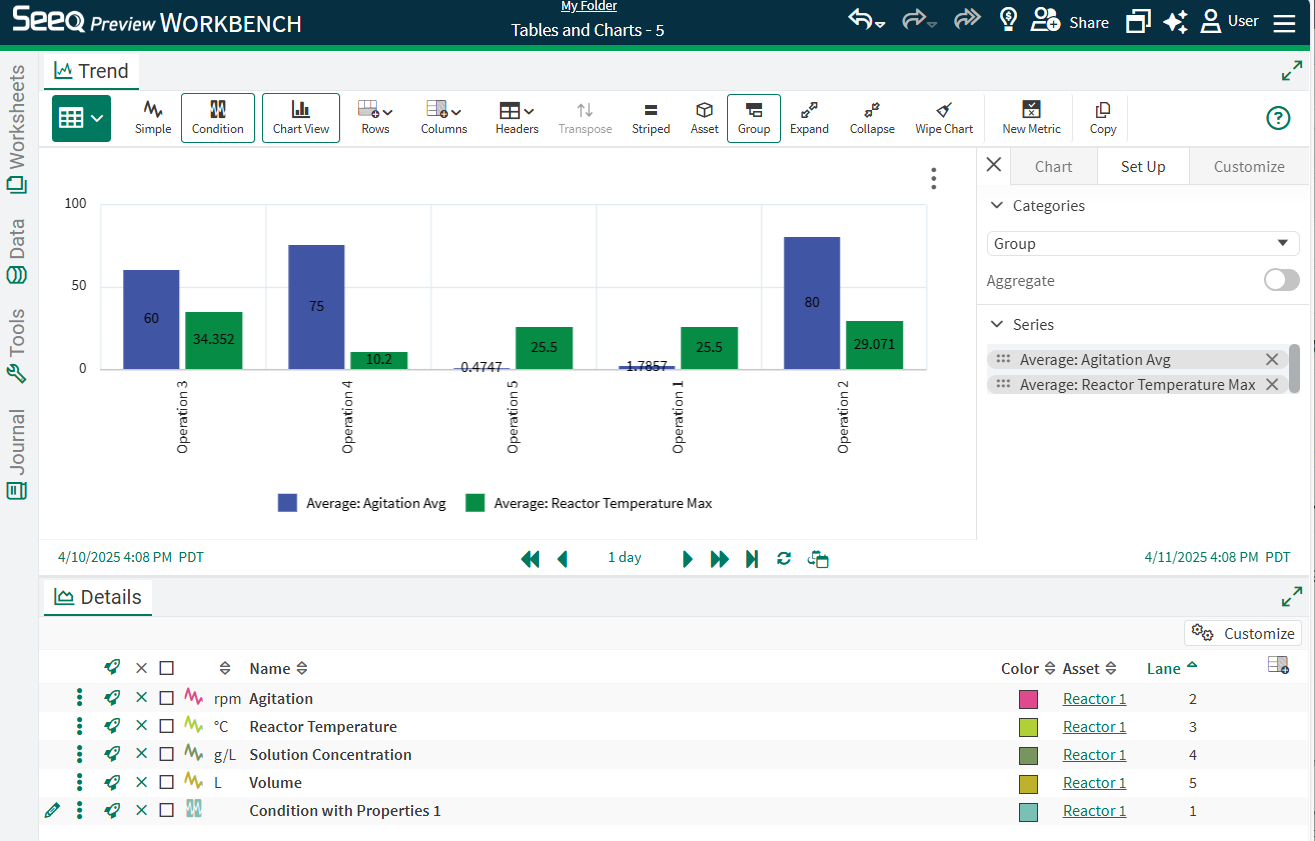
After grouping by both Phase and Operation in this example, and aggregating to calculate the Average of Agitation and Reactor Temperature, the bar chart initially appears to have multiple series, even though some of them are empty or show no value.
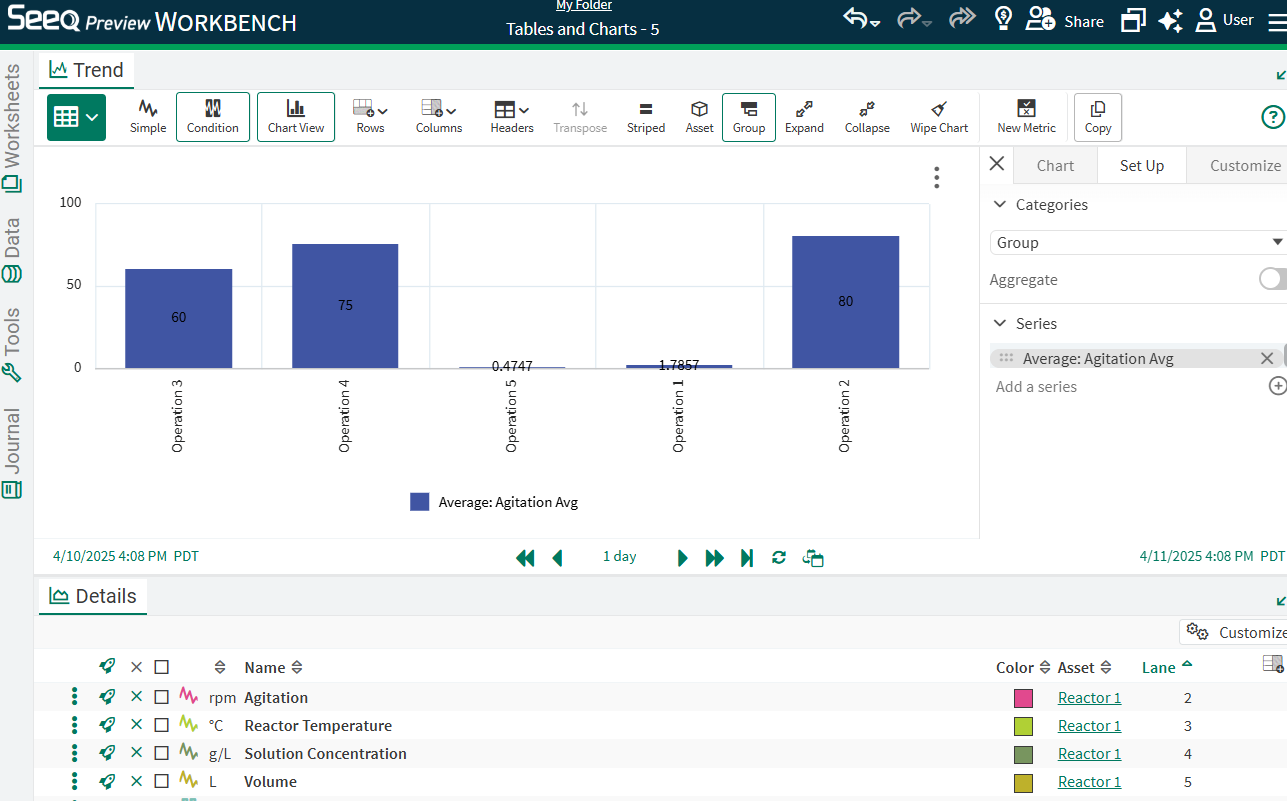
Unselecting the empty columns in the Set Up tab (or removing those empty columns from the table) will result in only the desired series displaying, in this case Average Agitation.
Note in this example, group is the Category selected instead of (Headers) because there are no headers in the table as currently configured.
Toggle back to the table and individually expand each Phase row to reveal the operations below. Then navigate back to the Chart to see the Expand icon in the Toolbar to expose all the grouped values for more than one layer of grouping.
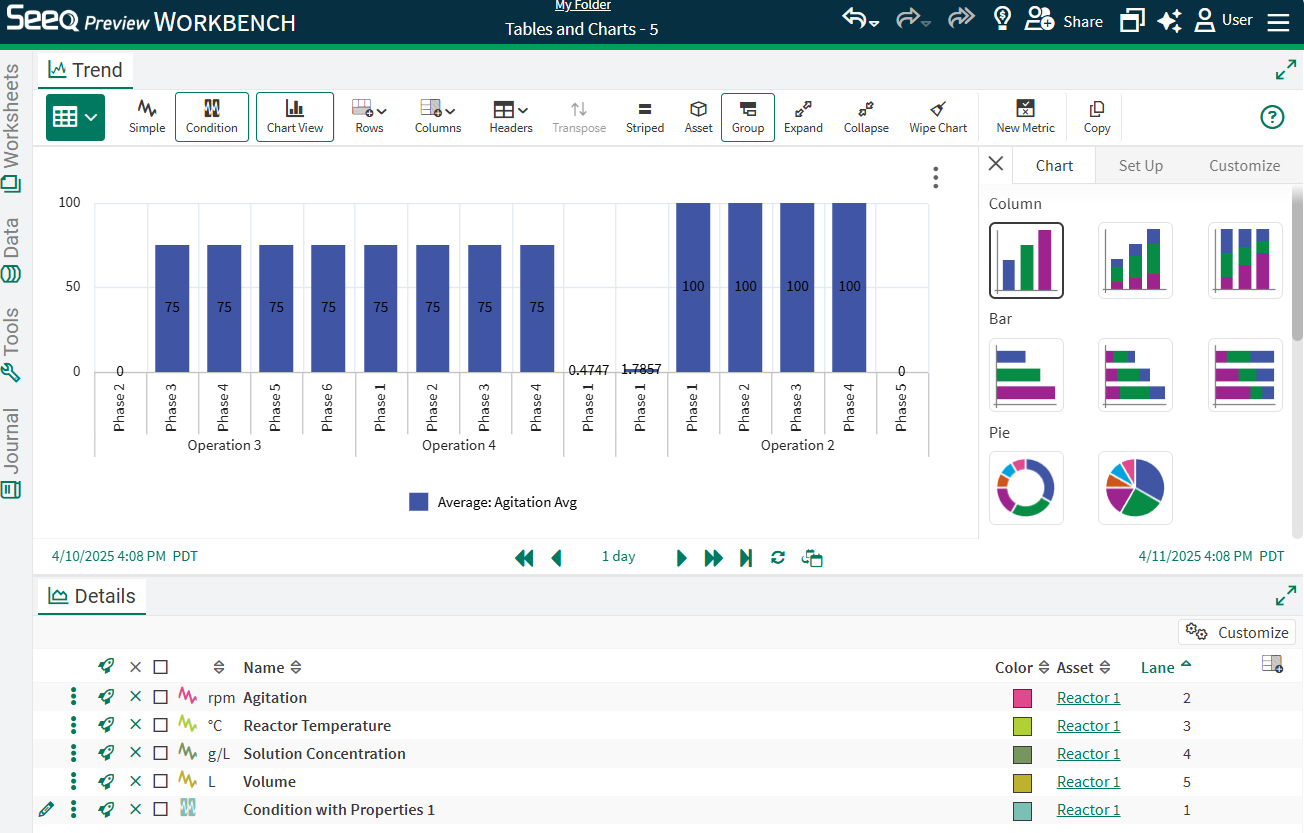
These Charts are based on the table that displays in this view. Whether or not a maximum capsule duration is applied to the conditions displayed in the table will impact the results represented by the table and chart. In order to populate every statistic row in the table (and therefore the chart based on the table), configure a maximum capsule duration by applying a removelongerthan(x days) or using an Advanced Value Search. Another way to mitigate empty rows is to change the display range to be inclusive of all capsule start and ends. In the chart to the right, a maximum capsule duration has been applied, where it was not in the image above, resulting in two more bars having values where they did not previously (Phase 1 Operation 4 and Phase 2 Operation 4).