
This article explains what condition monitors are, how webhooks integrate with them, and how to implement a webhook integration end to end. It is intended for administrators and developers setting up automated outbound workflows from Seeq.
Condition Monitors
What a condition monitor is
A condition monitor is a scheduled job that queries one or more conditions for the existence of capsules. On each run, it evaluates what has changed since the previous run and takes action based on the results.
It is the underlying engine that powers three distinct Seeq capabilities:
-
Email notifications: alert one or more recipients when capsules are detected
-
Vantage rooms: publish detected capsule events to a materialized table for review and triage in the Vantage UI
-
Webhook calls: send a structured JSON payload to an HTTP endpoint, enabling integration with external systems
These outputs are not mutually exclusive. A single condition monitor can drive email notifications and a webhook simultaneously.
Capsule event types
On each scheduled run, a condition monitor classifies capsules into one of four event types:
|
Event type |
Meaning |
|---|---|
|
|
A new capsule has been detected |
|
|
A previously uncertain capsule is now fully certain |
|
|
A capsule that was uncertain in a prior run remains uncertain and is re-emitted on every subsequent run until it becomes certain or is no longer detected |
|
|
A capsule that was tracked as uncertain in a previous run no longer appears in the current query results, meaning it has disappeared from the condition entirely |
Certain capsules (historical or fully bounded data) emit NEW once and generate no further events. Uncertain capsules (such as those from live or unbounded conditions) emit NEW and then continue through the lifecycle until they resolve.
Uncertain capsule lifecycle:

  NEW (uncertain)
       │
       ├── STILL_UNCERTAIN ── STILL_UNCERTAIN ── ...
       │
       ├── BECAME_CERTAIN  (exits tracking)
       │
       └── EXTINCT         (exits tracking)

Certain capsule:
  NEW (certain) ── (no further events)
On the first run of a condition monitor there is no previous state, so only NEW events are generated regardless of capsule certainty.
Default event types
If capsuleEventTypes is not specified, the default is ["NEW", "BECAME_CERTAIN", "EXTINCT"]. STILL_UNCERTAIN is excluded by default because it generates events on every run for every unresolved capsule, which can be noisy for long-running uncertain conditions.
Important behaviors
-
STILL_UNCERTAINfires on every run. At a 15-minute schedule, that is 96 calls per day per unresolved capsule. Endpoint logic should deduplicate or suppress repeat delivery if the downstream system does not handle it natively. -
EXTINCTmeans a previously uncertain capsule has disappeared. The monitor tracks uncertain capsule IDs from prior runs and compares them against the current query results. If a previously tracked capsule no longer appears, it is markedEXTINCT. This can happen because a condition formula changed, historical data was revised, or the capsule was an incorrect detection that has since been retracted.EXTINCTis only emitted when the current query is complete (i.e.hasMoreCapsulesisfalse), so the monitor can be confident the capsule truly disappeared and was not simply outside the query limit. -
ID property changes trigger bulk extinction. If the capsule ID property of a monitored condition changes, all previously tracked uncertain capsules are immediately marked
EXTINCTin a single run, regardless of their actual state.
Creating condition monitors
Condition monitors can be created in three ways.
Via the Workbench UI
When a user opens a condition in Workbench and clicks to create a notification, Seeq creates a condition monitor behind the scenes. This interface monitors a single condition, runs on a fixed schedule, and sends email to one or more recipients. It is the right tool for individual alerting on a specific condition. What the UI does not expose is that the condition monitor itself is a more capable construct, one that can watch many conditions simultaneously and drive outputs beyond email.
Extending a Workbench notification
When you create a notification in Workbench, the resulting condition monitor is a real API object with an ID. It can be retrieved and modified via the API after the fact, including adding a webhook URL to it. You can start with a Workbench notification and extend it with a webhook without recreating it from scratch.
Via Vantage
When you configure conditions in a Vantage room, Vantage automatically creates a condition monitor behind the scenes. It uses an Item Finder to dynamically populate conditions from the associated workbook, and the resulting monitor is scoped to that workbook. This is why Vantage monitors appear in webhook payloads when a global webhook URL is configured — they are real condition monitors created and managed by Vantage, not by the user directly. If you are using a global webhook, filter by monitorName or notificationTriggerId to exclude them, or use per-monitor webhook URLs to avoid receiving Vantage-generated payloads altogether.
Via the API
The condition monitor API allows you to create a single monitor that watches hundreds or thousands of conditions at once. This is the pattern used at scale, for example when monitoring an entire asset fleet for anomalies. If you are building a webhook integration that needs to cover many conditions, the API is the right entry point, not the notification dialog.
Webhooks
How webhooks work
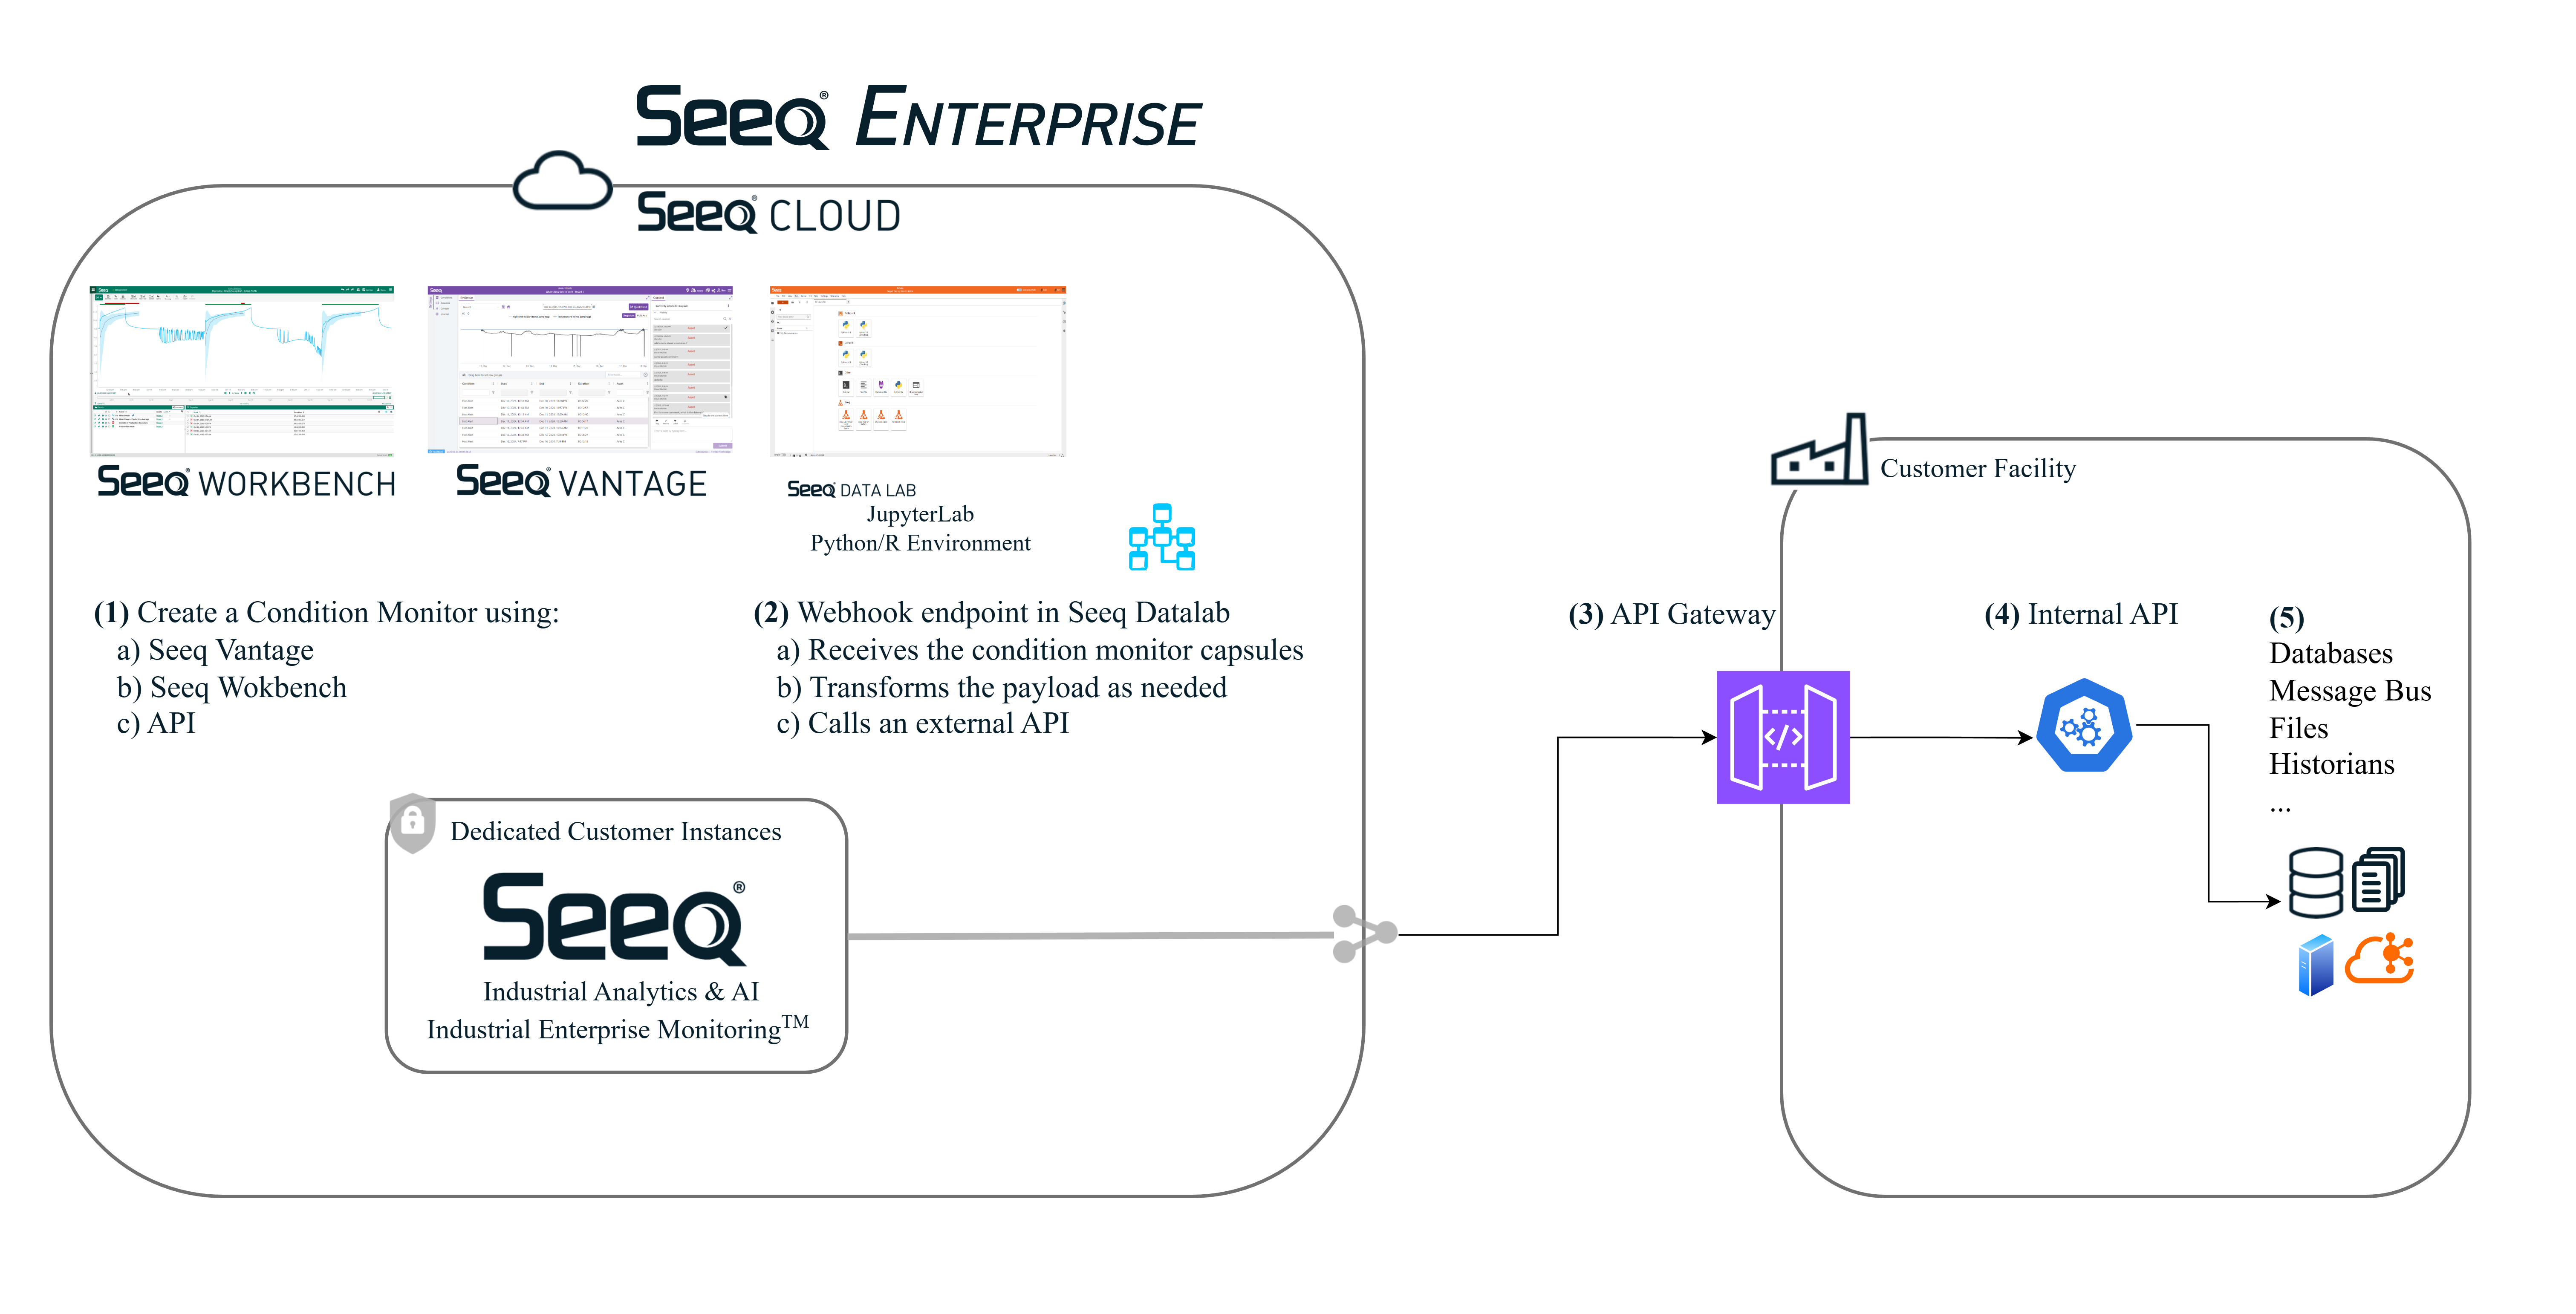
A webhook is an HTTP POST that Seeq sends to an endpoint you define whenever a condition monitor detects qualifying capsule events. The Seeq payload schema is fixed. What varies is what the destination system expects. Slack requires block kit JSON, SAP expects a different structure, Azure might want rows written to a storage account. Because Seeq owns the payload schema and you own the destination, the transformation logic between the two is the customer's responsibility to develop and maintain.
License requirement: Webhook functionality requires an Enterprise license. Contact your Seeq account team to confirm eligibility. Without the required license, attempting to configure a webhook returns: "Please contact Seeq Support for information on licensing to enable Condition Monitor Webhook."
Webhooks Dataflow
The transformation layer
A Data Lab Function is required as the middleware between Seeq and your destination system. When the condition monitor fires, Seeq POSTs the payload to the Data Lab Function endpoint. The function code handles everything from there: parsing the capsule events, applying any filtering or enrichment logic, reformatting the data, and calling the destination API.
This gives you full control over the output format without any constraints imposed by Seeq. The same condition monitor payload can be transformed differently for different destinations by configuring different webhook URLs pointing to different functions. When the endpoint is hosted in Data Lab, use a relative URL (beginning with /data-lab/...).
Payload structure
Each POST to your Data Lab Function endpoint contains the following JSON structure:
{
  "monitorName": "string",
  "notificationConfiguration": { ... },
  "batch": {
    "id": "string",
    "total": number,
    "number": number,
    "stats": {
      "conditionCount": number,
      "capsuleCount": number
    }
  },
  "results": [
    {
      "conditionName": "string",
      "hasMoreCapsules": boolean,
      "errors": ["string"],
      "capsuleEvents": [ ... ]
    }
  ]
}
Top-level fields
|
Field |
Description |
|---|---|
|
|
Name of the condition monitor |
|
|
Monitor configuration metadata |
|
|
Metadata about this request within the current run |
|
|
Array of per-condition results |
Batch metadata
|
Field |
Description |
|---|---|
|
|
Unique identifier for this monitor run in the format |
|
|
The item number of this request within the run (1-based) |
|
|
The total number of items in this run |
|
|
Number of conditions included in this request |
|
|
Total capsule events across all conditions in this request |
Note: The recommended pattern for consuming batch metadata in a Data Lab Function is still being developed. Do not rely on batch.number == batch.total as a signal for the final request until this guidance is published.
Results array
|
Field |
Description |
|---|---|
|
|
Name of the monitored condition |
|
|
Whether capsule results for this condition were paginated and more remain |
|
|
Array of error messages if the condition failed to evaluate |
|
|
Array of capsule event objects |
Capsule event structure
{
  "conditionGuid": "xxxxxxxx-xxxx-xxxx-xxxx-xxxxxxxxxxxx",
  "type": "NEW | BECAME_CERTAIN | STILL_UNCERTAIN | EXTINCT",
  "id": "string",
  "start": { "type": "LONG", "uom": "nanoseconds", "value": 1672531200000000000 },
  "end": { "type": "LONG", "uom": "nanoseconds", "value": 1672617599000000000 },
  "updatedAt": { "type": "LONG", "uom": "nanoseconds", "value": 1704067200000000000 },
  "isUncertain": boolean,
  "isBounded": boolean,
  "isSuppressed": boolean,
  "capsuleIdProperty": "start | end | null",
  "propertyNames": ["string"],
  "properties": {
    "propertyName": {
      "type": "BOOLEAN | DOUBLE | LONG | STRING",
      "uom": "string",
      "value": "..."
    }
  }
}
|
Field |
Description |
|---|---|
|
|
UUID of the condition that generated this capsule |
|
|
Event type: |
|
|
Unique capsule identifier, typically the start or end timestamp as a string |
|
|
Capsule boundaries in nanoseconds since epoch, wrapped in a typed value object. Can be null for unbounded capsules |
|
|
Timestamp when this event was generated |
|
|
Whether the capsule boundaries are still uncertain |
|
|
Whether the capsule has both a start and end boundary |
|
|
Whether this event was suppressed. Suppressed events are filtered before delivery |
|
|
Which property is used as the capsule identifier ( |
|
|
List of custom capsule property names |
|
|
Map of custom capsule properties with typed values |
Note: All timestamps are in nanoseconds since epoch and are wrapped in a value object with type and uom fields. Parse accordingly rather than treating them as bare integers.
Example payload
{
  "monitorName": "High Temperature Monitor",
  "batch": {
    "id": "a1b2c3d4-1234-5678-9abc-def012345678_1704067200000",
    "total": 3,
    "number": 1,
    "stats": { "conditionCount": 2, "capsuleCount": 5 }
  },
  "results": [
    {
      "conditionName": "Temperature > 100",
      "hasMoreCapsules": false,
      "errors": [],
      "capsuleEvents": [
        {
          "start": { "type": "LONG", "uom": "nanoseconds", "value": 1672531200000000000 },
          "end": { "type": "LONG", "uom": "nanoseconds", "value": 1672617599000000000 },
          "conditionGuid": "12345678-1234-5678-1234-567812345678",
          "type": "NEW",
          "isUncertain": true,
          "isBounded": true,
          "isSuppressed": false,
          "capsuleIdProperty": "start",
          "propertyNames": ["temperature"],
          "properties": {
            "temperature": { "type": "DOUBLE", "uom": "C", "value": 105.3 }
          },
          "id": "1672531200000000000"
        }
      ]
    }
  ]
}
Webhook URL configuration
Global webhook
Set one endpoint URL that receives notifications from all condition monitors on the server:
Administrator Panel:
Features > Notifications > ConditionMonitors > OutgoingWebhookUrl
This is the simplest configuration. The trade-off is that your endpoint receives everything — including Vantage-managed monitors — and must contain its own routing logic if different monitors should produce different outputs.
Per-monitor webhook
Assign a webhook URL directly to a specific condition monitor via the API:
POST /api/condition-monitors/{id}
Content-Type: application/vnd.seeq.v1+json

{
  "name": "My Monitor Name",
  "webhookUrl": "/data-lab/{project_uuid}/functions/notebooks/{notebook_name}/endpoints/{endpoint_path}"
}
This is the preferred approach when only specific monitors should trigger external actions, or when different monitors should route to different destinations. Per-monitor webhook URLs were introduced in R65 and take precedence over the global URL for that monitor.
Batching and delivery behavior
Batching
Condition monitors process and deliver results in batches of conditions per run. If a monitor watches many conditions, Seeq sends multiple sequential POST requests to your endpoint within a single run. Each POST includes a batch object with metadata about the run. All requests for a single run share the same batch.id.
Retry behavior
If your endpoint returns an error or times out, Seeq retries the request with exponential backoff (between 1 and 30 seconds) for up to 2 minutes before giving up. Design your endpoint to be idempotent so that retried deliveries do not produce duplicate downstream actions.
Recommended endpoint pattern
For most integrations, processing each incoming request synchronously is straightforward and appropriate. If you are monitoring a large number of conditions or expect a high volume of capsule events per run, synchronous in-memory processing risks exhausting the Data Lab pod before all requests in the run have arrived. In those cases, writing each payload to a file or queue as it arrives and processing asynchronously is the safer approach. The recommended pattern for using batch metadata to coordinate this is still being developed.
Pagination and uncertain capsules
For unbounded conditions, Seeq extends the query interval backward to the earliest uncertain capsule start time on each run to ensure all uncertain capsules are re-evaluated. When capsule results for a condition exceed the internal pagination limit, hasMoreCapsules is set to true on that result. In this case, EXTINCT events are suppressed for that run because the monitor cannot confirm whether a missing capsule truly disappeared or simply fell outside the query limit. EXTINCT is only emitted when hasMoreCapsules is false, meaning the query returned all available capsules and any absence is definitive.
Egress rules for SaaS deployments
Starting with Seeq release 2025-11-18, outbound network access from Data Lab is restricted by default. If your Data Lab Function needs to call an external system such as Slack, Teams, Azure, or SAP, that hostname must be explicitly added to your tenant's egress allowlist before it will be reachable.
Default allowed hosts
|
Host |
Purpose |
|---|---|
|
pypi.org, files.pythonhosted.org |
Python package installation |
|
seeq.jfrog.io |
Seeq add-ons |
|
github.com |
Package sources |
|
usage.seeq.com, telemetry.seeq.com |
Seeq Champions Dashboard |
|
cloud.r-project.org |
R package installation |
Request an egress rule change
-
Open a support ticket at https://support.seeq.com
-
Include "Seeq Data Lab egress allowlist" in the ticket subject so it is routed correctly
-
Provide the hostname, port, and protocol needed (example:
hooks.slack.com, port 443, HTTPS)
Seeq Support configures the rule on your behalf. Changes take effect dynamically without a restart.
Note: Only port 443 (HTTPS) is currently supported for egress host rules.
Implement a Slack integration
This procedure walks through configuring a condition monitor webhook that sends capsule event notifications to a Slack channel. The same steps apply to any destination; only the Data Lab Function code and the egress allowlist entry change.
Prerequisites
-
A Seeq Enterprise license with condition monitor webhooks enabled
-
Administrator access to the Seeq server
-
A Seeq Data Lab project
-
A Slack workspace where you can create apps
Enable notifications
Features > Notifications > ConditionMonitors > Enabled
Create a condition monitor
For simple cases, you can create a condition monitor through the Workbench notification UI. For webhook integrations, especially those monitoring many conditions, you will typically create the condition monitor via the API directly.
See Notifications on Conditions for the Workbench UI approach.
Creating a condition monitor via the API
POST /api/condition-monitors
Content-Type: application/vnd.seeq.v1+json

{
  "name": "High Temperature Monitor",
  "conditionIds": ["condition-uuid-1", "condition-uuid-2"],
  "queryRangeLookAhead": 0,
  "cronSchedule": ["0 0/15 * 1/1 * ? *"],
  "timezone": "US/Central",
  "enabled": true,
  "capsuleEventTypes": ["NEW", "BECAME_CERTAIN", "EXTINCT"],
  "scopedTo": "workbook-uuid",
  "webhookUrl": "/data-lab/{project_uuid}/functions/notebooks/{notebook_name}/endpoints/{endpoint_path}"
}
Field reference
|
Field |
Required |
Description |
|---|---|---|
|
|
Yes |
Display name for the condition monitor |
|
|
Yes |
Array of condition UUIDs to monitor. A single monitor can watch hundreds or thousands of conditions |
|
|
Yes |
Array containing a single Quartz cron expression defining when the monitor runs. See below |
|
|
Yes |
Timezone for interpreting the cron schedule (e.g. |
|
|
Yes |
Set to |
|
|
No |
Event types to emit. Defaults to |
|
|
No |
Extends the query window forward in time beyond the current run time, in ISO 8601 duration format (e.g. |
|
|
No |
Relative URL of the Data Lab Function endpoint to call when capsule events are detected |
|
|
No |
UUID of a workbook to scope this condition monitor to |
Cron schedule format
Seeq uses Quartz cron expressions, which are 6 or 7 fields rather than the standard 5-field Unix cron format:
Seconds Minutes Hours Day-of-month Month Day-of-week [Year]
This trips up many users familiar with standard cron syntax. Quartz includes a seconds field at the start, and requires either Day-of-month or Day-of-week to be ?.
|
Schedule |
Quartz expression |
|---|---|
|
Every 15 minutes |
|
|
Every hour |
|
|
Every day at midnight UTC |
|
Note: The cronSchedule field takes an array even though only one expression is used. Always wrap the expression in an array: ["0 0/15 * 1/1 * ? *"].
Build the Data Lab Function
In Data Lab, create a new project and add a notebook that will serve as the webhook receiver. The notebook must expose a POST endpoint via Data Lab Functions.
# POST /condition_monitors_webhook
import json
import requests
from datetime import datetime, timezone

SLACK_WEBHOOK_URL = "https://hooks.slack.com/services/YOUR/SLACK/WEBHOOK"

def format_timestamp(ts_obj):
    if ts_obj is None:
        return "unbounded"
    ns = ts_obj.get("value", 0)
    dt = datetime.fromtimestamp(ns / 1e9, tz=timezone.utc)
    return dt.strftime("%Y-%m-%d %H:%M:%S UTC")

# REQUEST is provided by the Data Lab Functions runtime
body = json.loads(REQUEST["body"])

monitor_name = body.get("monitorName", "Unknown monitor")
batch = body.get("batch", {})
results = body.get("results", [])

lines = [f"*{monitor_name}*"]
lines.append(f"Batch {batch.get('number', '?')} of {batch.get('total', '?')}")

for result in results:
    condition_name = result.get("conditionName", "Unknown condition")
    for event in result.get("capsuleEvents", []):
        event_type = event.get("type", "")
        start = format_timestamp(event.get("start"))
        end = format_timestamp(event.get("end"))
        lines.append(f"  [{event_type}] {condition_name} | {start} to {end}")
        for key, val_obj in event.get("properties", {}).items():
            lines.append(f"    {key}: {val_obj.get('value', '')} {val_obj.get('uom', '')}")

message = {"text": "\n".join(lines)}
requests.post(SLACK_WEBHOOK_URL, json=message)

RESPONSE.status = 200
To adapt this for a different destination, replace the requests.post(SLACK_WEBHOOK_URL, ...) call with whatever API call your destination system requires, and reformat message to match the expected payload structure.
Construct the endpoint URL
/data-lab/{project_uuid}/functions/notebooks/{notebook_name}/endpoints/{endpoint_path}
For a notebook named slack_webhook with an endpoint named condition_monitors_webhook:
/data-lab/0EDAD435-D158-F960-96AF-83BDD0A49A29/functions/notebooks/slack_webhook/endpoints/condition_monitors_webhook
Create a Slack app
Register the endpoint
Execute the registration cell in your notebook once. This is a one-time step per project.
Configure the webhook URL
Route all condition monitors to this endpoint:
Features > Notifications > ConditionMonitors > OutgoingWebhookUrl
Route a specific condition monitor to this endpoint:
POST /api/condition-monitors/{id}
Content-Type: application/vnd.seeq.v1+json

{
  "name": "My Monitor Name",
  "webhookUrl": "/data-lab/{project_uuid}/functions/notebooks/slack_webhook/endpoints/condition_monitors_webhook"
}
Request an egress allowlist update
Open a support ticket referencing "Seeq Data Lab egress allowlist" and provide: Hostname hooks.slack.com, port 443, protocol HTTPS.
Example output
*High Temperature Monitor*
Batch 1 of 3
  [NEW] Temperature > 100 | 2024-01-01 08:00:00 UTC to 2024-01-01 09:00:00 UTC
    temperature: 105.3 C