Treemap
Overview
Treemap is a monitoring tool that may be leveraged by those that use an asset tree structure, such as PI Asset Framework. Treemap compares a plant's similar assets and identifies when user specified conditions occur. This tool allows users to quickly gauge the performance of an asset relative to other, similar assets.
Interpreting Treemap
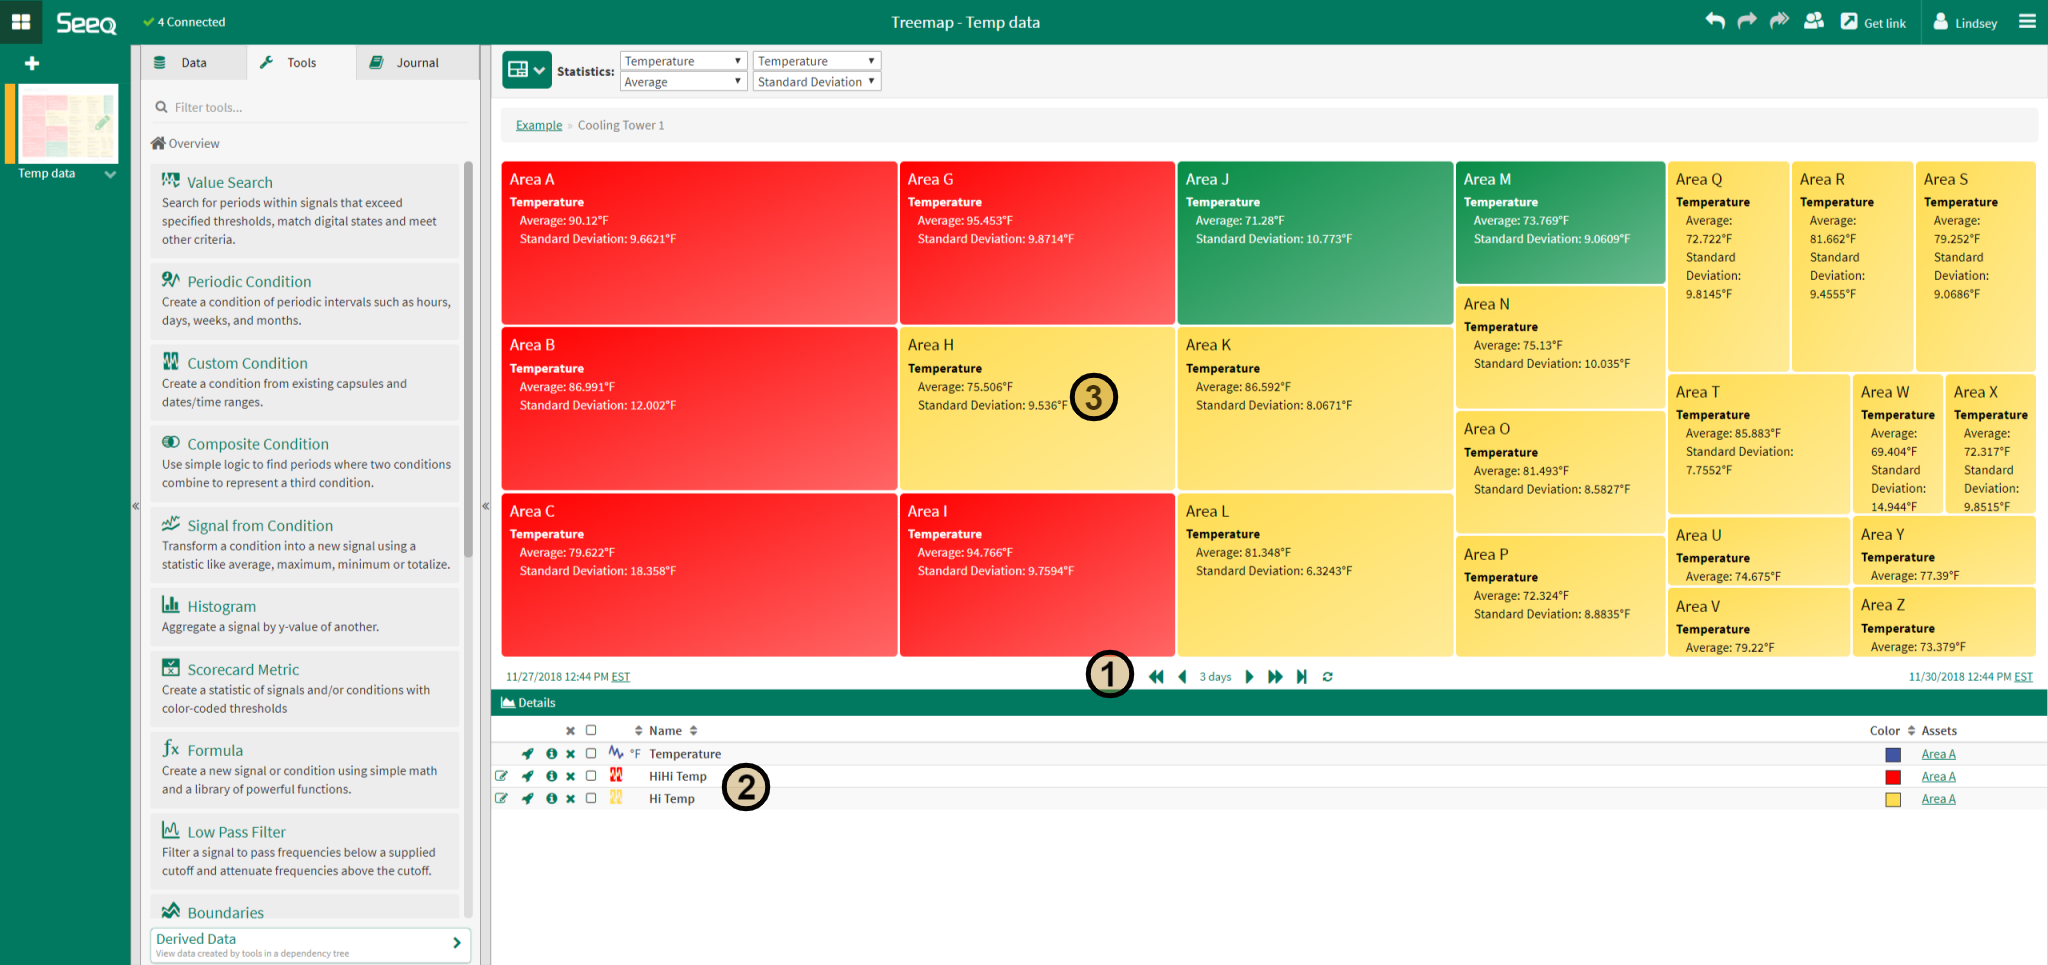
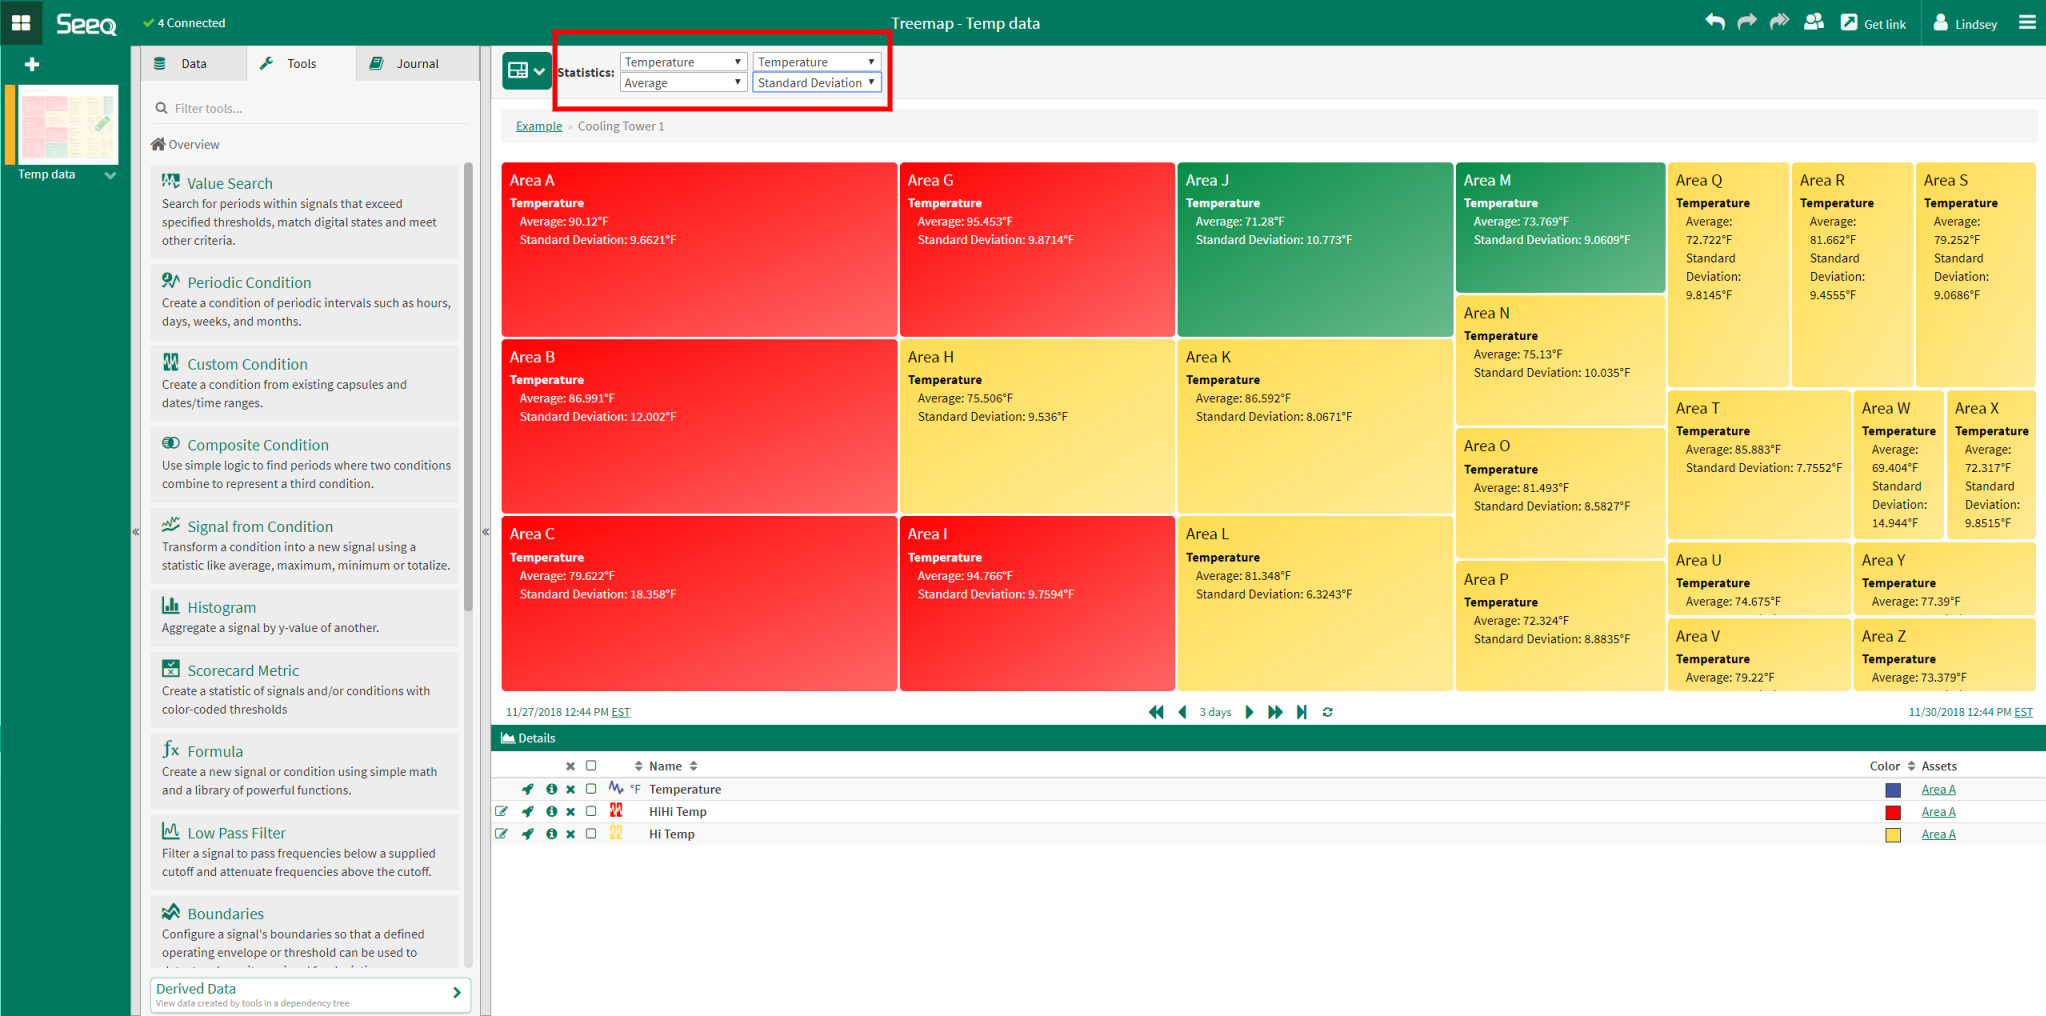
The image to the left shows an example of a Treemap created in Seeq. As shown in this image, each similar asset is displayed as a separate box. By default, the size of each box is determined by the number of assets, but may be manually adjusted via the API.
The color of the box indicates if a condition has occurred over the course of the Display Range (1). Adjusting the display range adjusts the results displayed in the Treemap.
The conditions and their corresponding priority color are listed in the Details Pane (2). If multiple conditions have occurred over the course of the display range, the color of the highest priority condition is displayed. If no conditions are detected, the color of the box is set to the default green.
Statistics for each signal may also be displayed in each asset's box, as indicated by the user (3).
Steps for Creating a Treemap
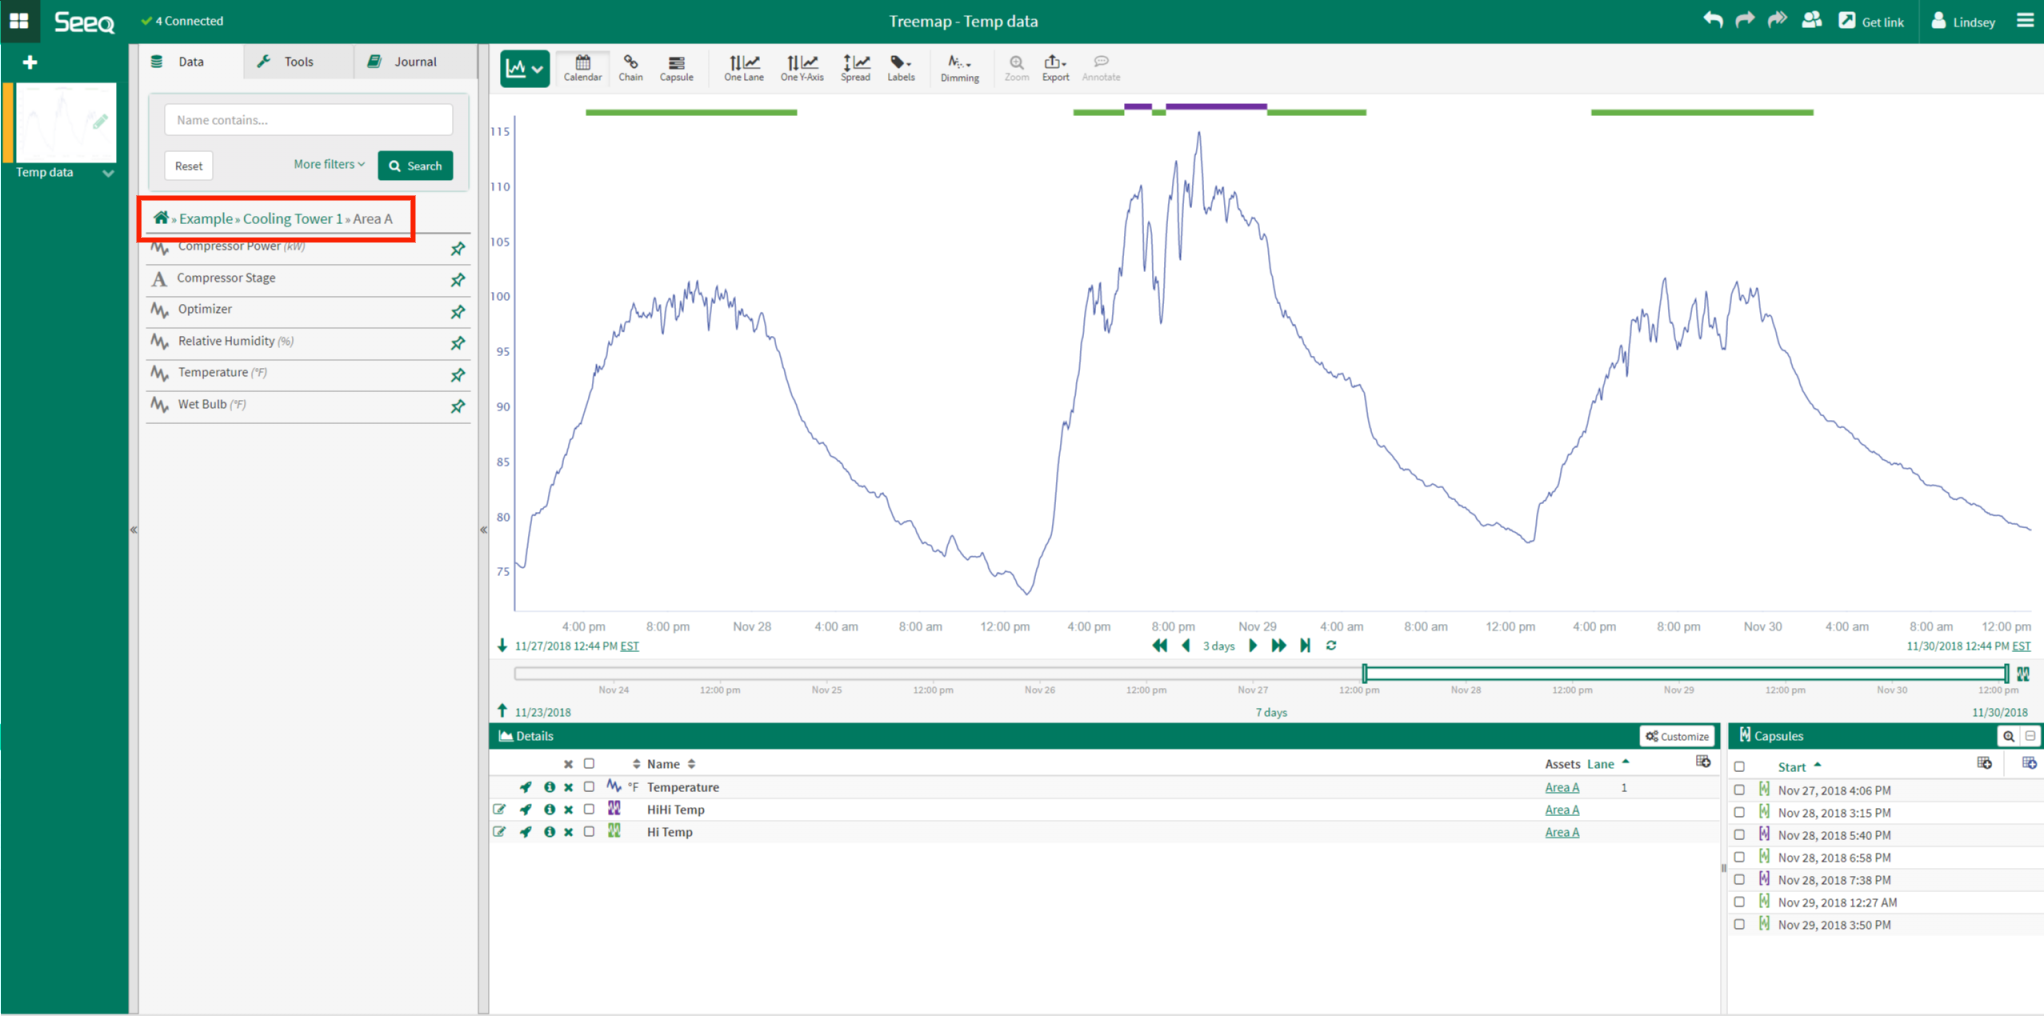
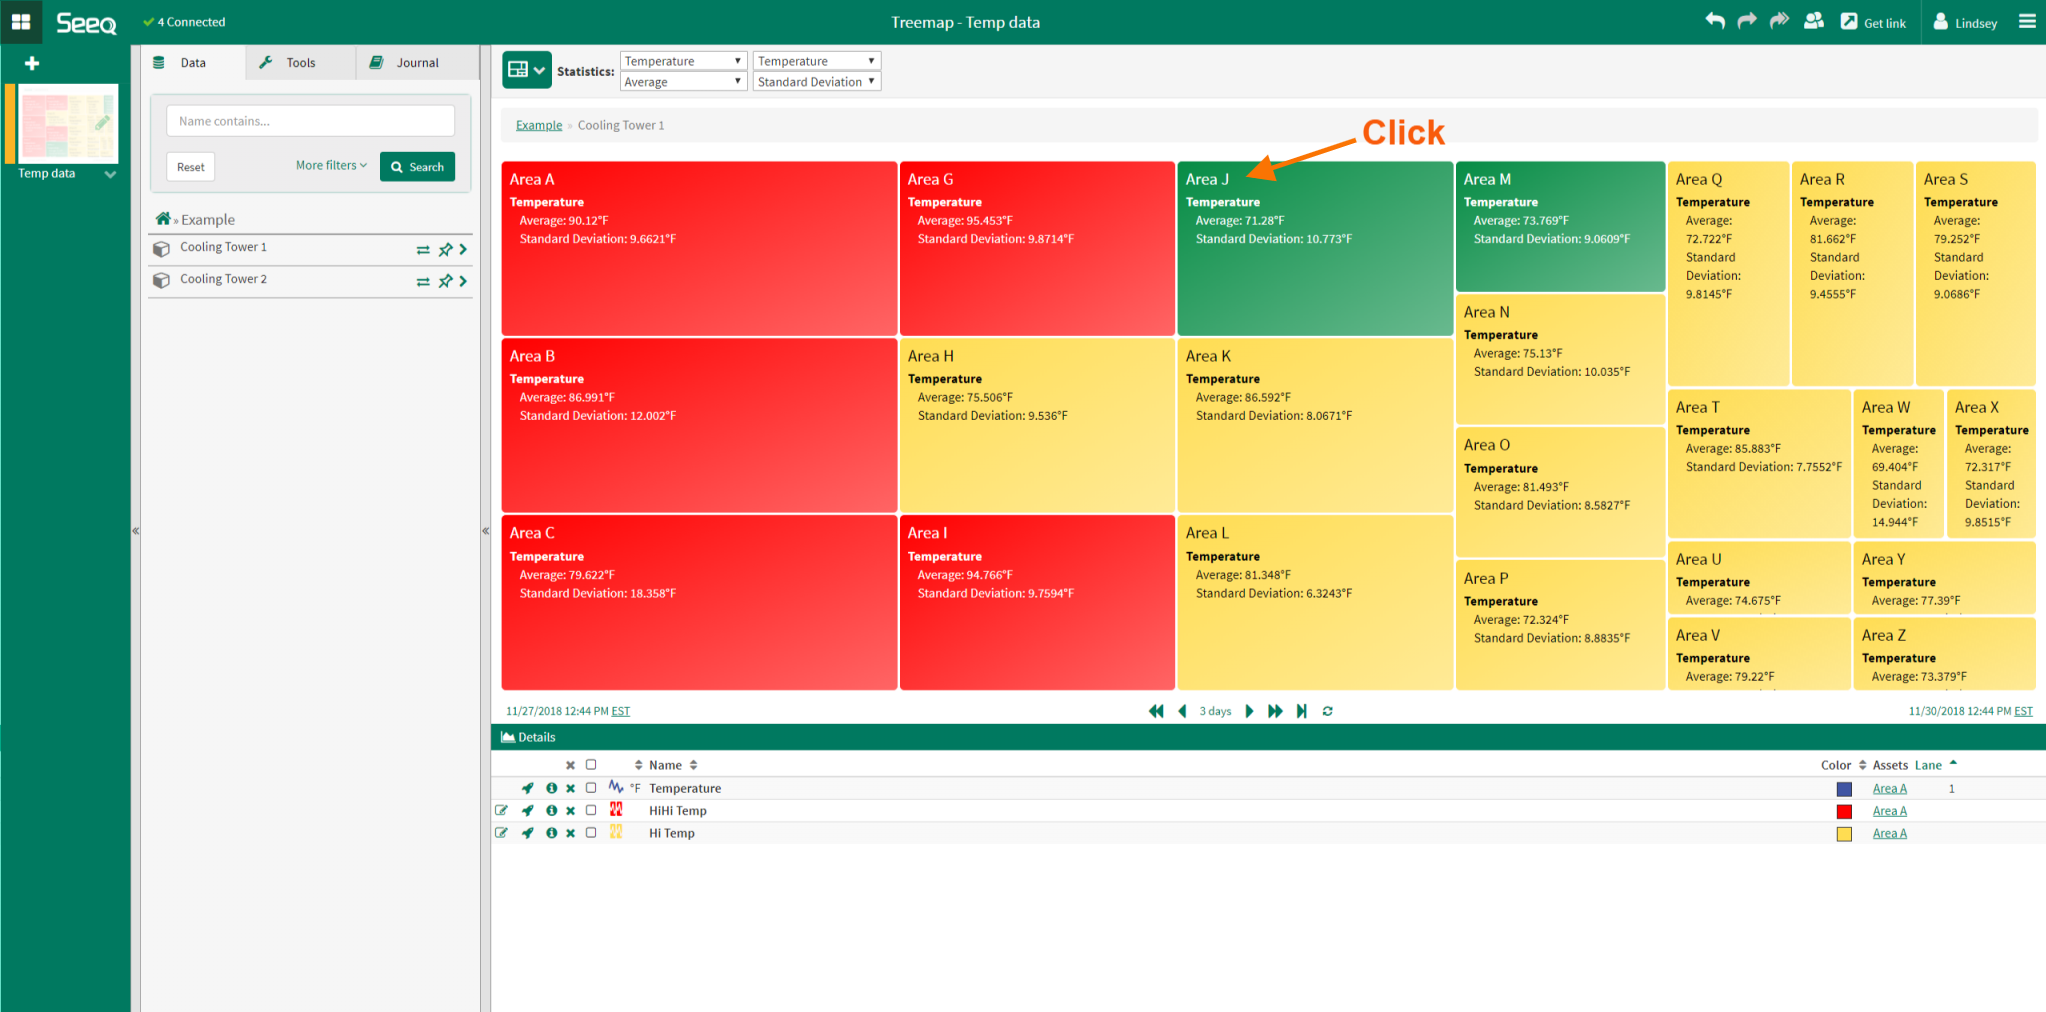
1. To create a Treemap, at least one condition must be specified in the Details Pane. The example to the right shows a Temperature signal with two conditions representing high temperature (Hi Temp) and high high temperature (HiHi Temp).
Note: The selected Temperature signal is part of an asset tree with the following structure: Example > Cooling Tower 1 > Area A > Temperature (shown in red box). The Hi Temp and HiHi Temp conditions were created based upon the value of this Temperature signal. When the Treemap is created, it will compare assets similar to Area A that also having a signal called Temperature.
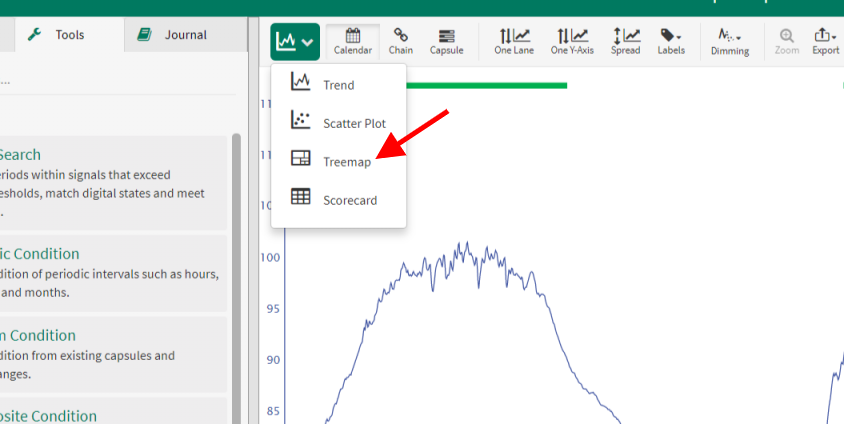
2. From the Trend view, users can easily navigate to Treemap from the drop-down menu above the trend.
3. Select the appropriate priority color for each condition listed in the Details Pane. Treemap will not generate until a color is specified for all conditions.
Note: The color red indicates the highest priority, then yellow and finally blue with the lowest priority.
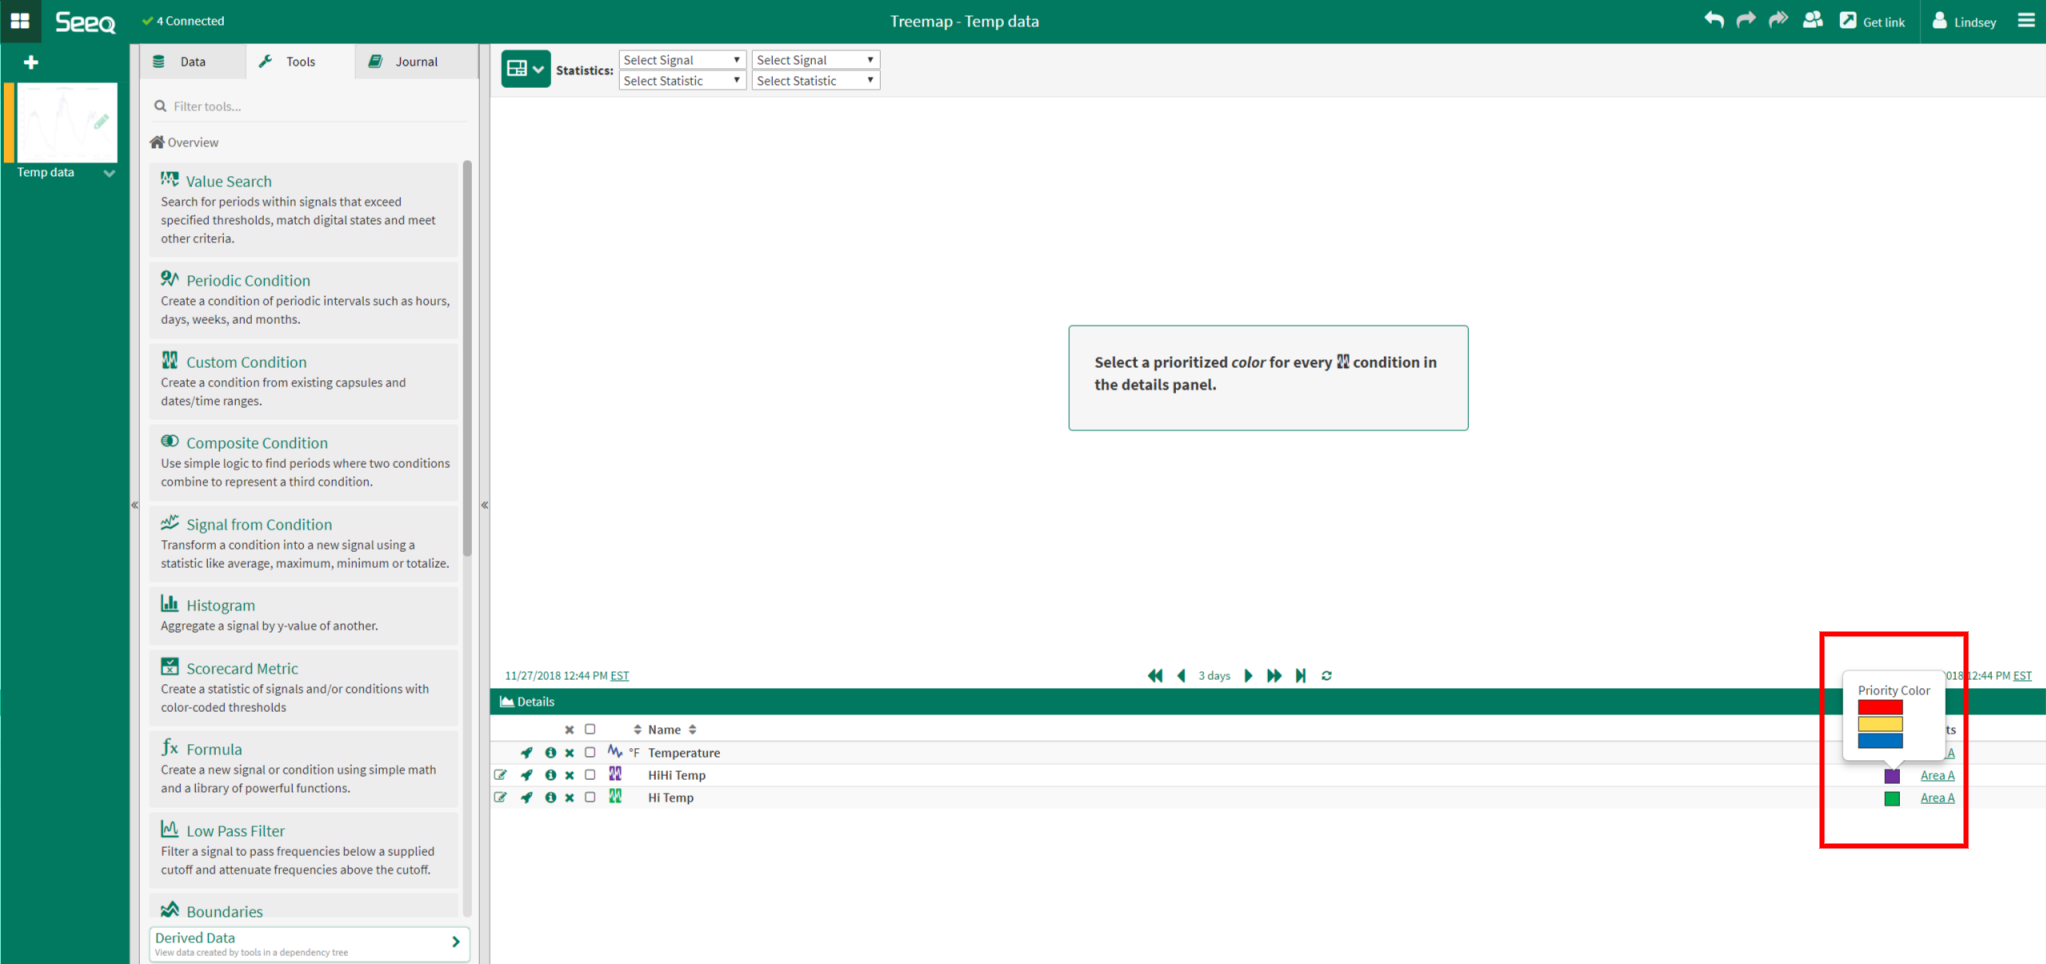
4. If desired, the user can select a signal and corresponding statistic to display for each asset in the Treemap. The statistics are calculated over the display range.
Note: In order to calculate and display a statistic on a signal, the signal must be listed in the Details Pane.
Navigation
The Treemap contains links to enable users to navigate to different views.
In the Treemap to the right, users can click on each of the boxes to navigate to the trend for each asset.

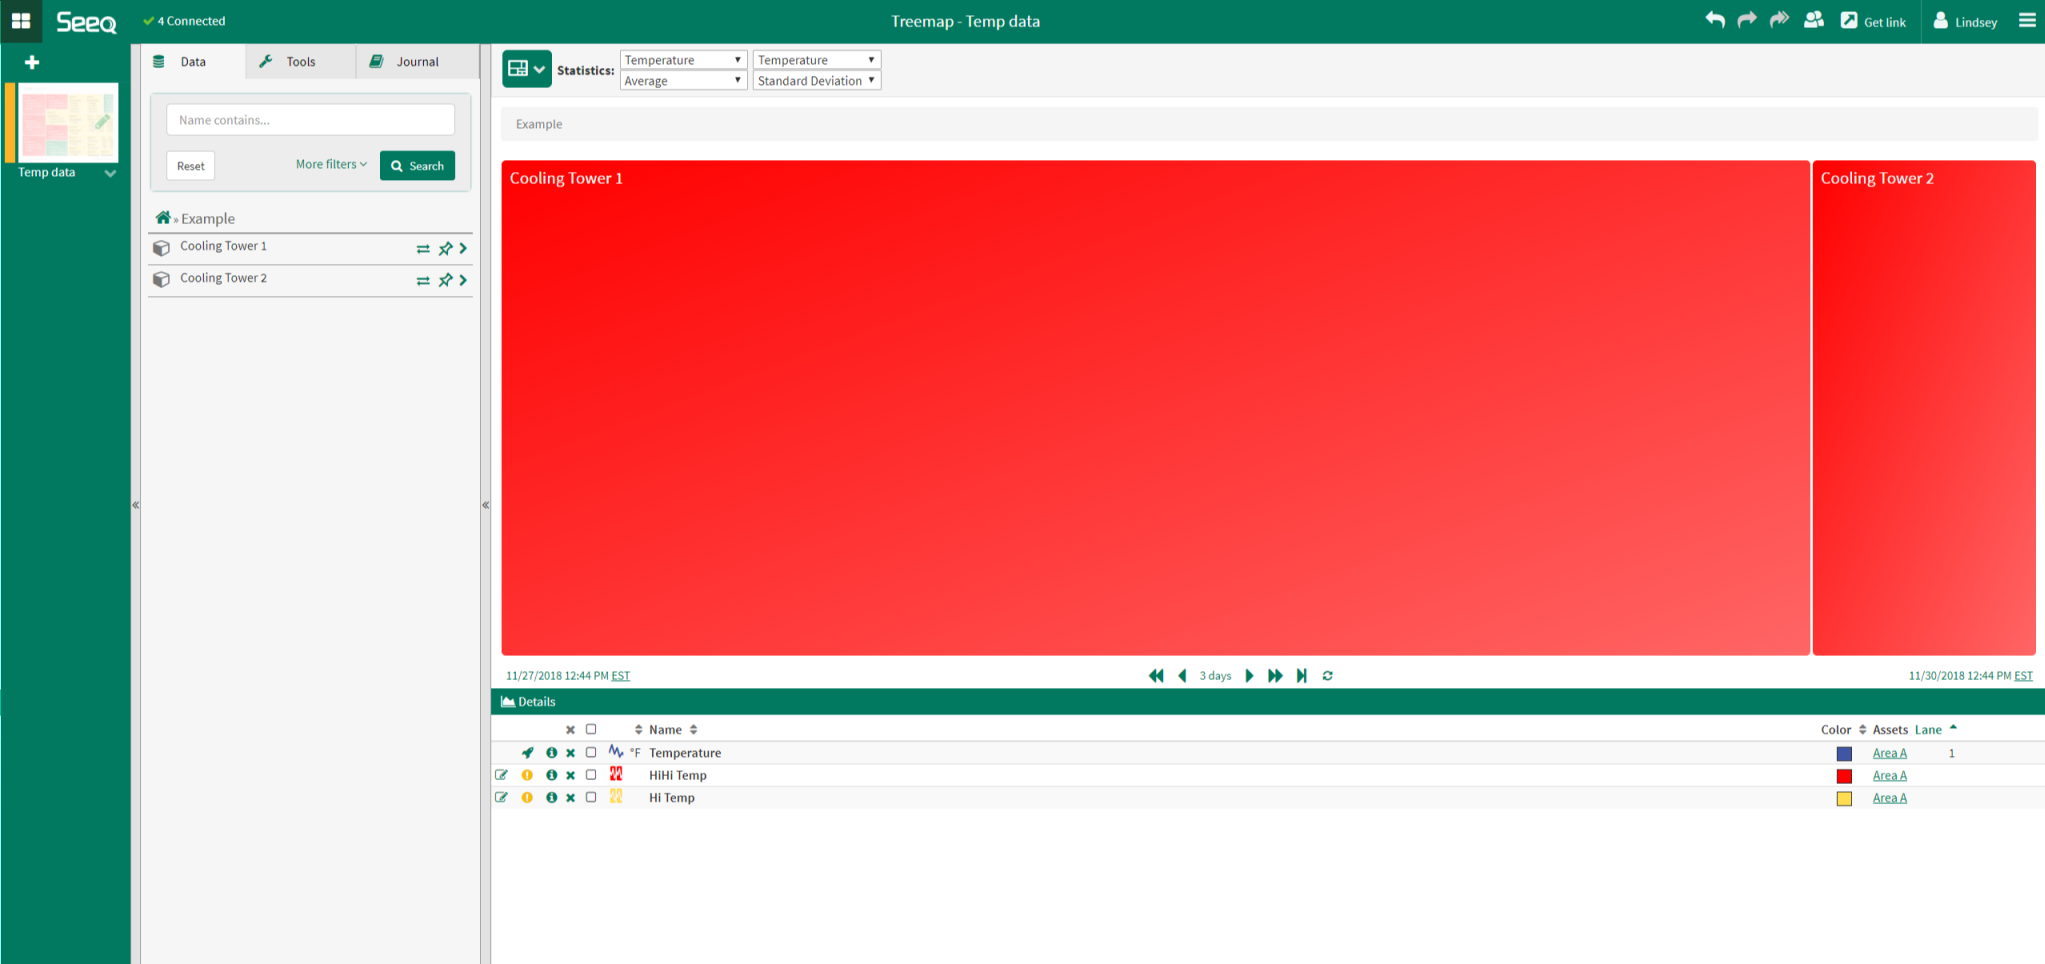
Users can also navigate to a different level in the asset tree.
In the image to the left, clicking on "Example" navigates to the Treemap one level up. From here, users can navigate down into the Cooling Tower 1 Treemap or the Cooling Tower 2 Treemap.
Administration (Changing Default Treemap Colors)
Administrators can configure the default treemap colors by changing the value of the Features/Colors/Priorities option as described in Editing Treemap and Scorecard Metric Colors.