Overview
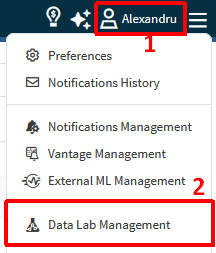
The Data Lab Management page allows you to view and perform operations related to your Data Lab projects and scheduled notebooks. Access it by clicking your username in the Seeq header and selecting “Data Lab Management.”
Schedule Notebooks
Overview
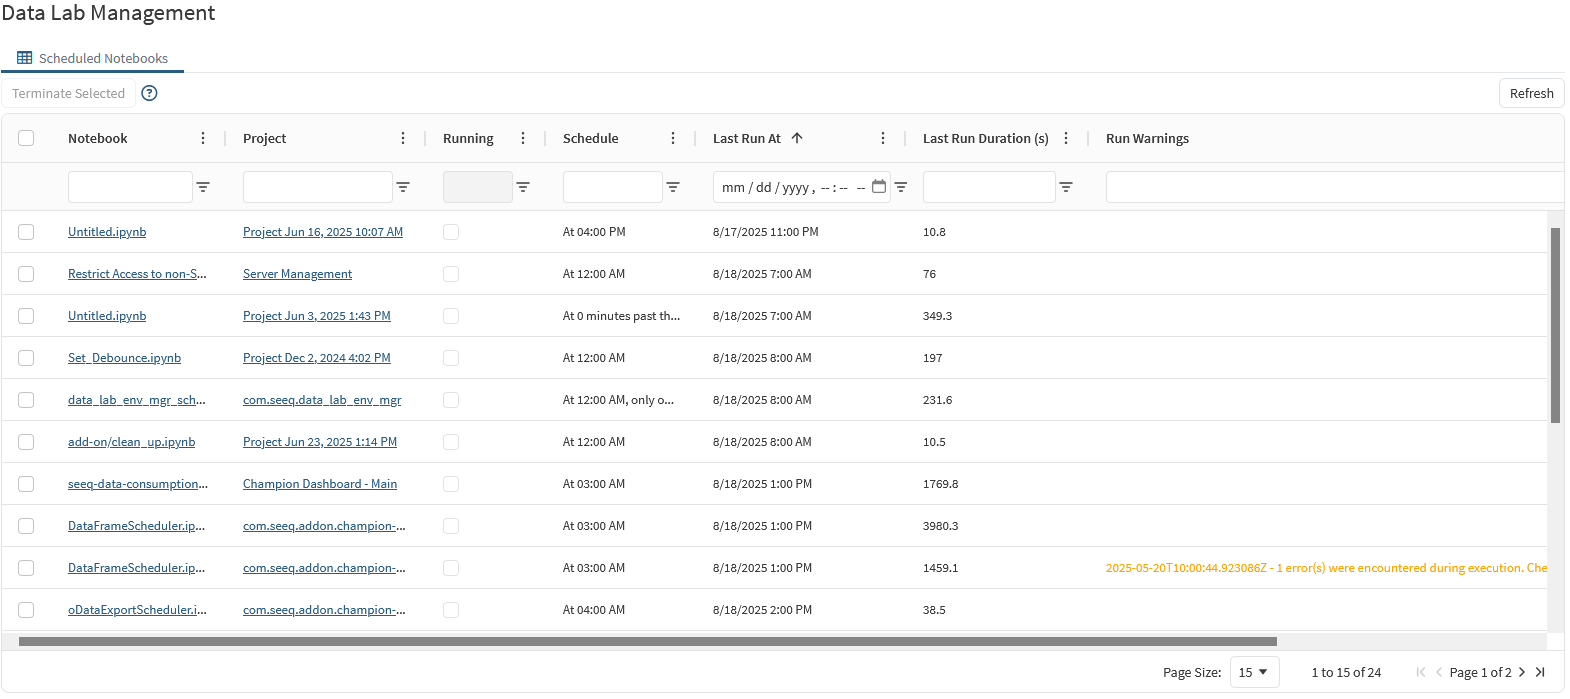
This tab shows scheduled notebooks, their status, last run duration, and any warnings or errors.
Usage
Navigate to your project by clicking the project name or directly to the notebook by clicking the notebook name.
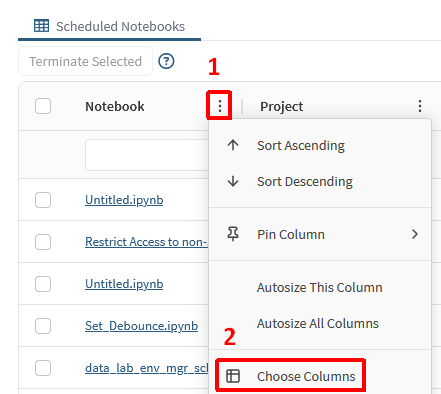
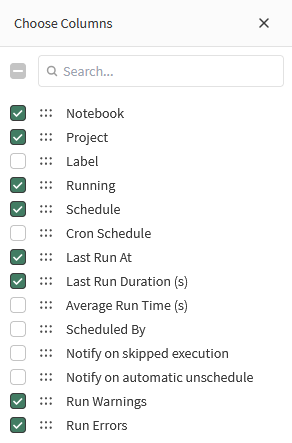
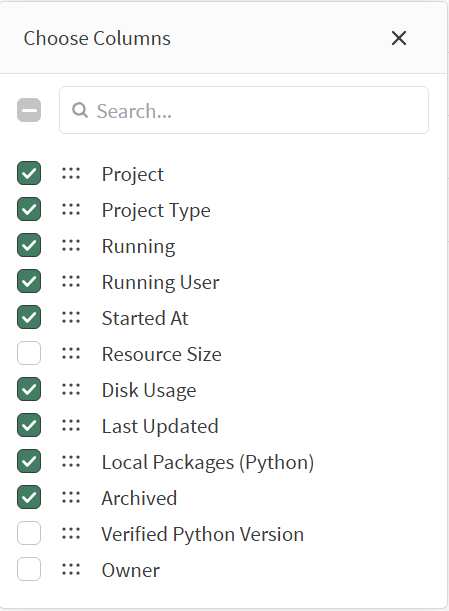
The table allows sorting and filtering to more easily find any notebook. The columns can be resized and reordered by drag-and-drop to get better visualization of your data. Note that not all the columns are displayed by default.. Click the dots next to any column name and click “Choose Columns” to configure the current view.
You can view the real‑time status of any notebook in the “Running” column. A checked box indicates that the notebook is currently executing.
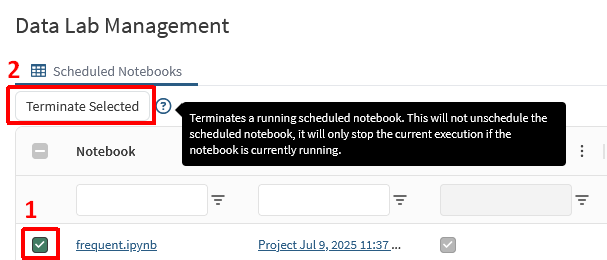
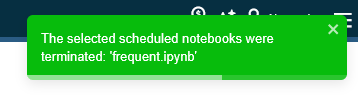
Should a notebook present problems by either executing an endless loop or taking too long, you can terminate the current execution. This does not mean unscheduling the notebook, just stopping the current execution before it completes by itself. Select the notebook which is showing as running and click “Terminate Selected”. A message that the action took place will be shown in the top right corner of the page.
Projects
Overview
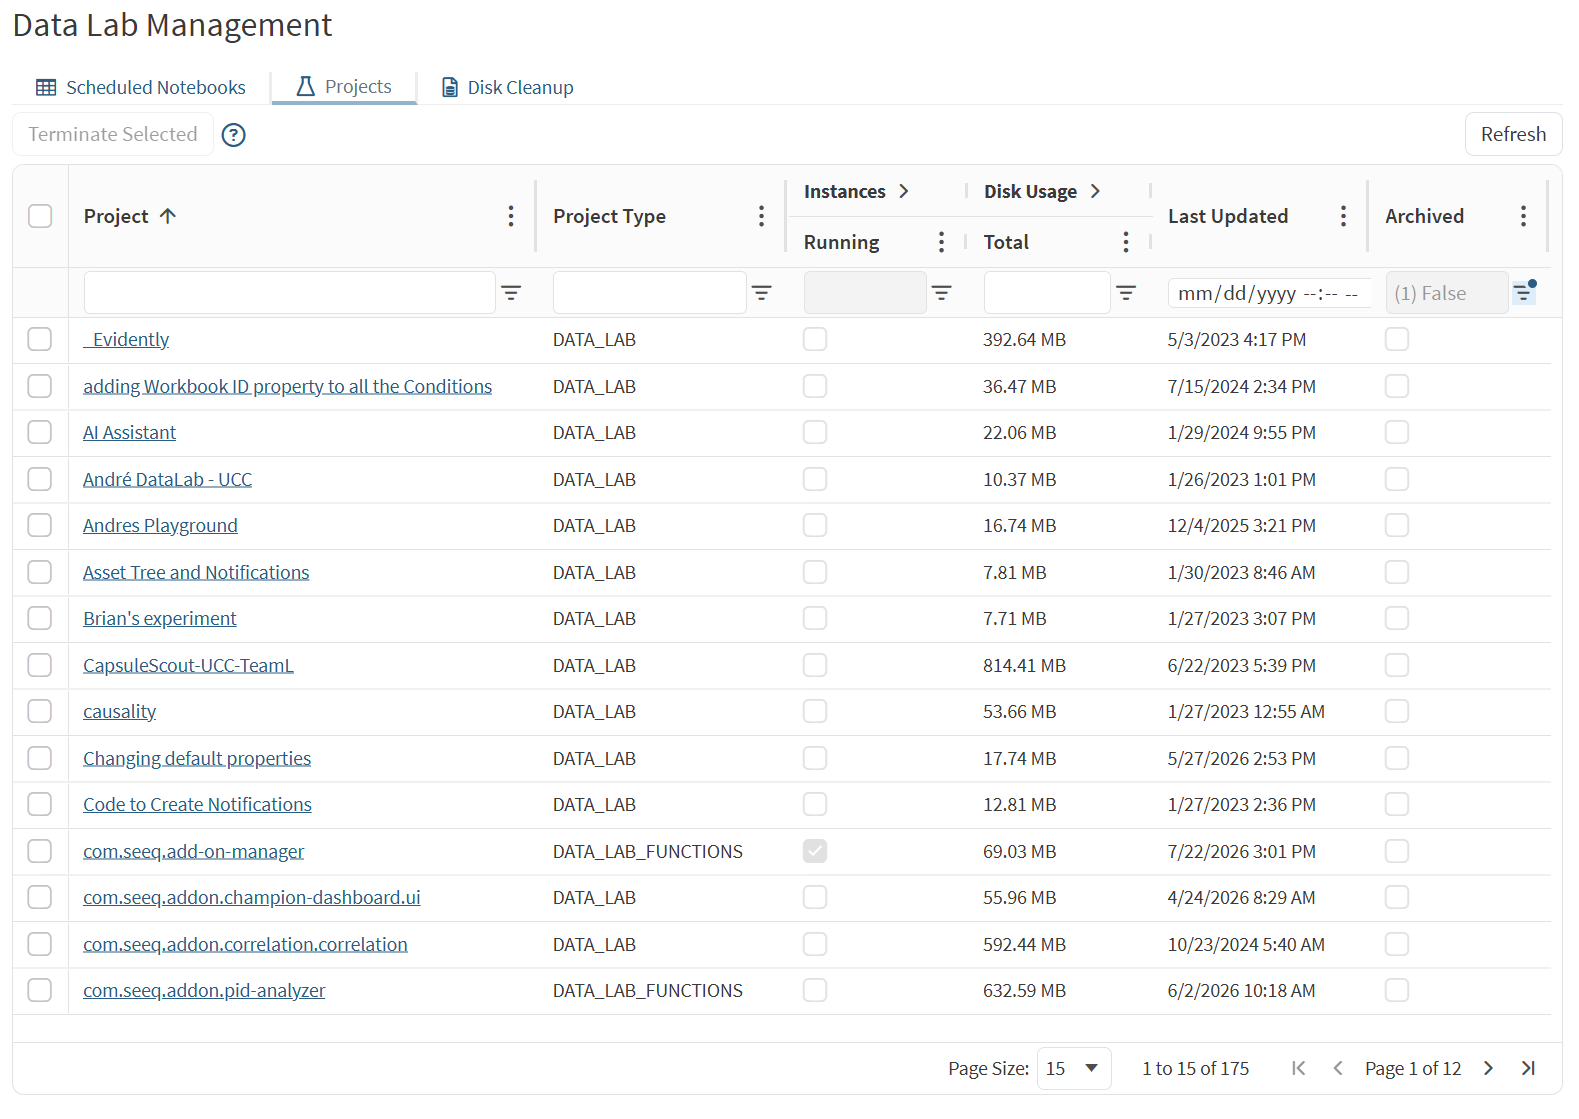
This tab displays all projects you can access, their status, and properties like disk usage, project type, last updated date and time, and local packages (Python), showing Python versions with locally installed packages.
Usage
Navigate to your project by clicking the project name.
The table allows sorting and filtering to more easily find any project. The columns can be resized and reordered by drag-and-drop to get better visualization of your data. Note that not all the columns are displayed by default.. Click the dots next to any column name and click “Choose Columns” to configure the current view.

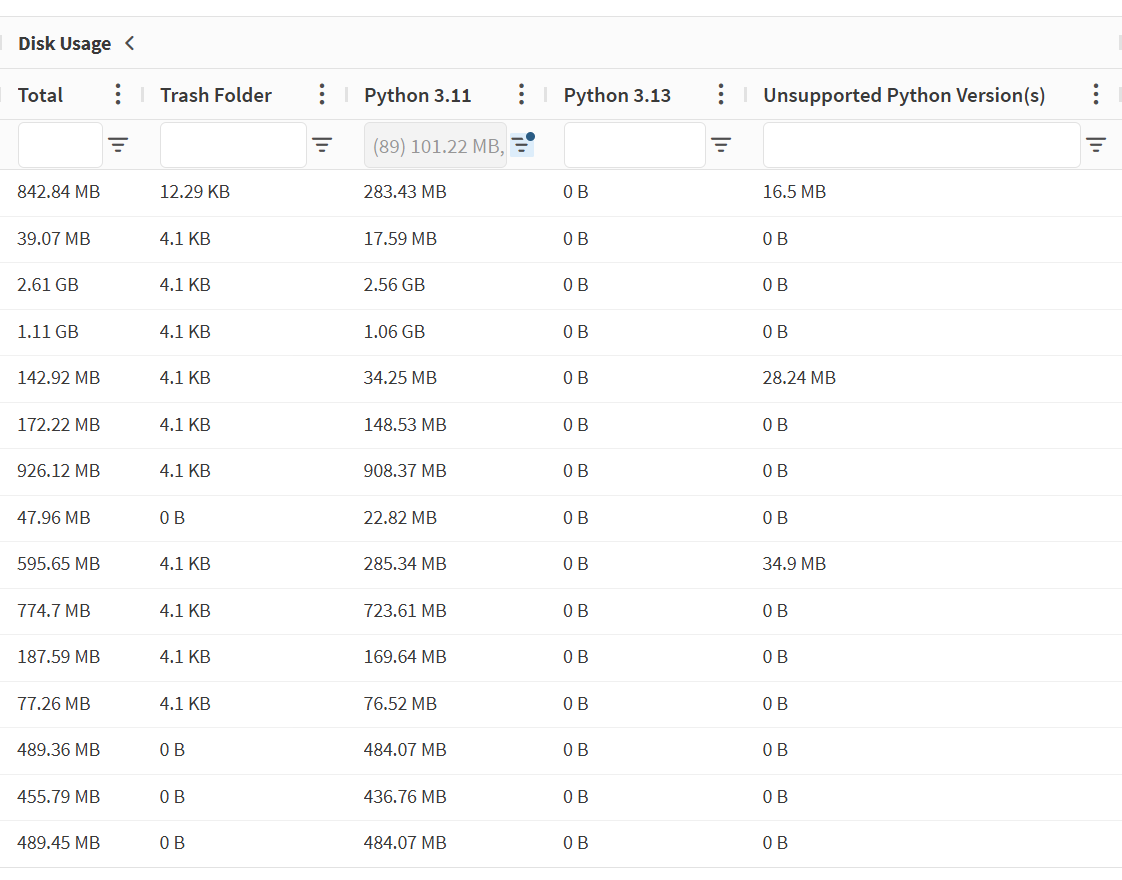
You can expand the Disk Usage section to reveal a breakdown of how much disk space is consumed by the Trash folder as well as installed Python packages from both supported and unsupported Python versions.
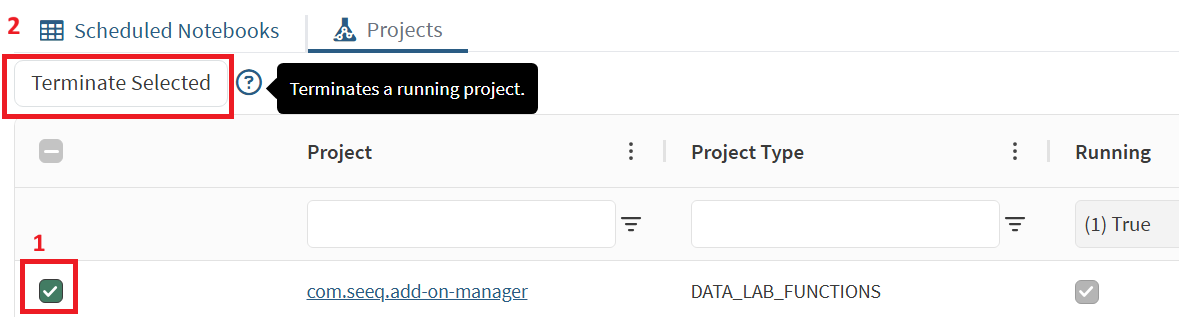
You can view the real‑time status of any project in the “Running” column. A checked box indicates that the project has a running instance. The “Running User” column informs the user name and email of the user running an instance of the project. There will be additional rows in the table if more than one user is running an instance of the project. Only admins will see project instances other than their own. If the running project has project type Data Lab Functions, then the number of active users will be shown in the “Running User” column.
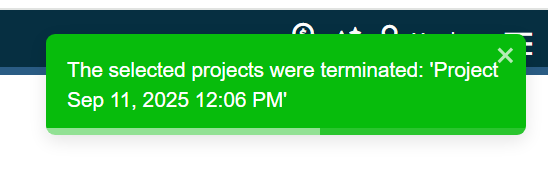
You can terminate running project instances by selecting the project(s) which are showing as running and clicking “Terminate Selected”. A message that the action took place will be shown in the top right corner of the page.
Disk Cleanup
Overview
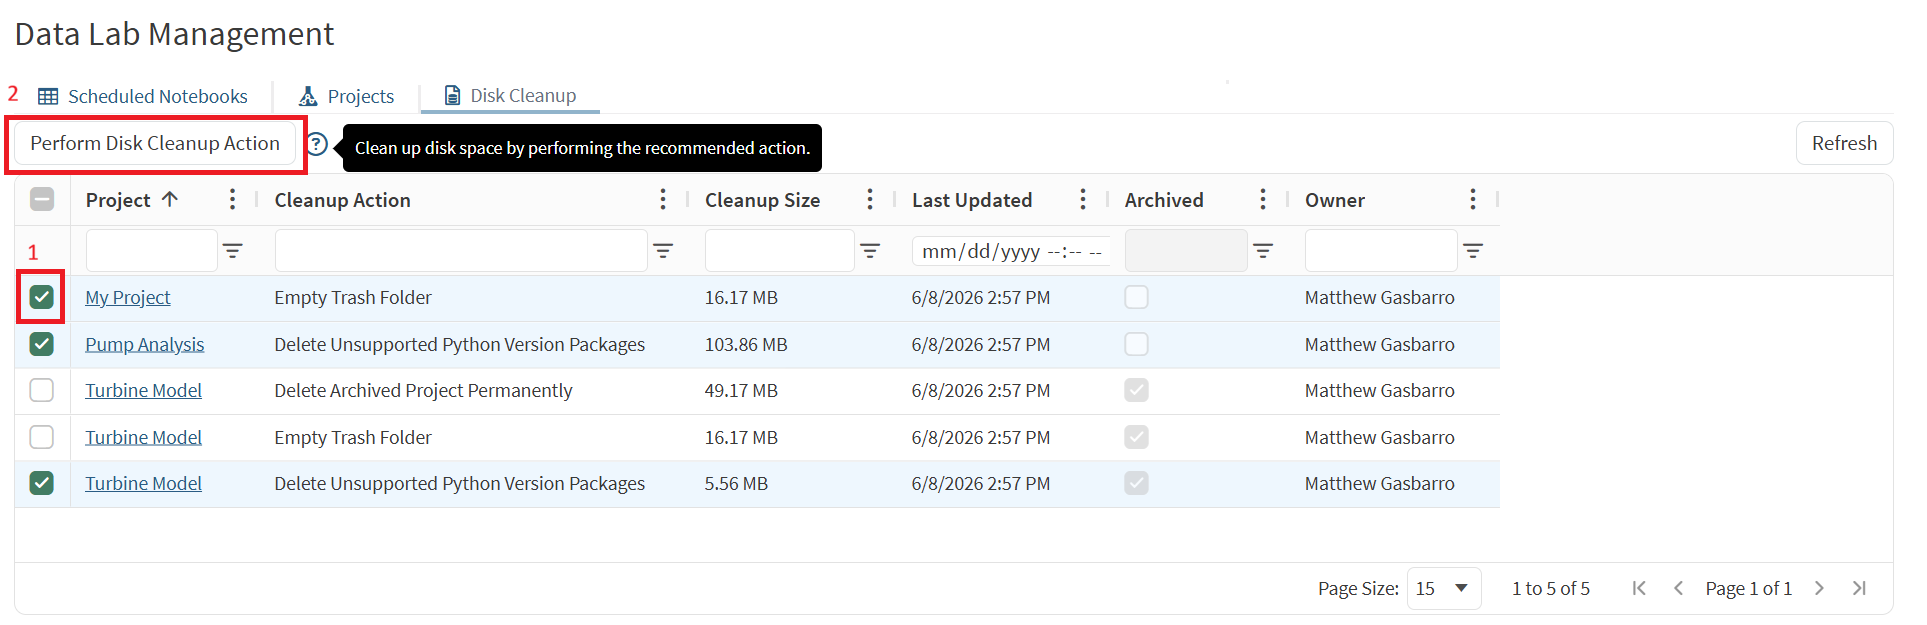
The Disk Cleanup tab shows recommended cleanup actions that can reclaim Data Lab disk space. Cleanup actions are listed by project and include emptying a trash folder, deleting packages from unsupported Python versions, or permanently deleting archived project data.
Usage
Navigate to your project by clicking the project name.
The table allows sorting and filtering to more easily find any notebook. The columns can be resized and reordered by drag-and-drop to get better visualization of your data. Note that not all the columns are displayed by default. Click the dots next to any column name and click “Choose Columns” to configure the current view.
To perform cleanup actions, select one or more recommended actions using the checkboxes on the left side of the table. Then click “Perform Disk Cleanup Action”.
A confirmation modal will appear with the number of selected actions and the estimated disk space that will be reclaimed. To confirm, type the word “delete” (case sensitive and without quotes) and click “Perform Cleanup”.
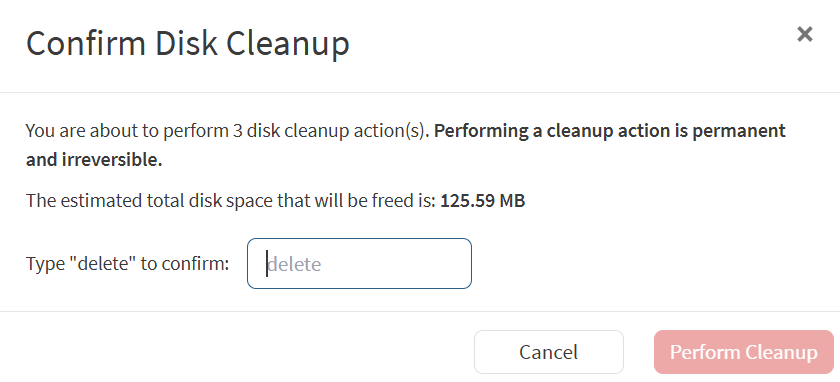
If there is a large number of actions to perform, the “Perform Cleanup” button will change to a progress indicator. Do not close the browser tab or navigate away. You can cancel the cleanup by clicking the “Cancel” button, but it will not revert those actions already processed. A message that the actions took place successfully will be shown in the top right corner of the page.

Cleanup Actions
Empty Trash Folder
A built-in component of JupyterLab is the Trash Folder where folders and files deleted from the user interface are stored, similar to a computer recycle bin. Its contents remain for 30 days when it will be purged. Meanwhile, for projects in which you have Manage access, you can purge the Trash folder contents by selecting the “Empty Trash Folder” cleanup action for a project.
See How To: Identify and Remove High Data Lab Disk Usage | Trash Folder for more information on identifying content in the trash folder.
Delete Unsupported Python Version Packages
Seeq Data Lab supports two Python versions at a given time. When a Python version is no longer supported (such as Python 3.7 and 3.8), any packages installed locally for these versions become obsolete, as they are no longer visible to a notebook’s kernel. Currently, this content is not automatically purged. In the meantime, for projects in which you have Manage access, you can purge the obsolete Python packages by selecting the “Delete Unsupported Python Version Packages” cleanup action for a project.
See Python Versions and Packages for more information on supported Python versions. See How To: Identify and Remove High Data Lab Disk Usage | Python Packages for more information on identifying unsupported locally installed Python packages.
Delete Archived Project Permanently
Data Lab projects that have been archived still persist their disk contents, such as notebooks, files, locally installed packages, etc. Currently, archived projects are not automatically purged. In the meantime, for projects in which you have Manage access as well as either the project owner or a member of the Analytics Administration capability, you can purge an archived project’s disk data by selecting the “Delete Archived Project Permanently” cleanup action for a project. Note that this action will also delete the project itself from the system and it will no longer appear in the Projects tab of Data Lab Management page.
Deleting a Project will be recorded in Seeq Audit Trail.
Disk Usage
Overview
The Data Lab disk usage statistics progress bar appears on the top right of the Data Lab Management page. It indicates the breakdown of disk usage in GB consumed by all projects including those you may not have permission) and global packages as well as the available (free) disk space. Hovering either the progress bar segment or a legend category will display the exact disk usage amount for the respective category.
The total disk space allocated to Data Lab is shown to the right of the progress bar. On top of the progress bar is the usage statistics by total and used percentage. Next to it is a refresh icon that when clicked will update the progress bar with new data.
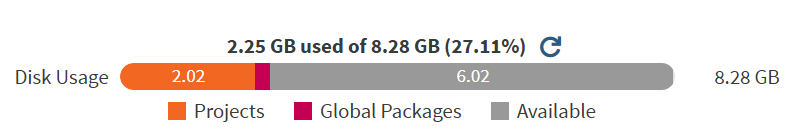
If the used percentage is greater than 70%, it will display orange to warn that Data Lab disk space has high usage. If the used percentage is greater than 90%, it will display red to indicate that Data Lab disk space is nearly full. In both cases, Data lab users should investigate their project and/or global packages disk usage. See How To: Identify and Remove High Data Lab Disk Usage
You can also observe a Data Lab project’s disk usage from within a project itself. Both the current project’s disk usage and total Data Lab disk usage is shown in Advanced Mode on the status bar.