Capsule Time
Basics
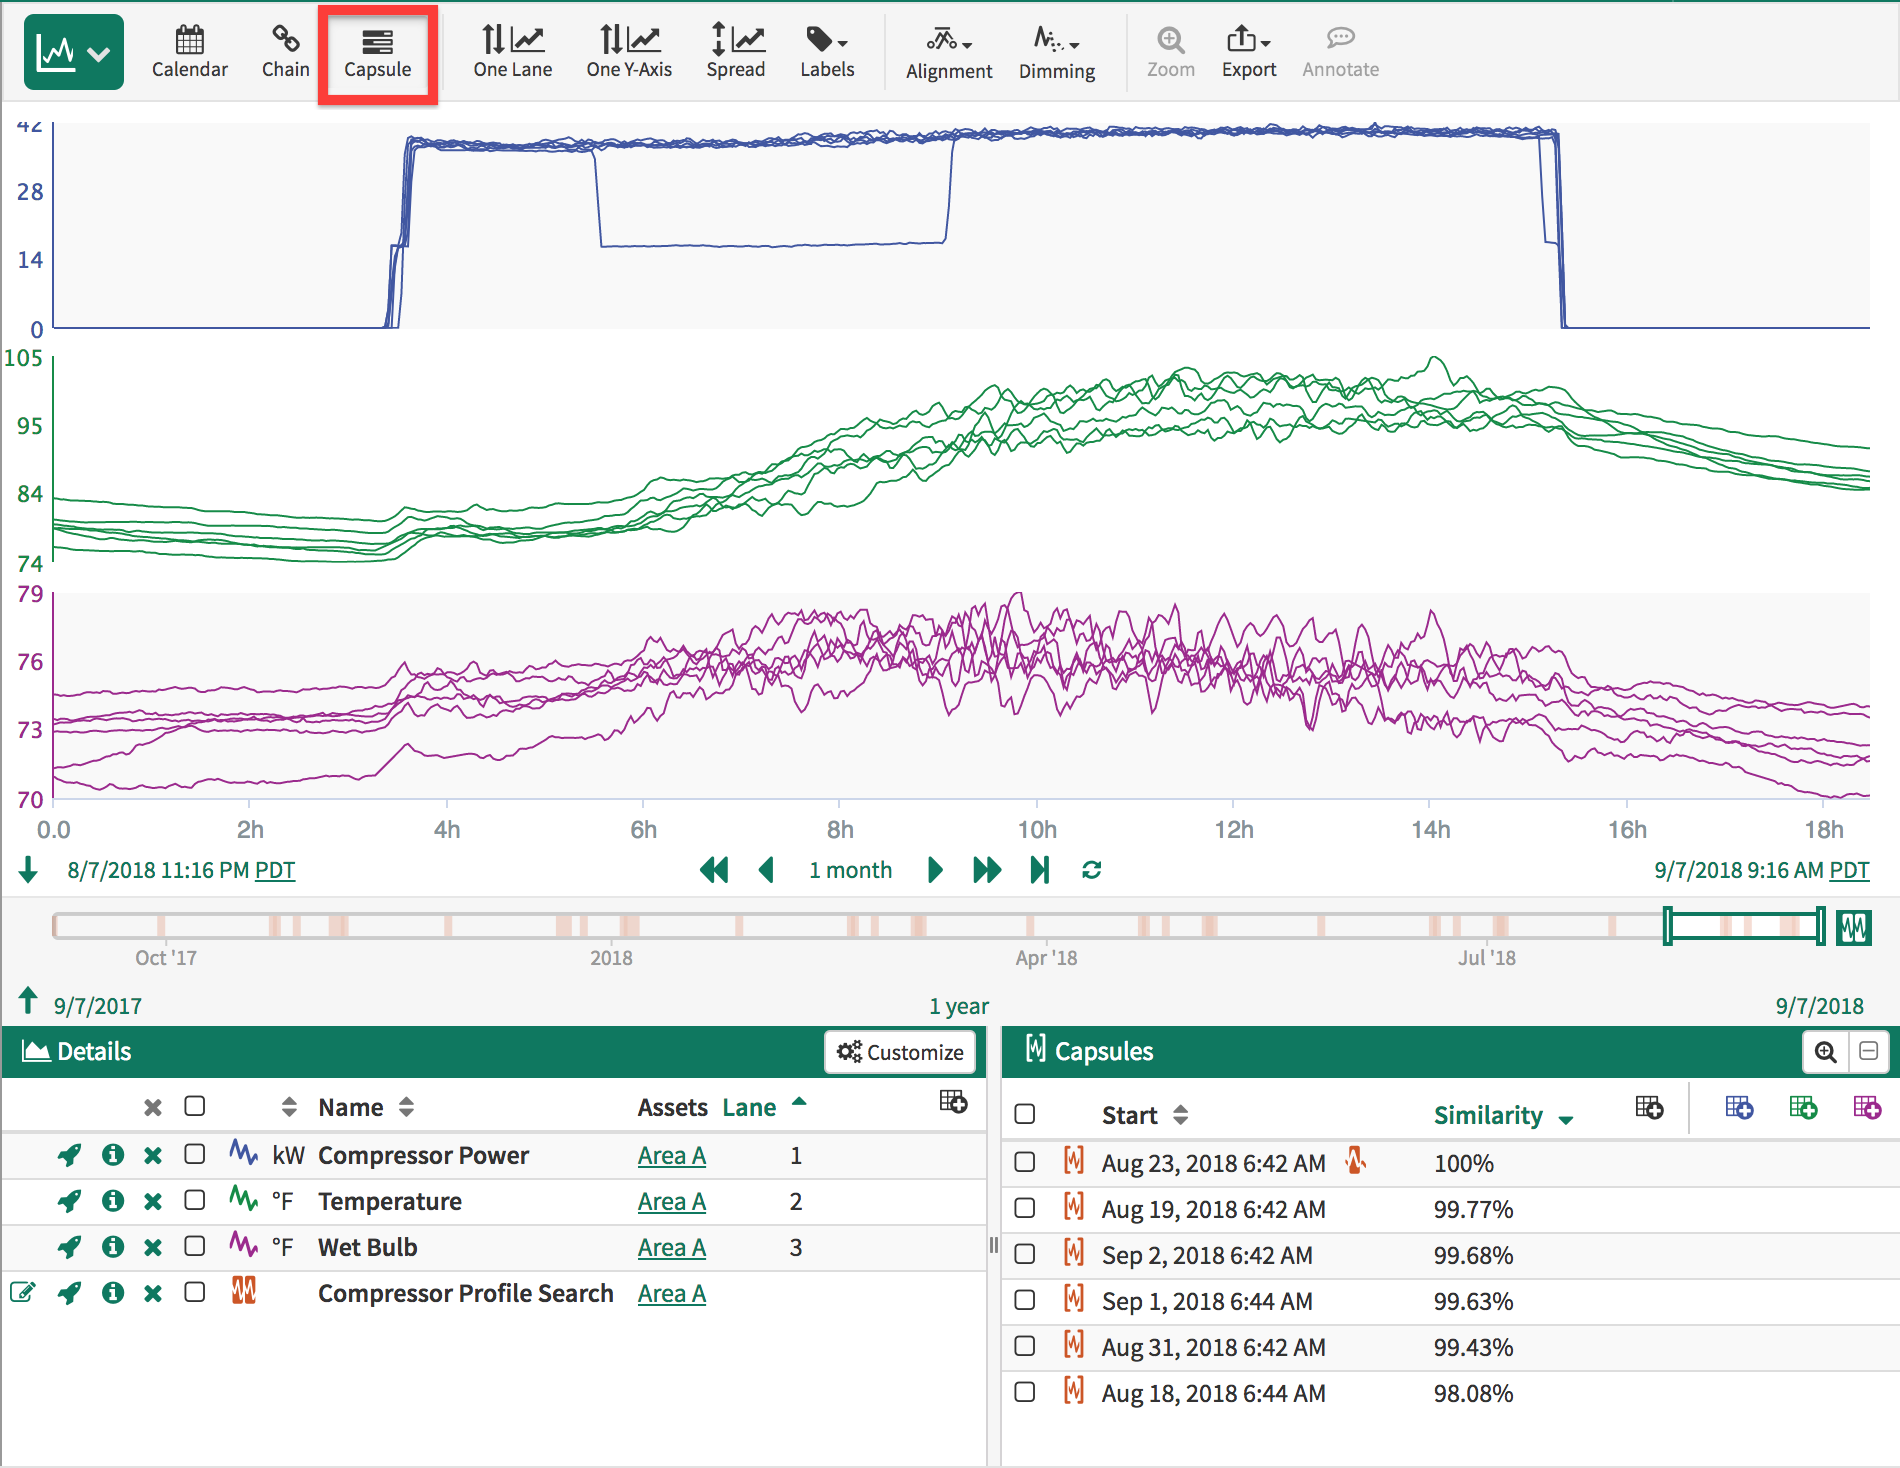
Capsule View overlays the capsules within your conditions so that you can compare one or more signals when the conditions are present. In this mode, all time shown on the X-axis is relative to the start of a capsule. This view requires that one or more conditions and one or more signals to be present in the Details pane. To enter capsule view, click the Capsule icon 
Example use cases
Create a condition for batch startups and using capsule view to overlay process variables during the last 5-10 batches.
Search for an anomalous pattern using Profile Search. Overlay all search results in Capsule View to determine where to set the threshold for similarity metric.
Entering Capsule View
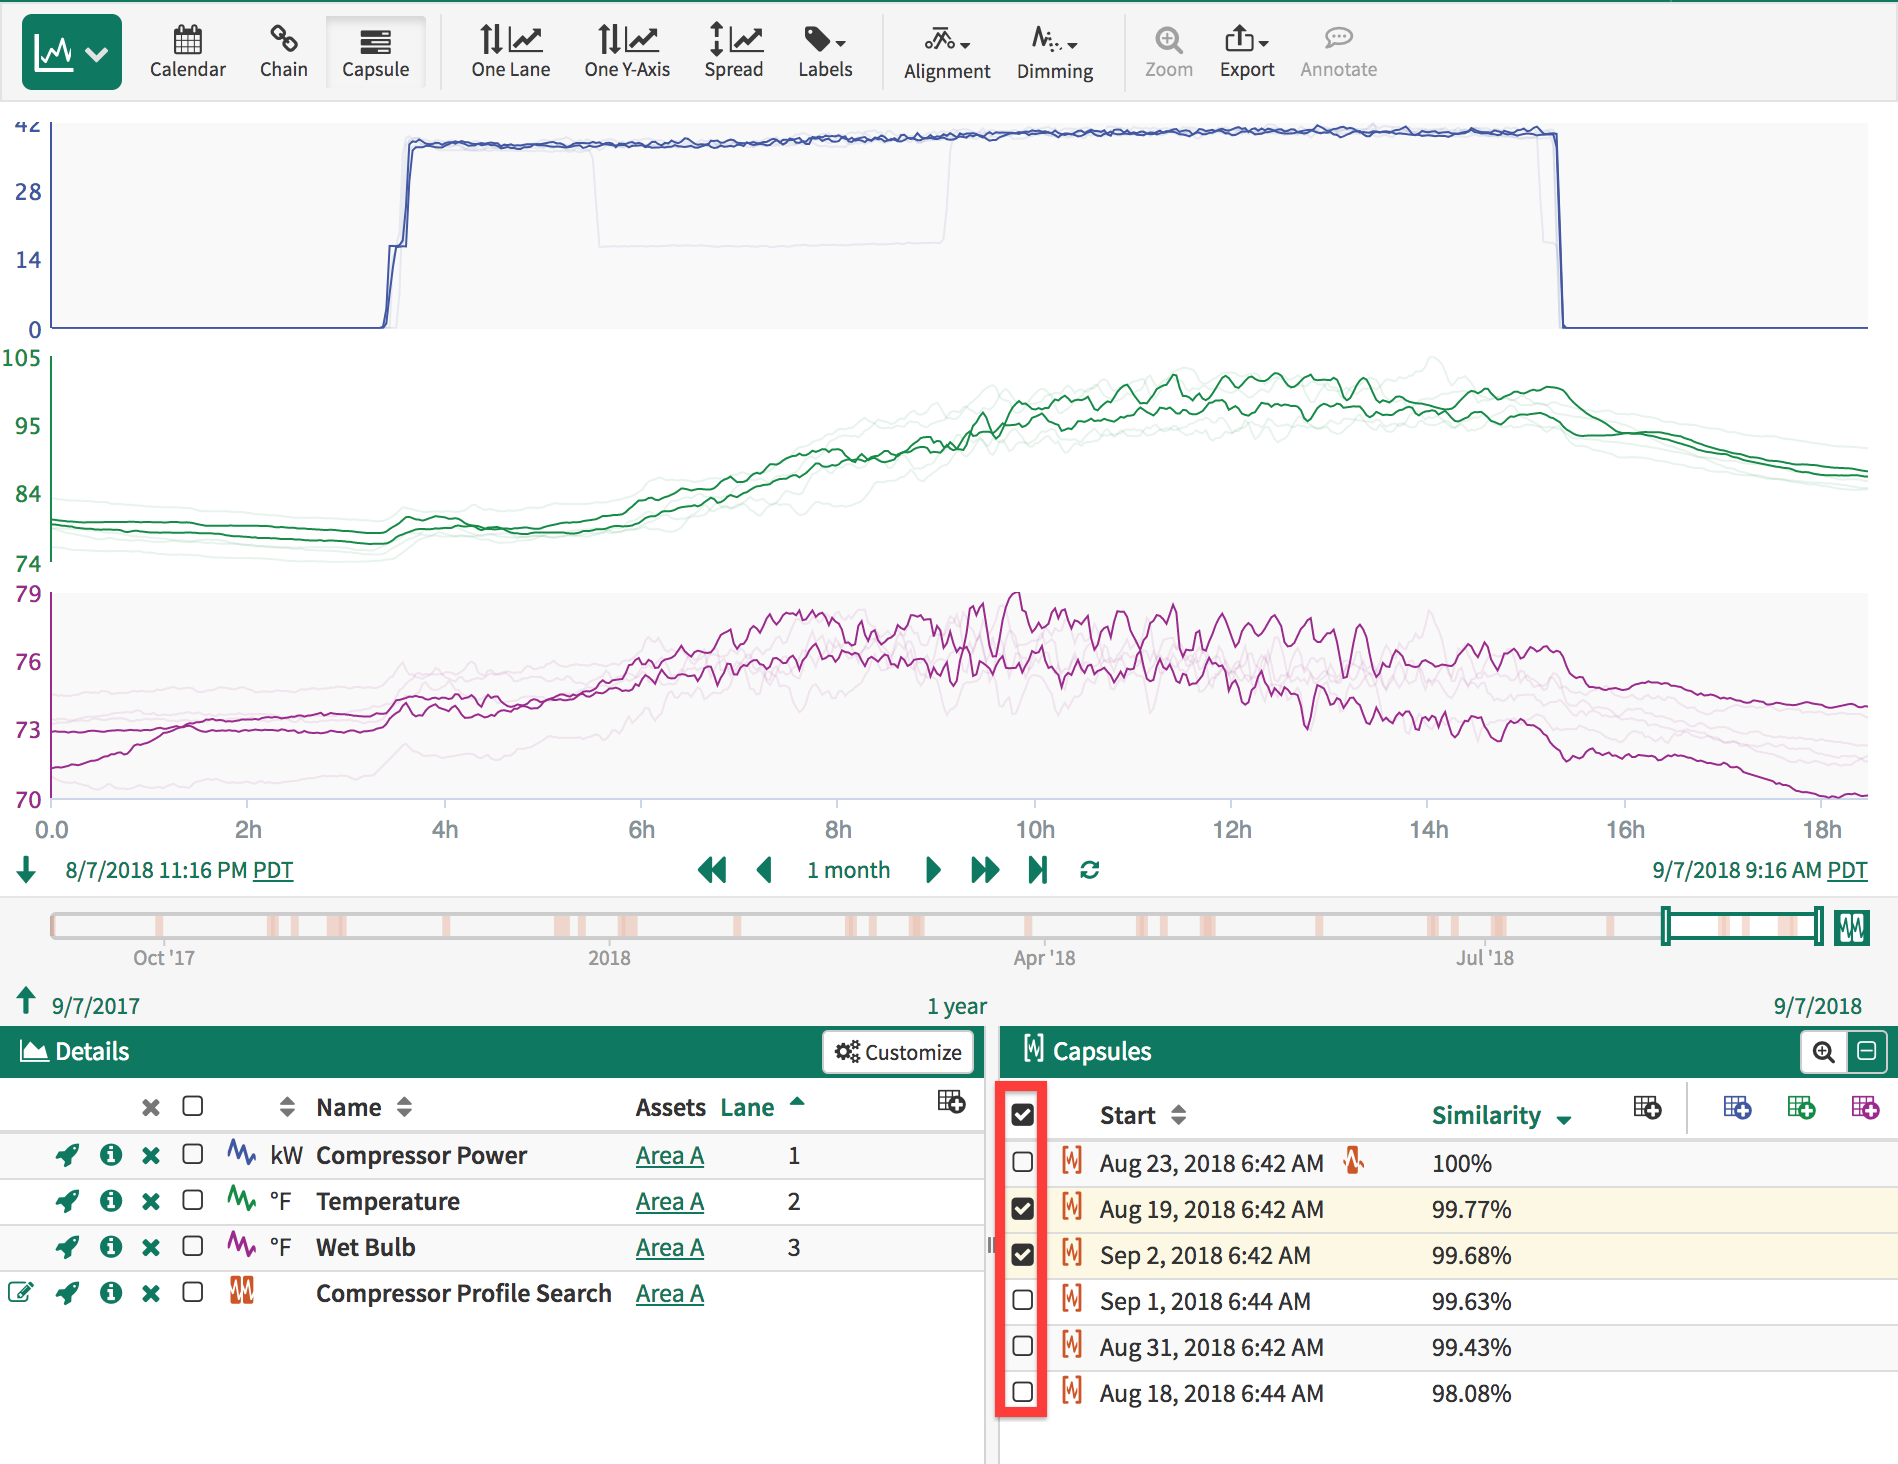
Selecting Capsules
All of the capsules are visible on the trend by default. You can use the checkboxes next to each capsule in the Capsules Pane to highlight certain capsules. The capsules pertaining to the checked boxes will appear on the trend normally. The capsules pertaining to the unchecked boxes will appear "dimmed" on the trend.
Selecting Capsules in the Capsules Panel
Coloring Options
Users can utilize Rainbow, Gradient, or Gradient by Condition to distinguish signals in the trend. By default, all lines are drawn in the signal's color as shown in the Details Pane. When a user selects an alternate coloring scheme, sorting capules in the Capsule Pane can change the way capsules are colored.
Rainbow will apply a distinct color to all the signals trended within capsules so that two or more different signals in the same capsule can be readily determined without needing to select them.
Gradient will use a gradient of the signal's color as shown in the Details Pane per the Capsule Pane sort.
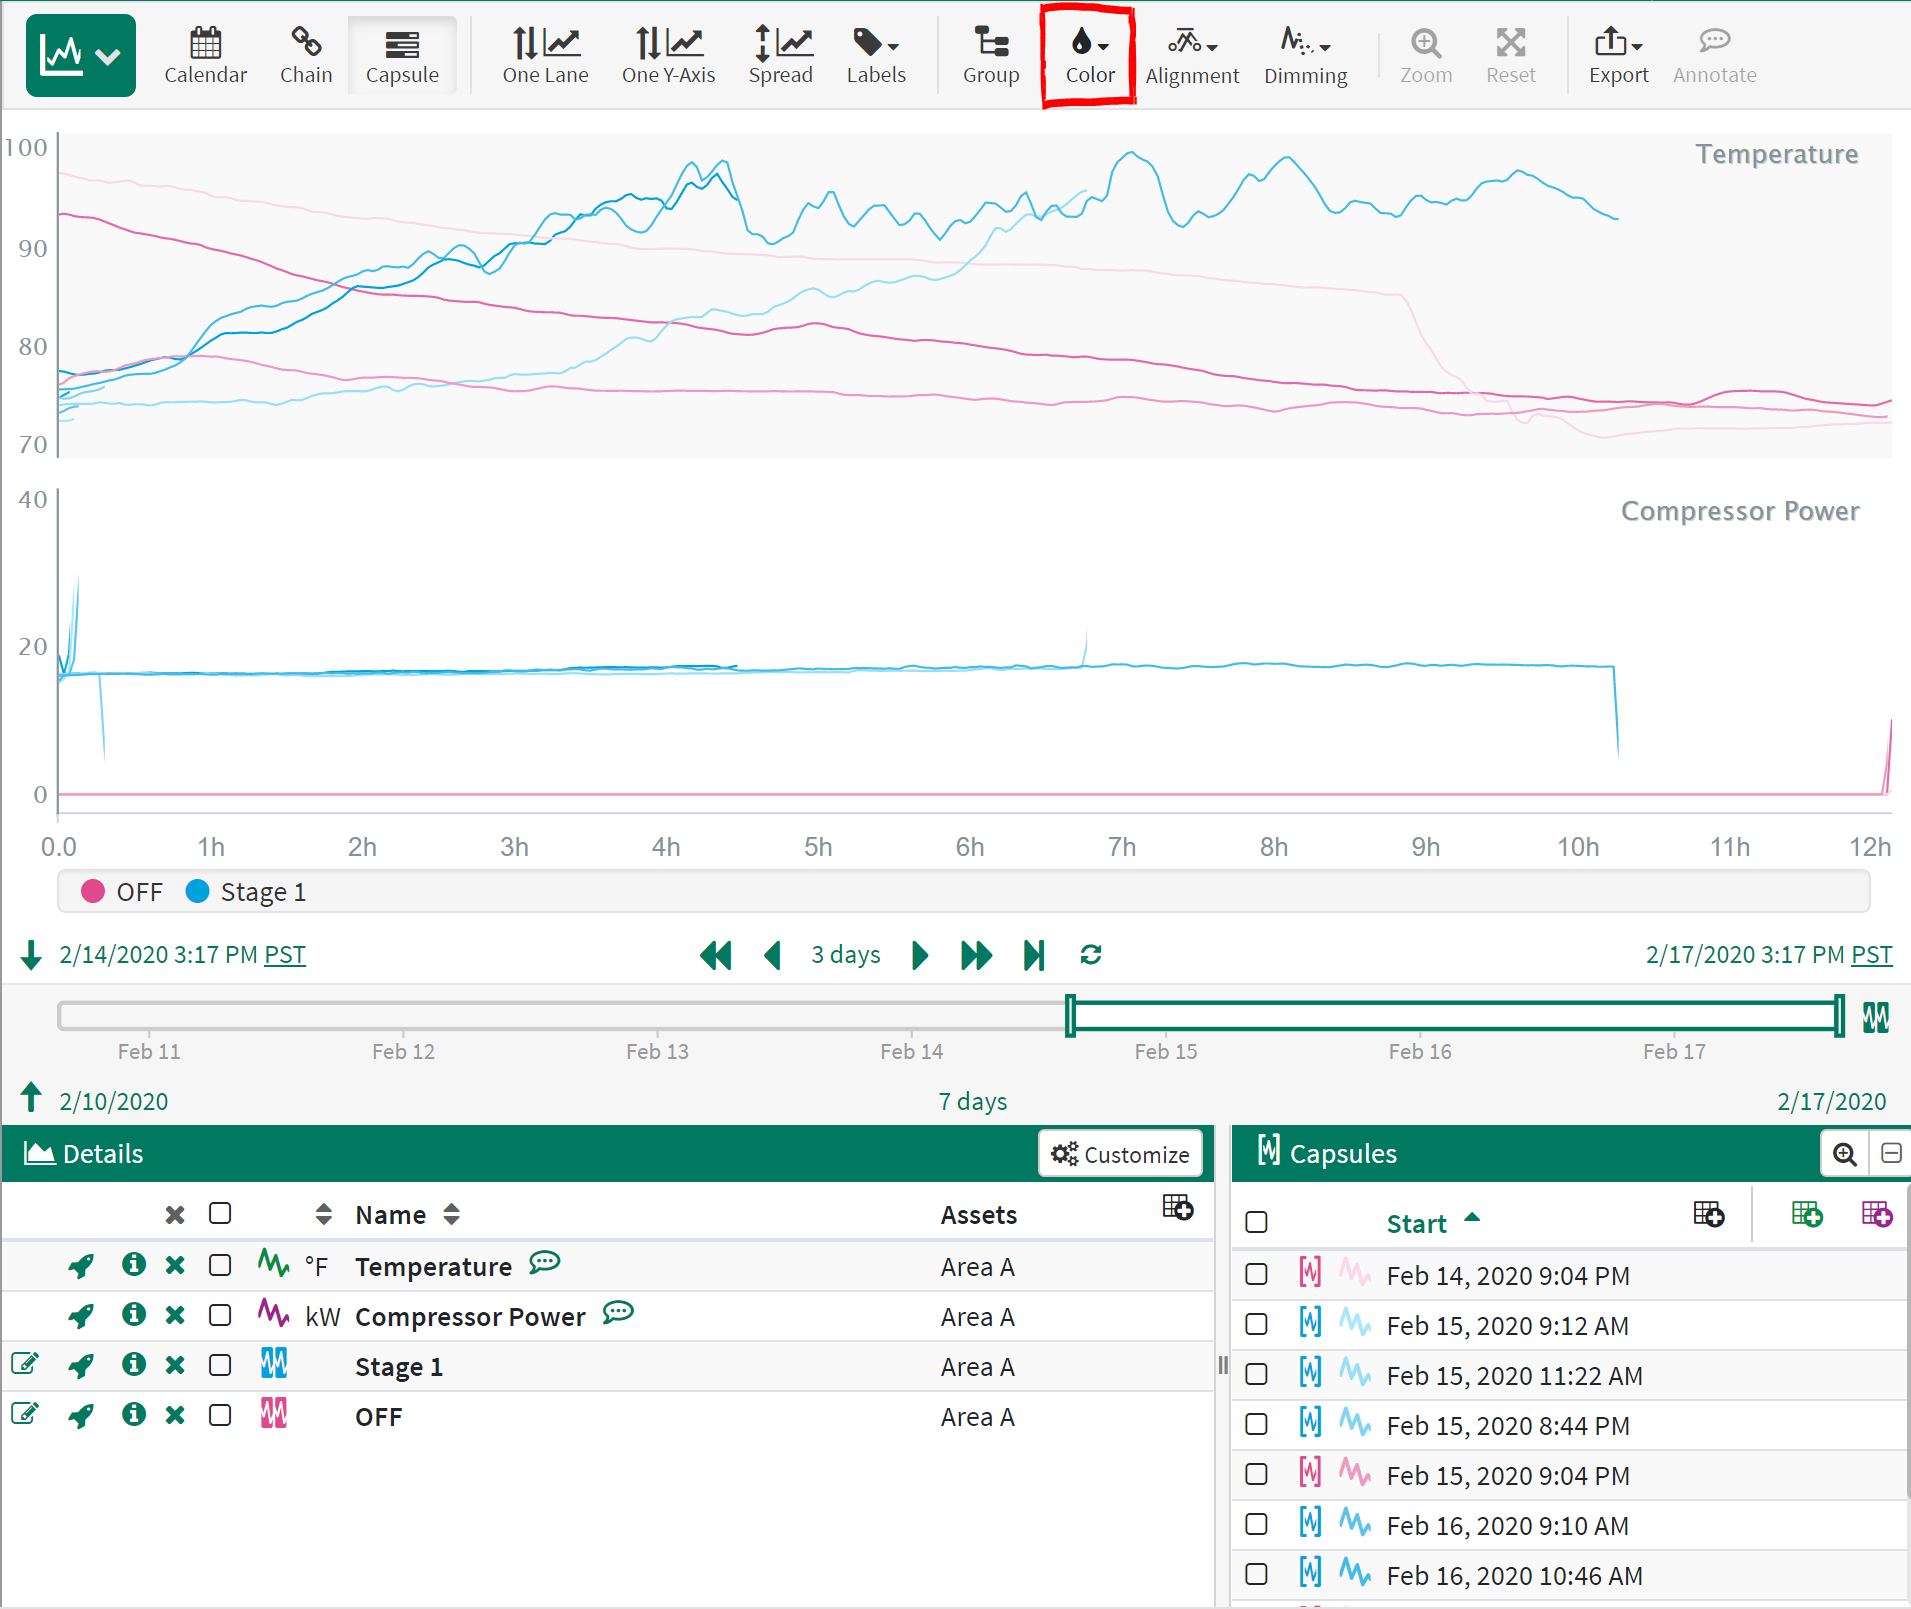
Gradient by Condition will apply the conditions' colors per the Details Pane to the signals occurring within each condition's capsule.
Coloring Option - Gradient by Condition
Viewing Selected Signals Only
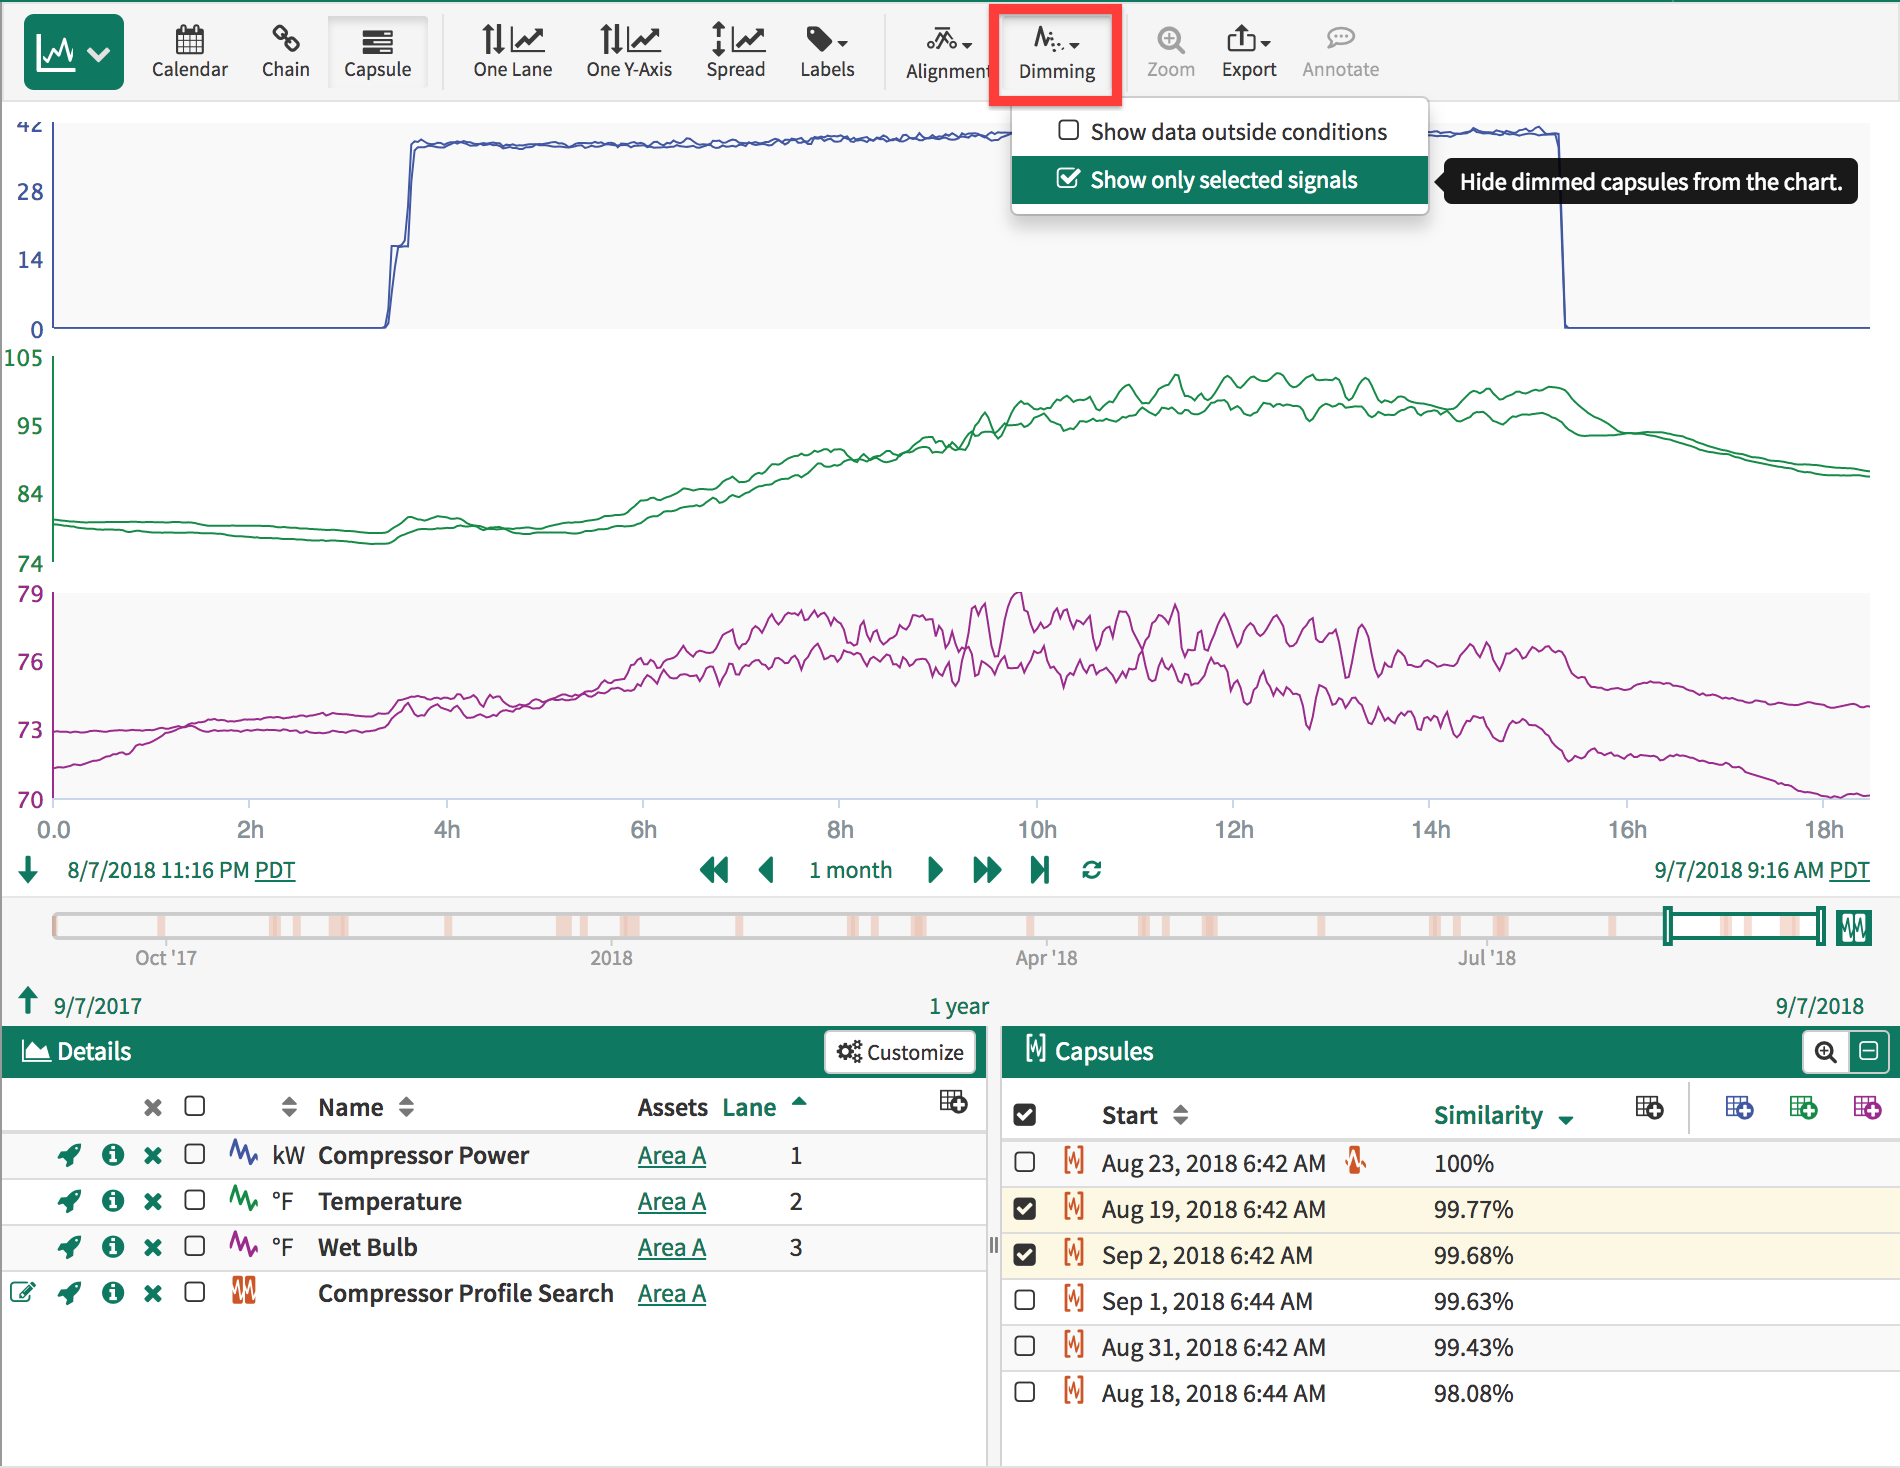
If you want to be able to remove the dimmed capsules to remove clutter from your trend you can do so by selecting the Show only selected signals option from the Dimming Menu.
Viewing Only Selected Signals (from Dimming Menu)
Unbounded Capsules
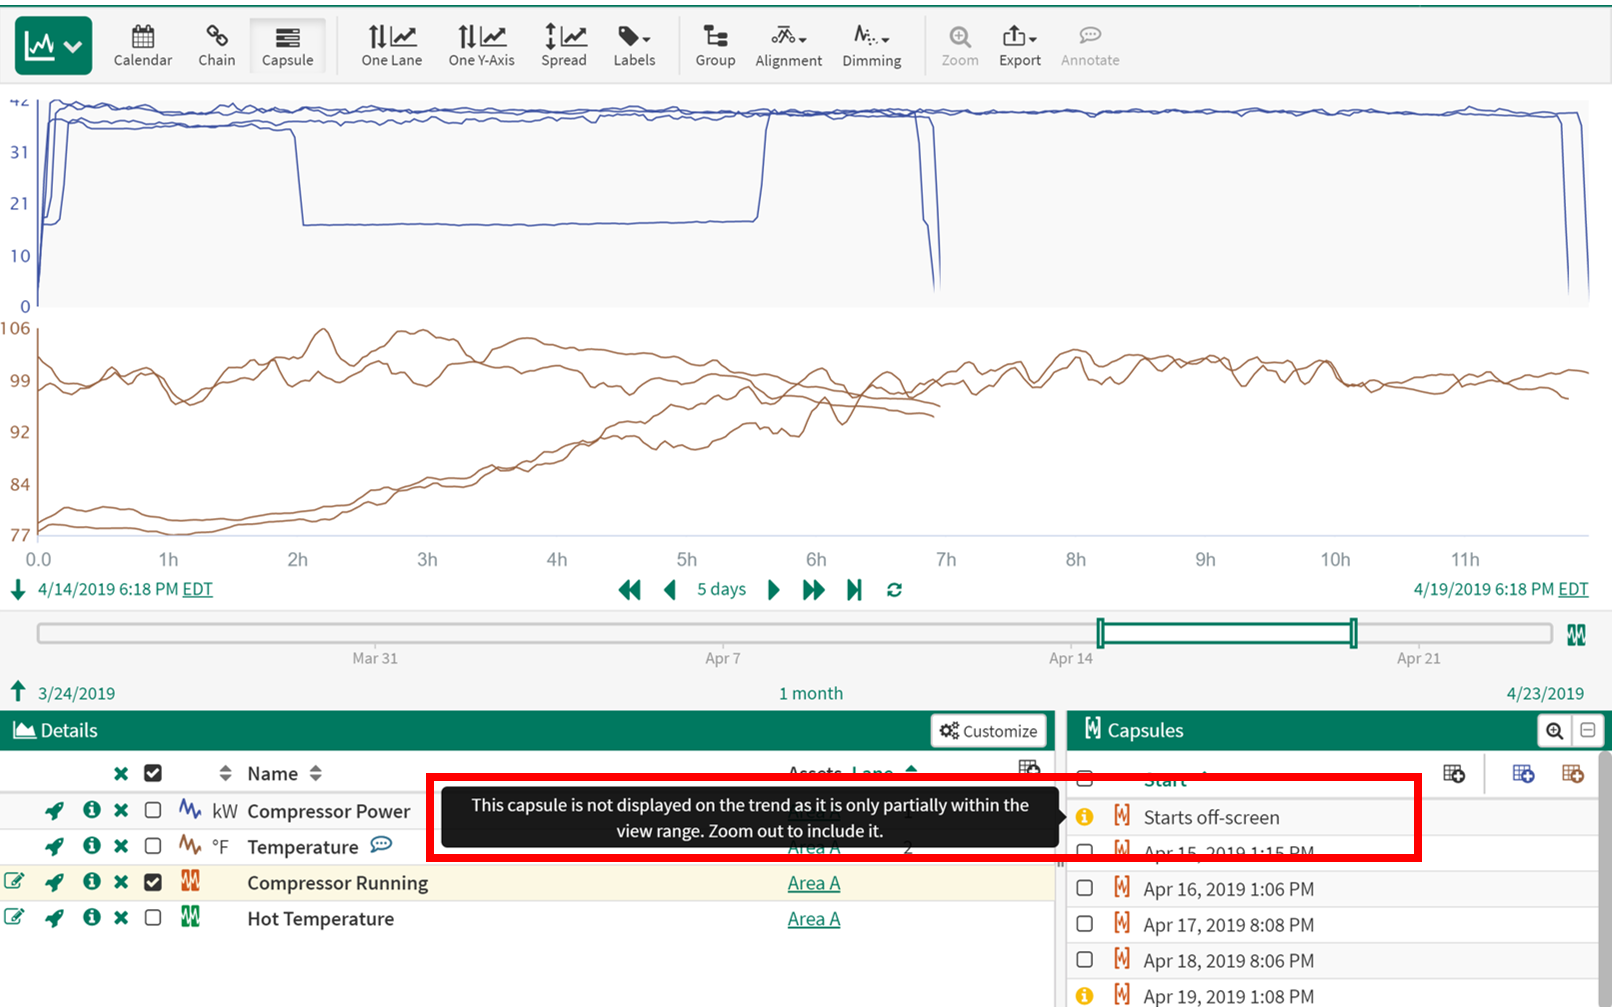
Capsules are unbounded when the start or end time for the capsule is not encapsulated within the display range. Capsules that are unbounded will not show in capsule time and will provide a 
Capsule Time Warning for Unbounded Capsules
Viewing Data Outside Capsule Start & End Points
While your signals are aligned in relative time, you can view what is occurring before and after each of the capsules end using the Show data outside conditions option from the Dimming Menu. In Capsule Time you can still pan/zoom the trend just as you would in the standard view - Adjusting Time Ranges
Example use cases
Create a condition which captures a concerning mode of operation (water hammer, high vibrations, etc.) and determine if there was something in common which precipitated the event each time it occurred.
Enabling Dimming
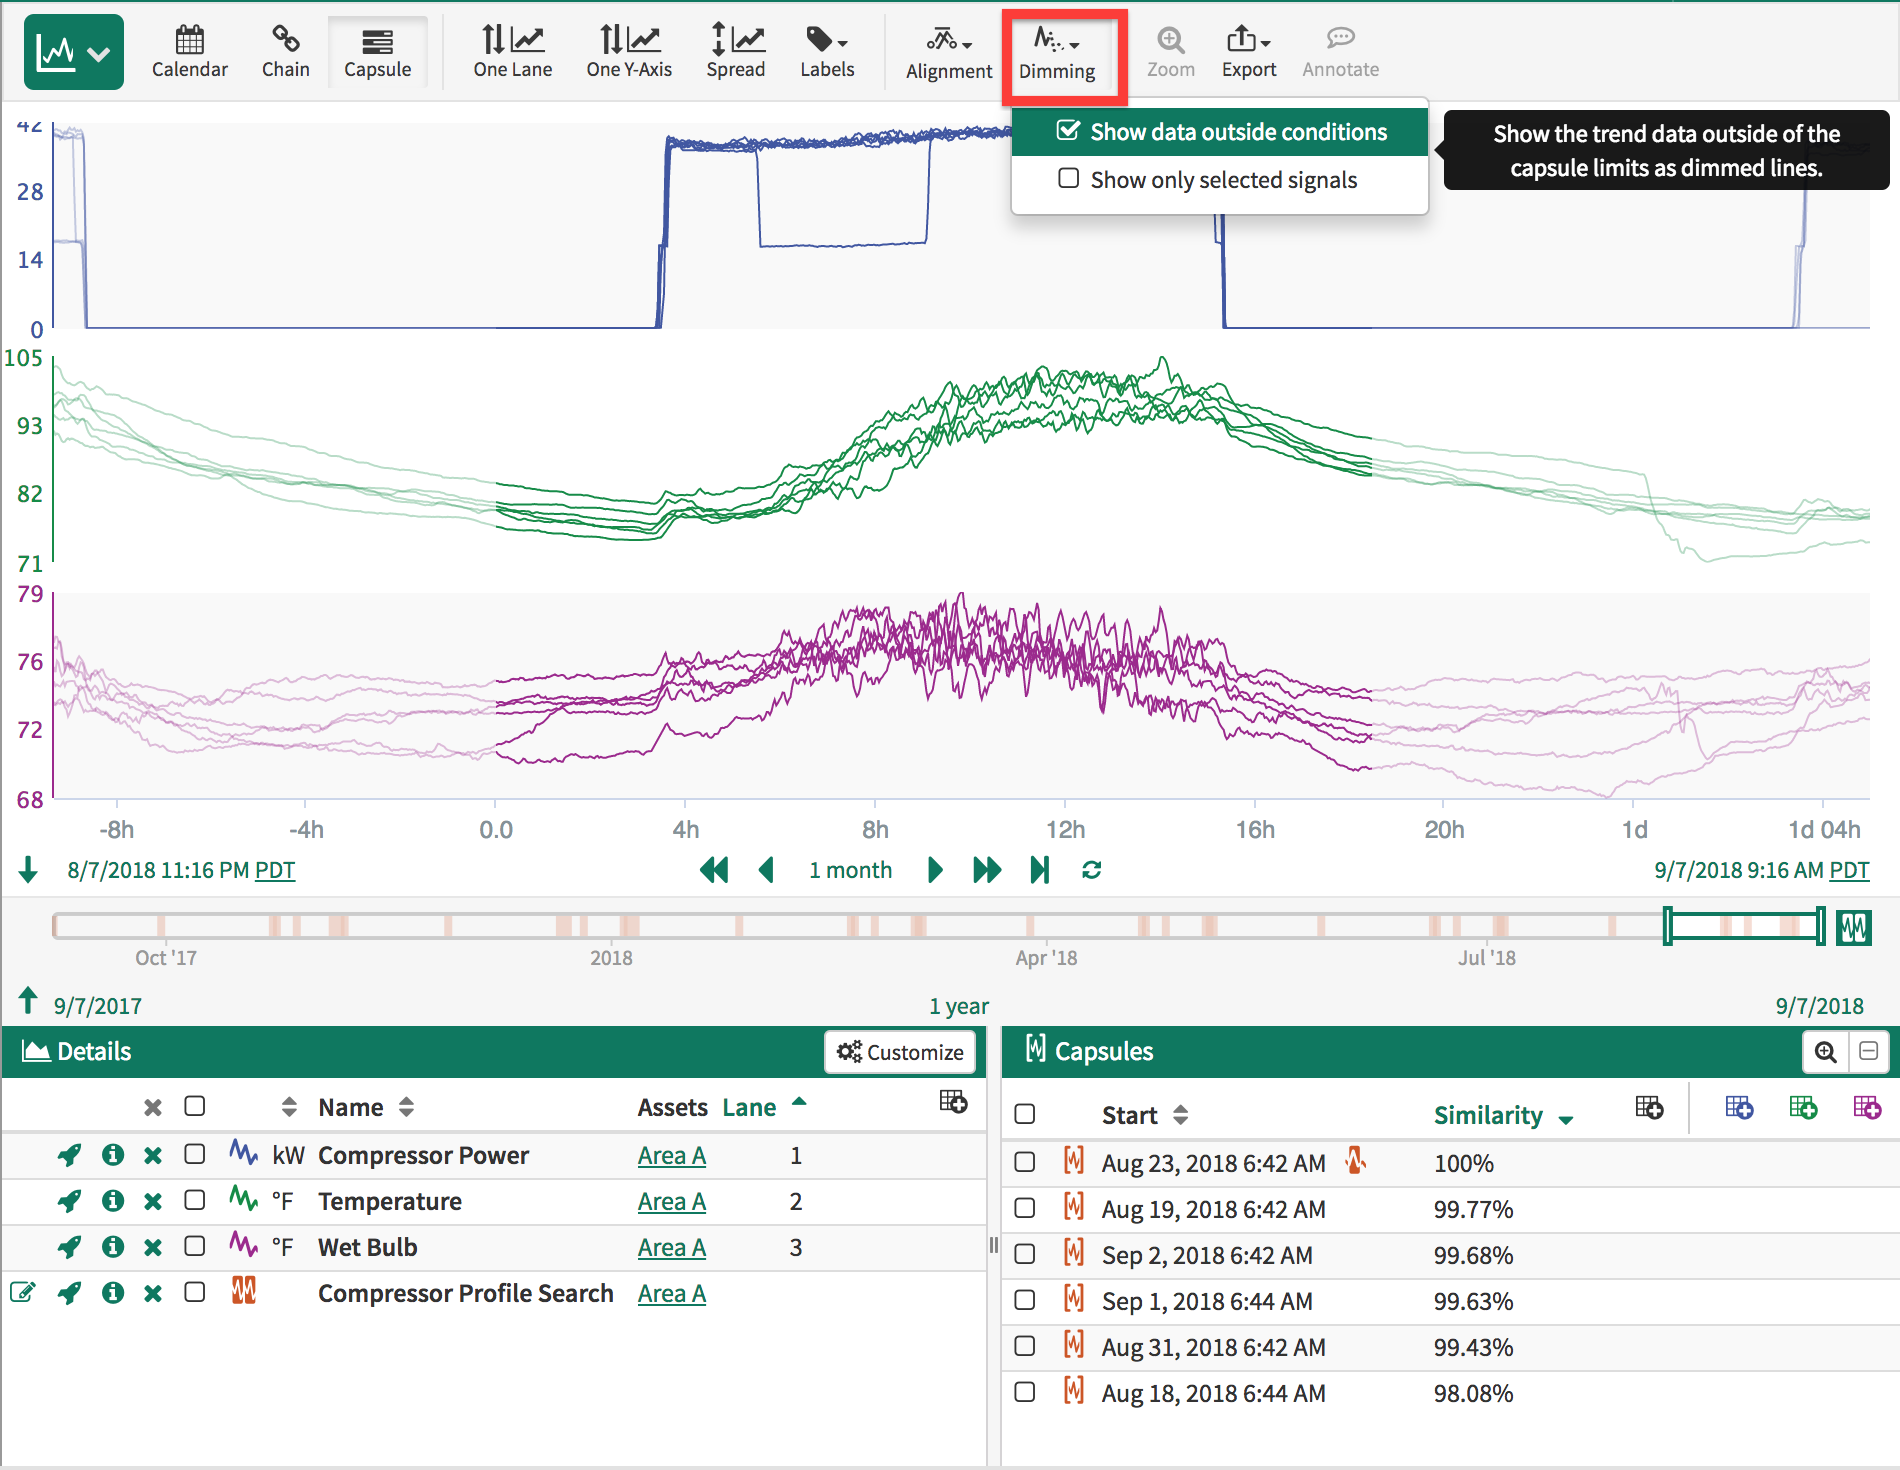
When a user enables the "Show data outside conditions" option, each signal will plot data for both before and after the individual capsule start and end points. The border between capsule start/end time is indicated using signal transparency. In the screenshot to the left, you can see that the time axis now includes negative values. These negative values represent hours until the start of a capsule.
Viewing Data Outside Capsule (from Dimming menu)
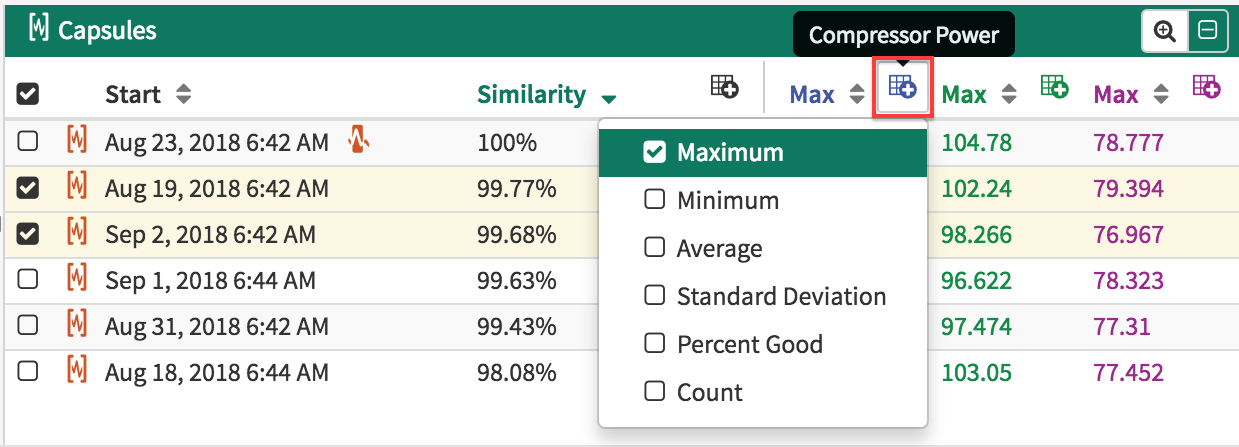
Adding Statistics
From the Capsules Panel, it is possible to add statistics to both the capsules and each individual signal. The "Add Statistics" button colors correspond to the color of each signal on the trend.
Adding Statistics to the Capsules Panel
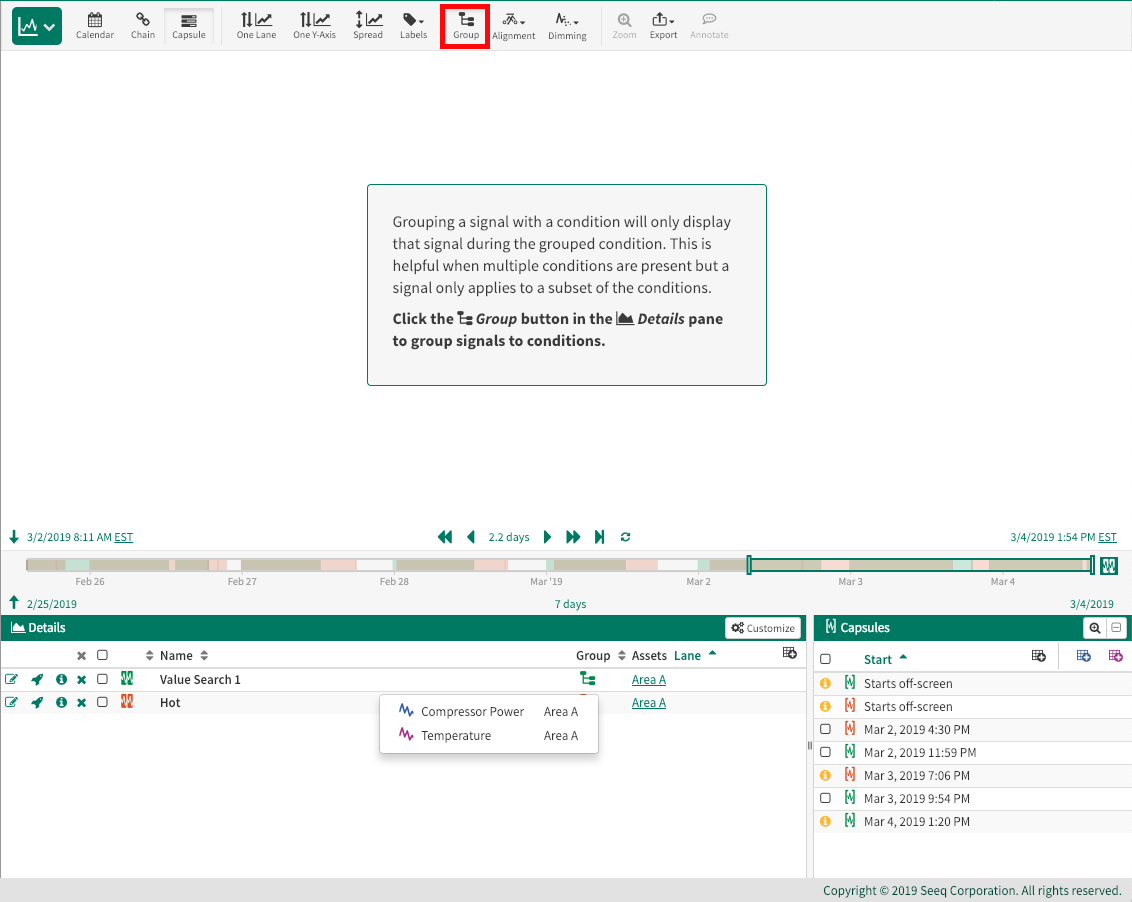
Grouping Signals to Conditions
Grouping a signal with a condition will only display that signal during the grouped condition. This is helpful when multiple conditions are present but a signal only applies to a subset of the conditions.
To use Grouping, click the Group button in the toolbar.
This will update the Details pane to show only the conditions available in your worksheet.
Then click the Group icon button in the Details pane to assign the desired Signals.
When the toolbar Group button is enabled, then any condition in the details pane that has no grouped signals will be automatically grouped with signals in the details pane that share the same parent asset. Additionally, any new signals or conditions that are added to the details pane will be automatically grouped if they share the same parent asset.
Grouping Signals to Conditions in Capsule Time