Adjusting Signal Lanes, Axes & Formatting
Single Click Adjustments
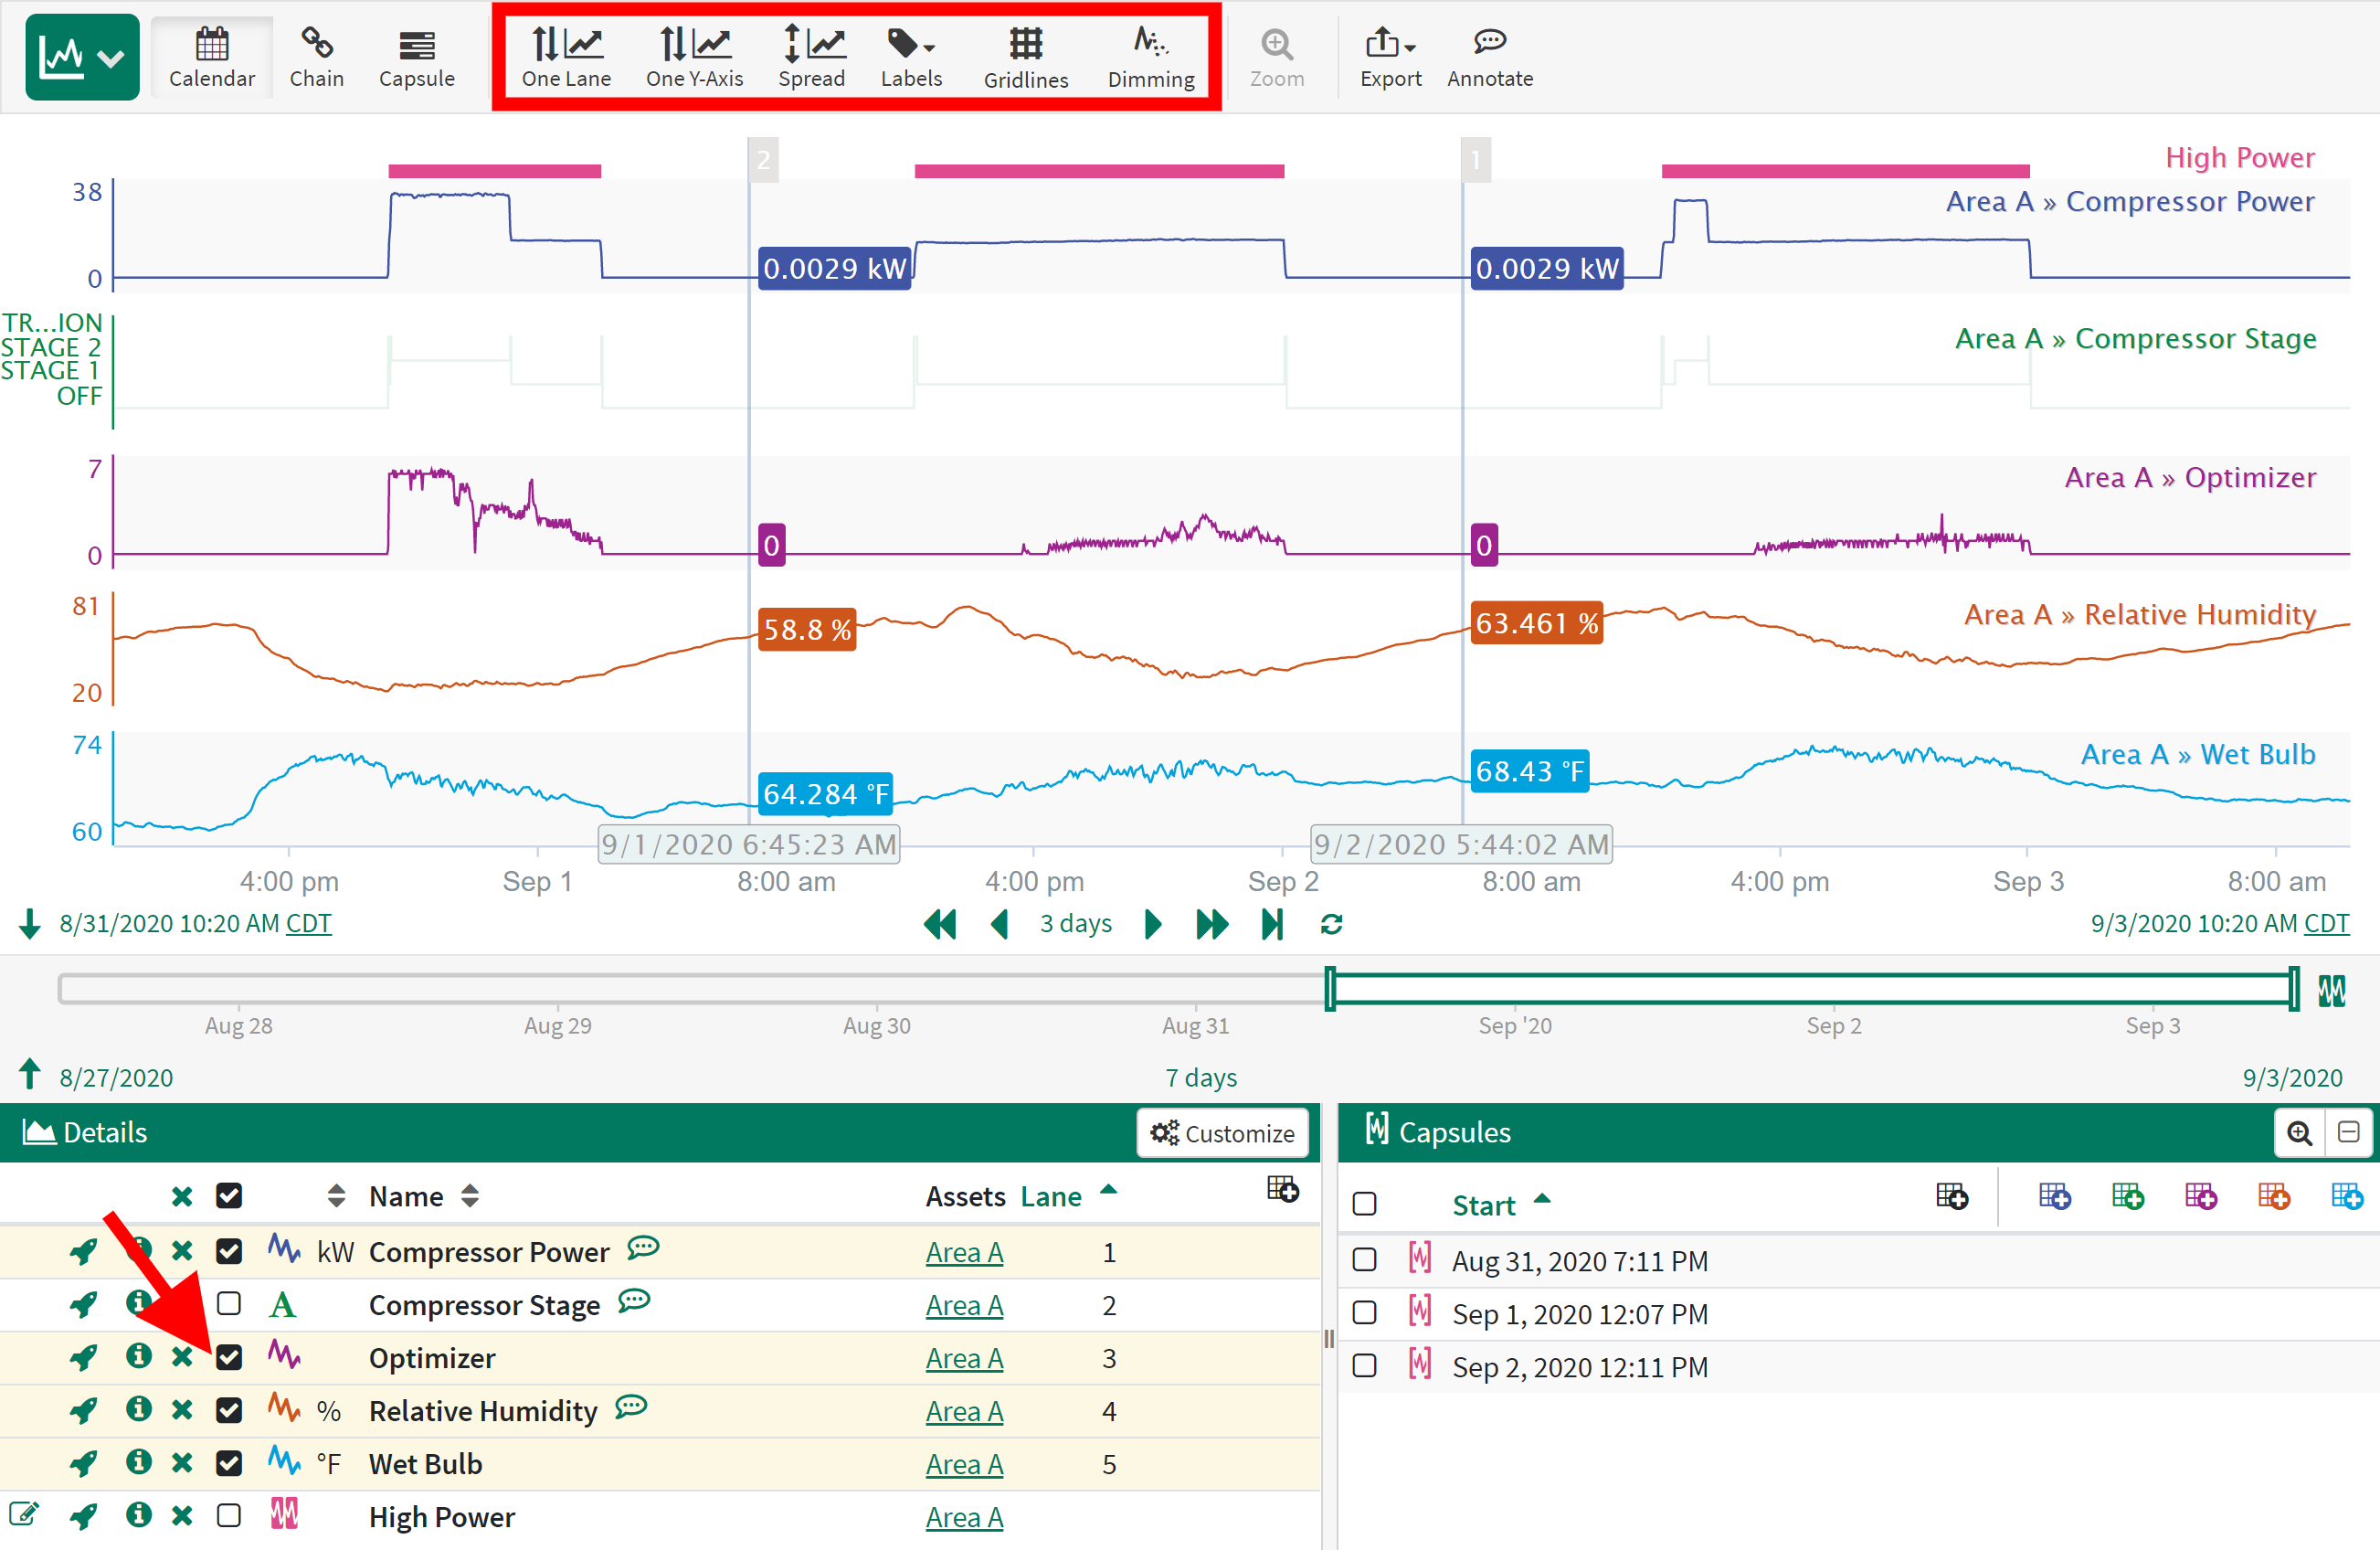
The easiest way to make common adjustments to signal trends is through the single-click buttons above the trend. These buttons take action on either the currently selected signals OR if no signals are selected, all signals on the trend. Signals are selected in the Details Pane.
One Lane
This button condenses the selected signal trends into a single lane. Signals maintain minimum and maximum axis bounds.
One Y-Axis
This button scales all axes on selected signal trends such that they share a common minimum and maximum value. This action may be applied to signals that are in the same lane or in separate lanes. For signals in the same lane, this button condenses the multiple axes labels to a single unified axis.
Spread
This button resets all selected signals to their own lane with their own auto-scaled Y-axis. This eliminates any manual adjustments which have been made to the Y-axis limits.
Labels
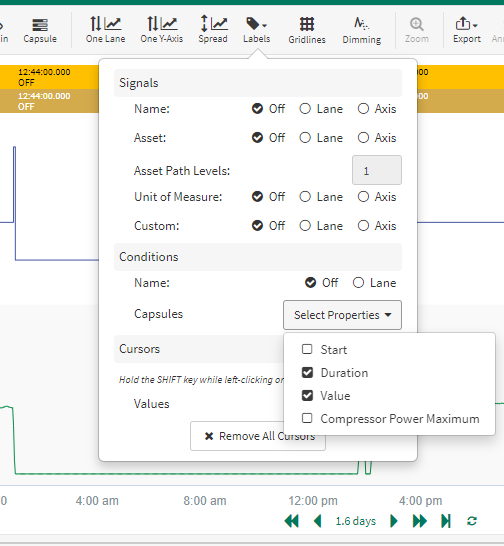
The Labels button opens the Labels menu where many aspects of Trend labels can be managed.
Signal labels can appear on the lane or axis and can include the signal name, asset path, and unit of measure. Custom labels are text defined by a user and can also be added to either the lane or axis.
Cursors
Cursors are placed on the trend by holding Shift+Left-Click or with a Right-Click.
The text inside the cursor’s “flag” can be edited from the Labels menu, as well as the flag’s Y-axis position and left/right orientation.
The display of the cursor's value can be turned off by selecting the "Hide" radio button. The text that displays next to the cursor’s value can be customized to show one or more of the following Cursor Label Properties: Name, Asset, and Description. This can help in distinguishing one cursor from another.
To remove an individual cursor from the trend, click its flag and then click the ‘x' that appears next to the flag. A cursor can also be removed by clicking the 'x’ next to it in the Cursors section of the Labels menu.
The “Remove all cursors” button will delete all the cursors inside a selected region, or, if there is no selected region, all the cursors on the trend.
Users can add capsule properties to the Capsules Pane to display the property on each capsule.
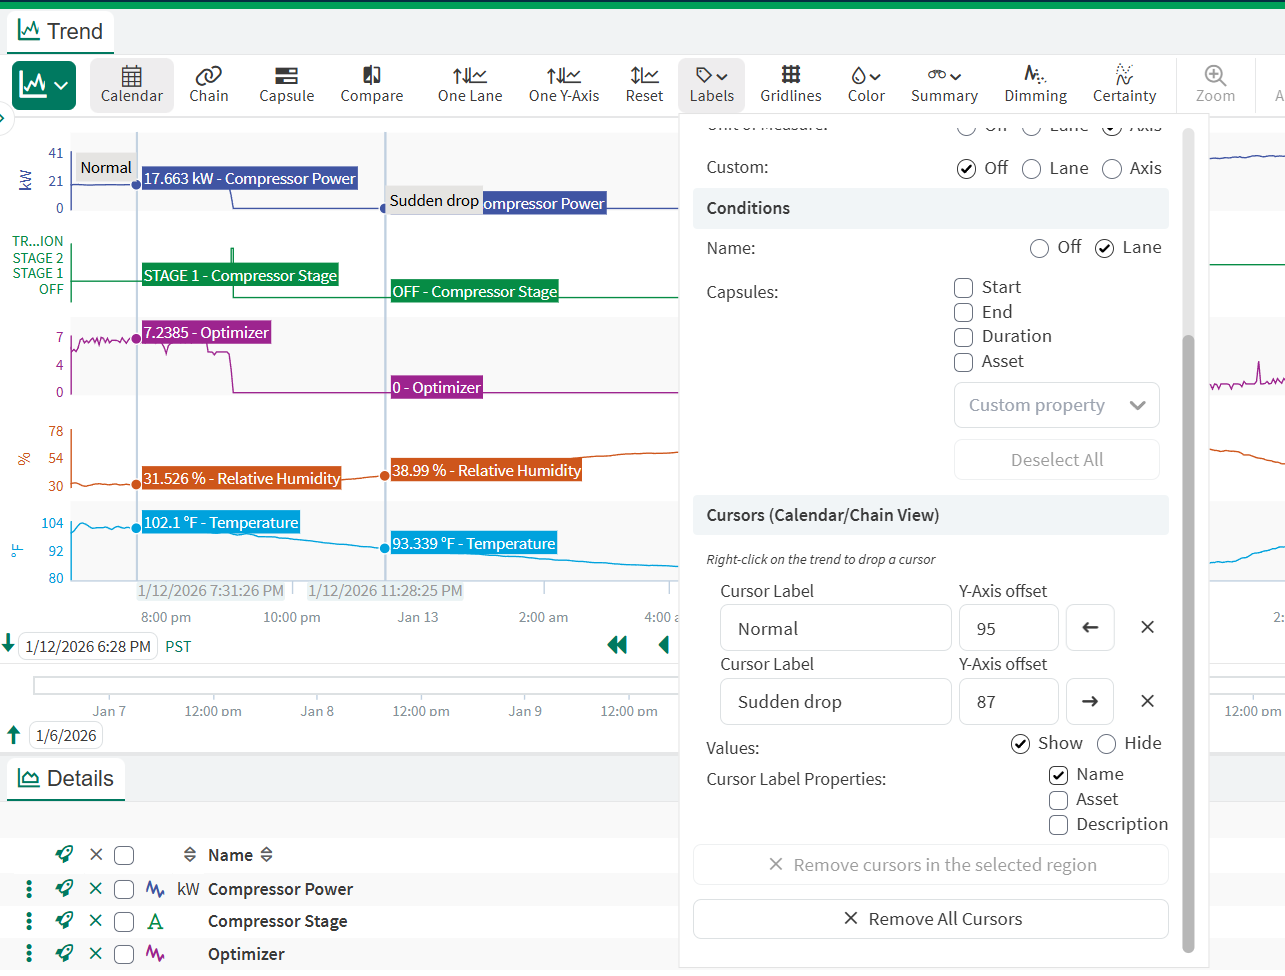
Cursor labels on the Trend and customizing them in the Labels menu
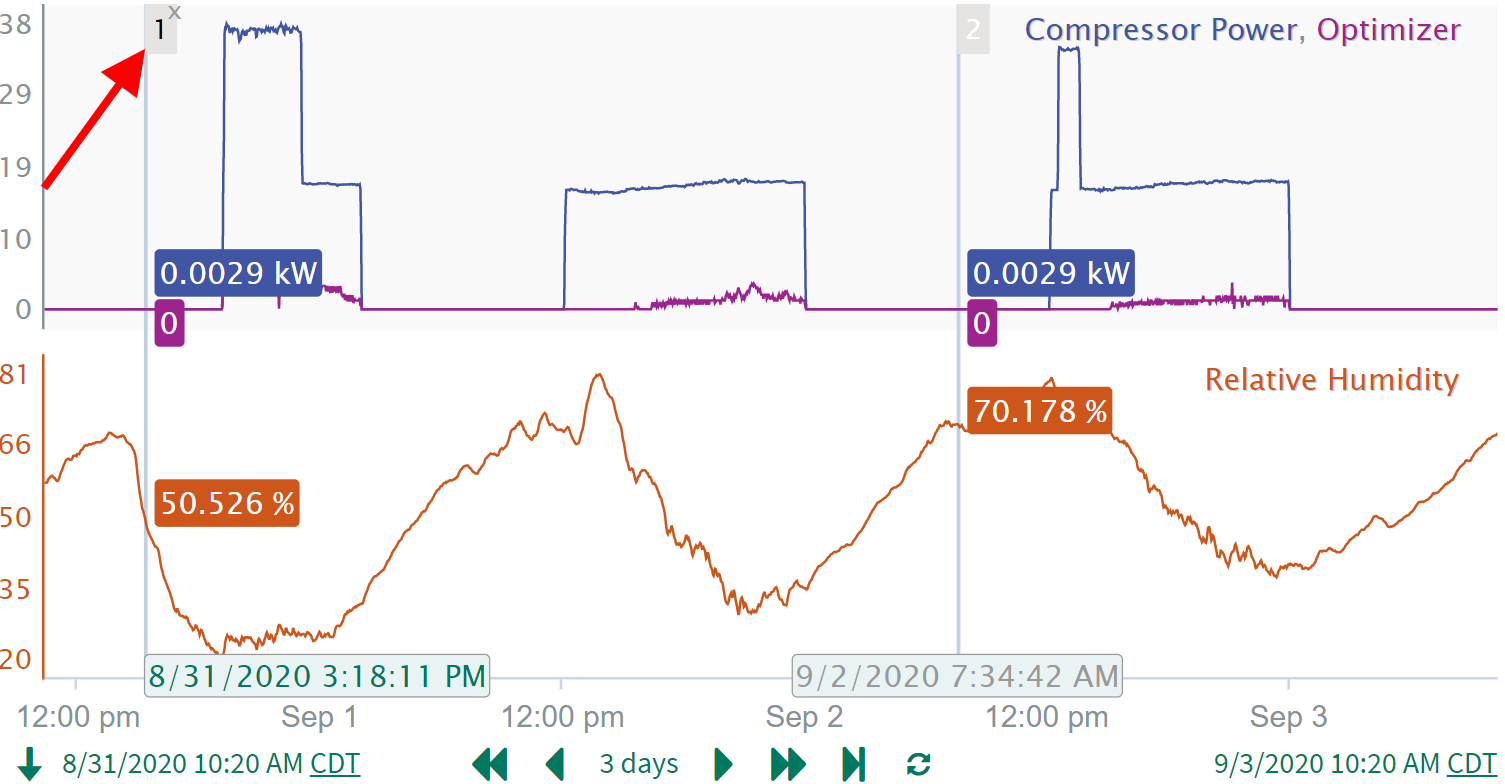
Click the 'x' to remove a cursor from the trend.
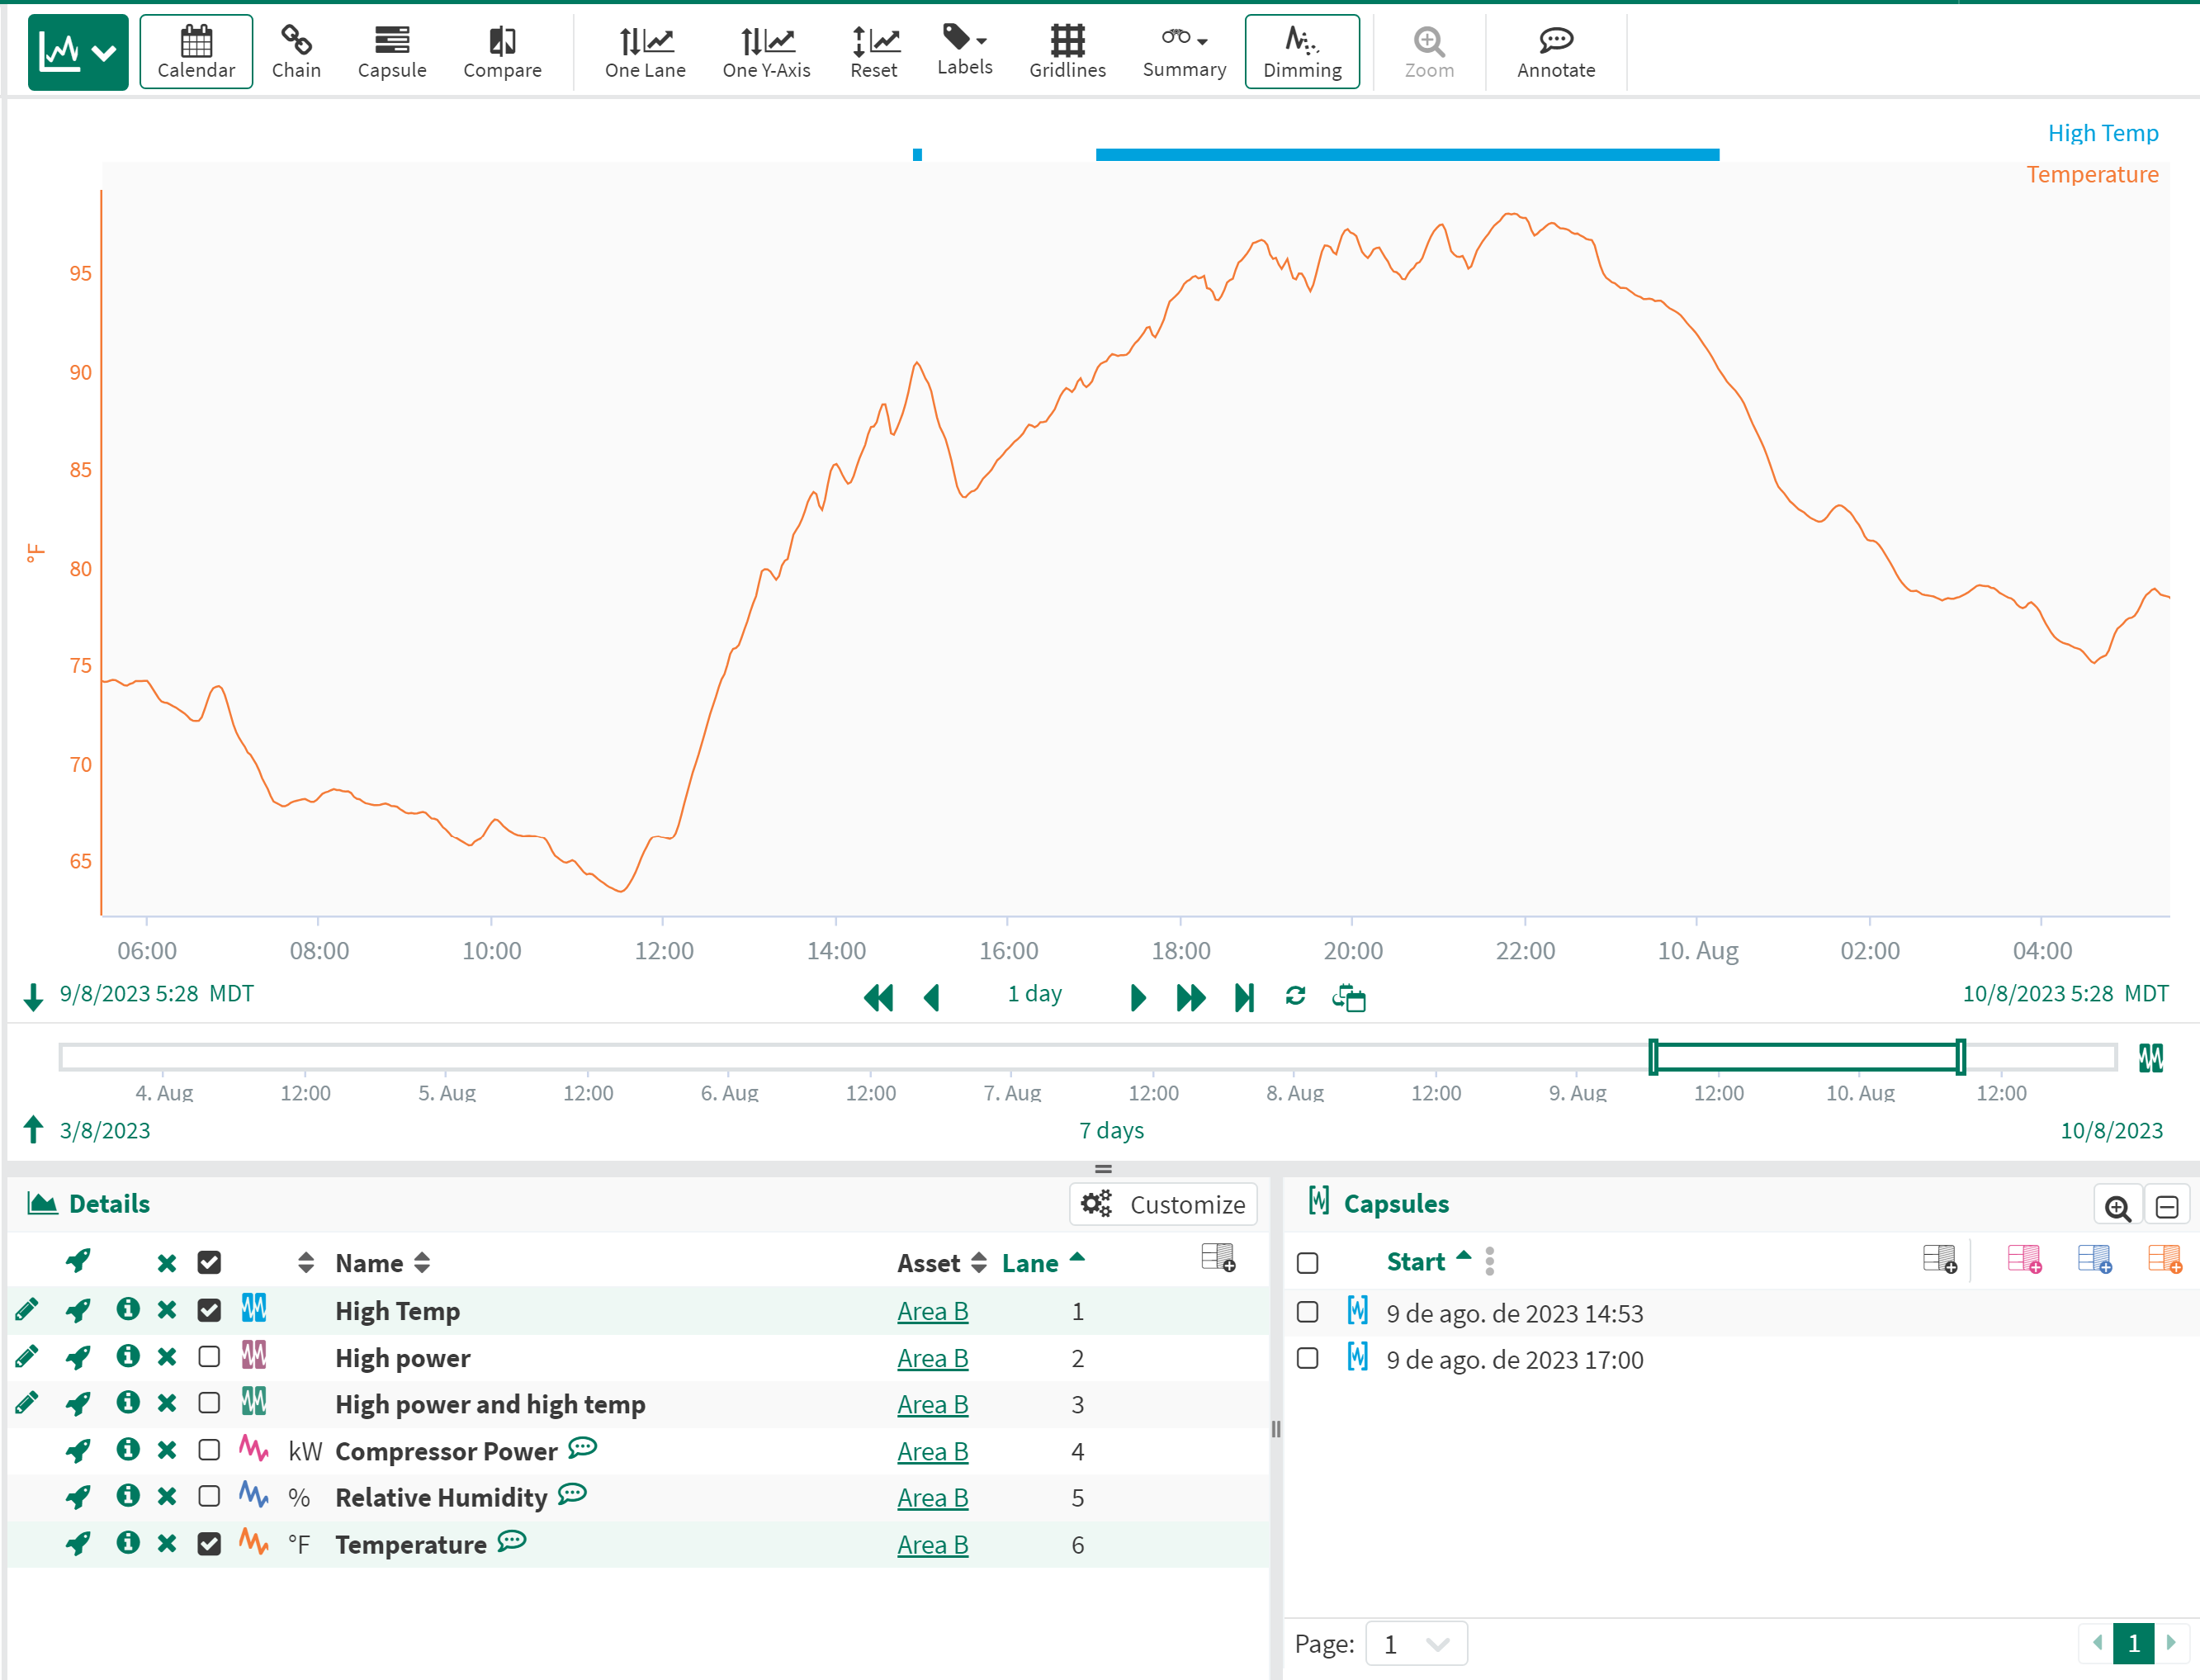
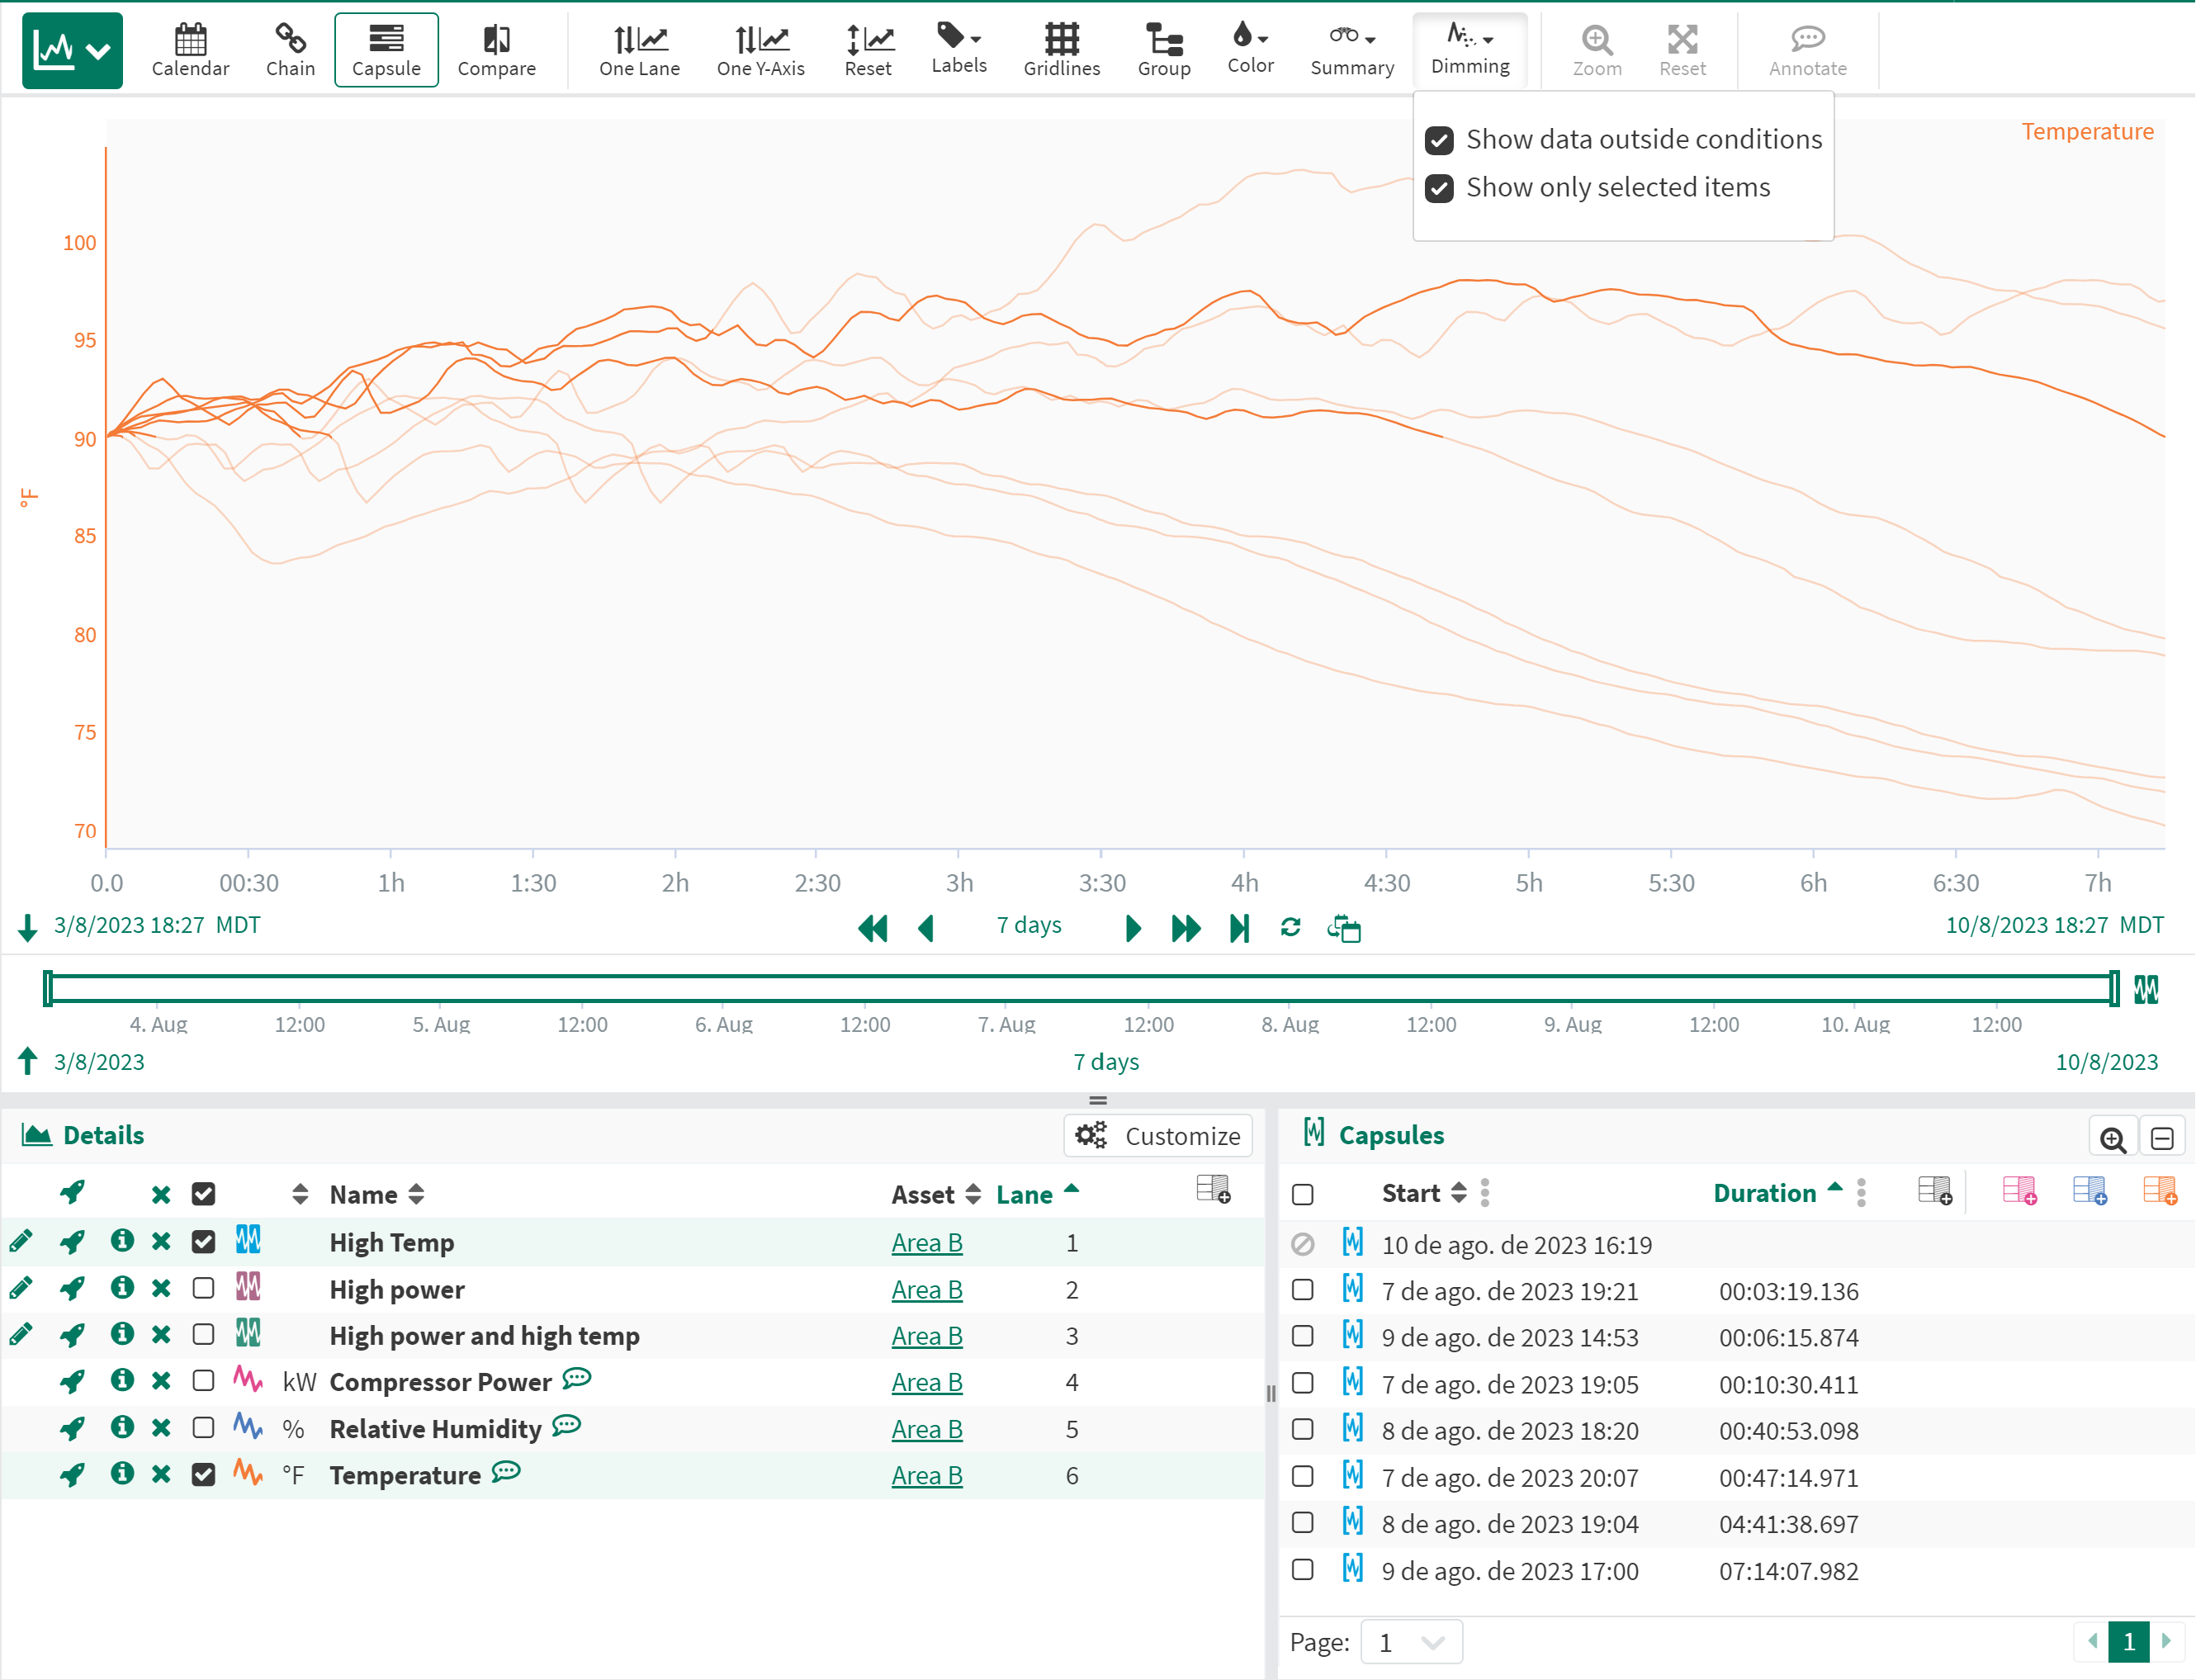
Dimming
When this button is pressed, only items selected in the Details Pane will be displayed on the trend. Un-selected items are not trended but remain listed in the Details Pane.
In Capsule View, this button displays two options, show data outside conditions or show only selected items. The first option will show data after each capsule end up to the duration of the longest capsule. The second option is the same as pressing the Dimming button in other views.
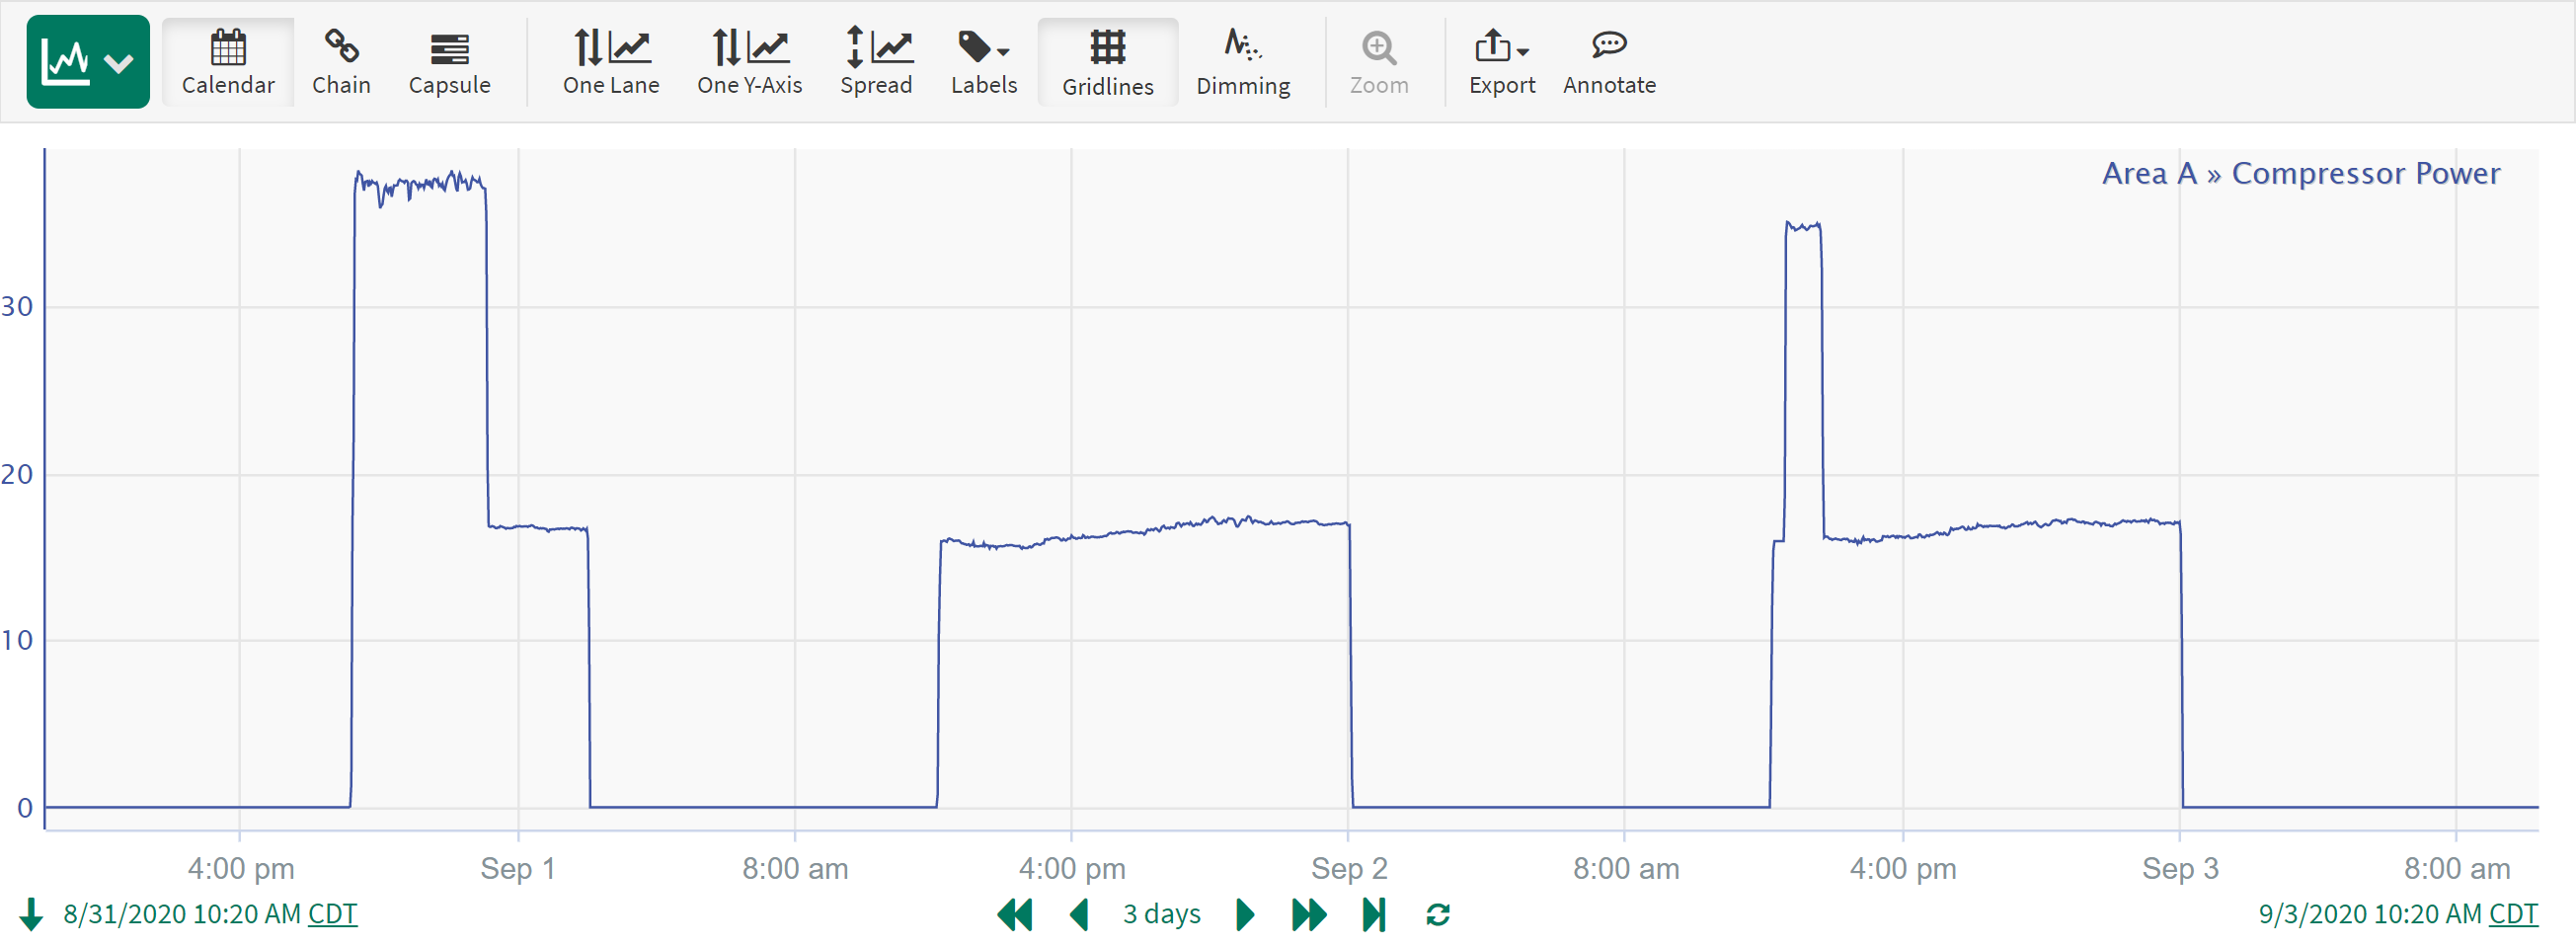
Gridlines
The Gridlines button can display gridlines across numeric and string signals. Note that gridlines can’t be shown when one lane has multiple y-axes.
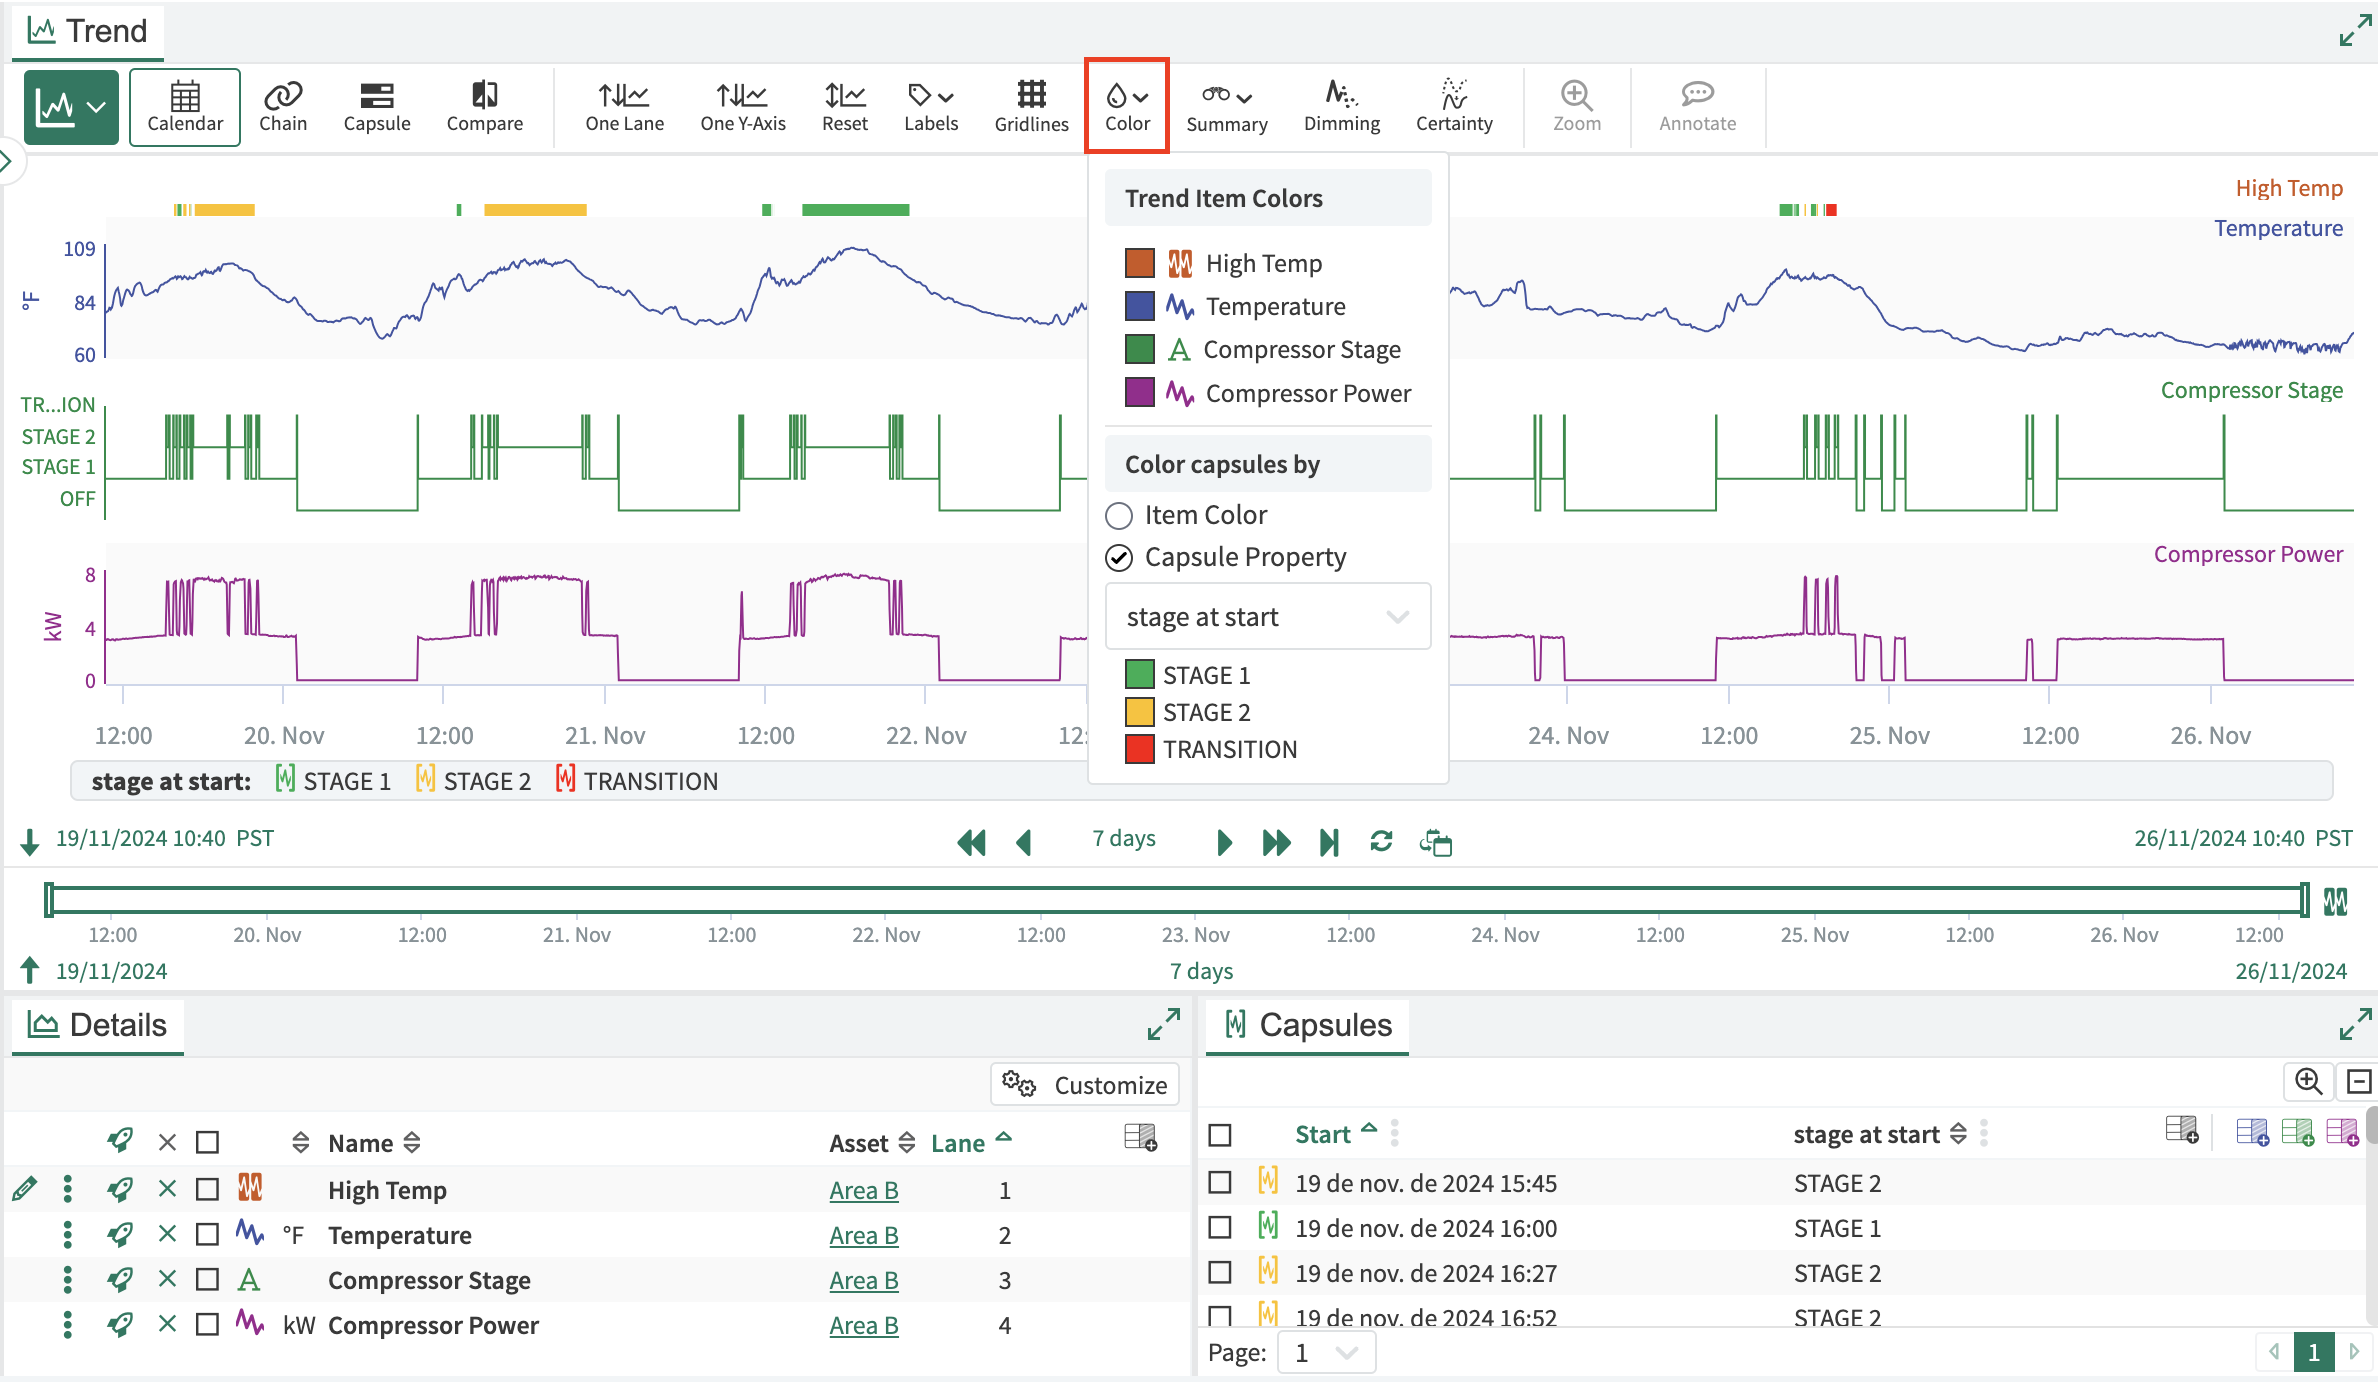
Color
The Color button can be used in Calendar, Chain, Capsule, and Compare Views to change the color of any items on the trend. Clicking on the color sample allows you to select a new color from the Seeq pallet, standard colors, or user defined colors selected using either Hex Color Codes or RGB color codes. Item colors can also be changed from the Customize menu.
In Calendar and Chain views you can also color capsules by a Capsule Property rather than by the condition color. This can be useful to visually differentiate important details about certain capsules within a condition such as the the stage a compressor was in when the temperature was high what operation was running at different points in time.
Advanced Item Formatting
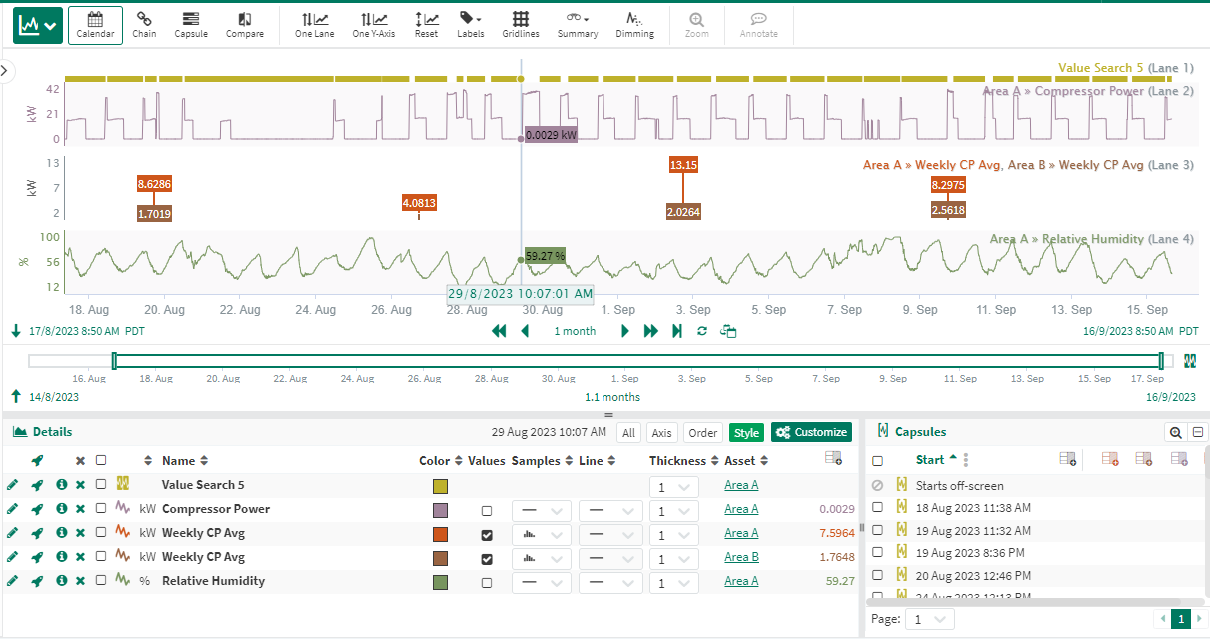
To enter the advanced item formatting mode, click the "Customize" button in the Details Pane header. In this mode, every aspect of a signal's appearance can be adjusted.
When in this mode, several additional buttons (All, Axis, Order, Style) are available next to the Customize button so you can better focus on a subset of the formatting options available.
When Customize is enabled, each lane will have an extra label in gray indicating the lane’s number. This is not displayed when Customized is disabled.
Style
Color
Clicking on the color sample allows you to select a new color from the Seeq pallet, standard colors, or user defined colors selected using either Hex Color Codes or RGB color codes. Color can also be changed from the Toolbar.
Values
When this box is selected, values for each data point will display on the trend, to the best ability based on available room. This is recommended for infrequently sampled data.
Samples
This option changes how each individual sample coming from the datasource is plotted.
Line only - No samples are shown (default).
Line and points - A point is shown for each actual sample in your datasource with connected lines. This view is particularly useful for debugging interpolation issues and data cleansing.
Points only - Only sample points from the datasource are shown. There is no visual indication of the interpolation methods between points.
Column chart - A column is drawn for each sample point. This is particularly useful to display aggregated values created using the Signal from Conditions tool.
Line
This option allows you to select a different line style to help distinguish one signal from another. These options do not represent interpolation method changes.
Thickness
This option allows you to adjust the thickness of a signal or condition. This can be used in conjunction with Line and Sample styles.
Order
Lane
This option allows you to specify the lane where each signal will be plotted.
Axis
Axis
This option allows you to select the axis grouping for each signal. The dropdown menu is a list of letters with one option for each signal currently displayed in the trend. To group signals so that they share the same Y-axis limits, select the same axis letter for each signal.
Align
This option allows you to adjust if the axis labels are displayed on the left or right side of the trend.
Show
This option allows you to show or hide the Y-axis labels.
Auto
This option allows you to auto-scale the trend to the min and max value of that signal over the current time range. These min and max values will change as users change the time range.
Axis Min/Max
This option allows you to set a fixed minimum and maximum value for a signal's y-axis. These values remain fixed as users scroll through time.
Y-Axis Type
This option allows you to change the y-axis type between a linear and a logarithmic (base 10) scale.
Note: this will not change your data, it will only change how it is displayed on the trend.