Signal from Condition
Signal from Condition enables users to create a new signal from statistical functions applied to a signal or condition when it is within another condition. One signal sample will be calculated per capsule for the new signal.
Using the Signal from Condition Tool
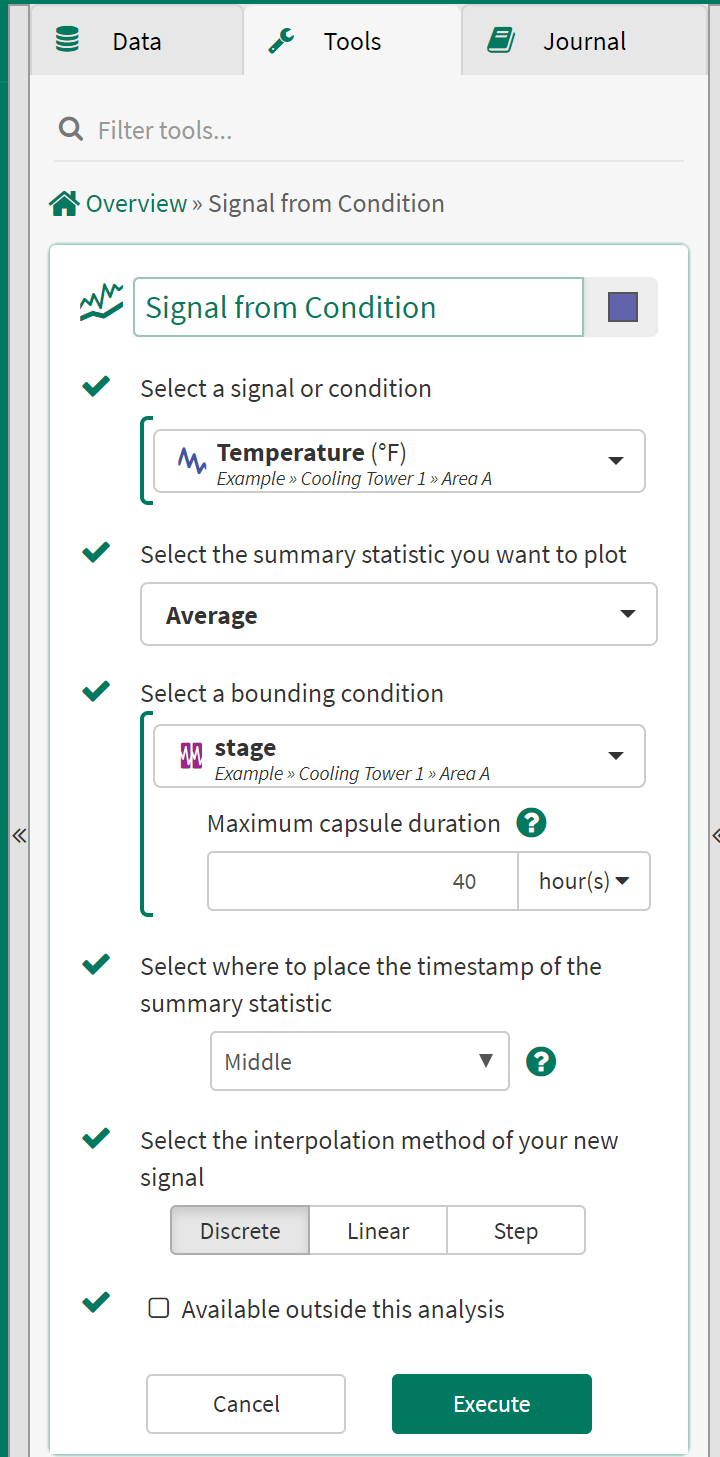
Go to Tools tab > Quantify > Signal from Condition.
Select a signal or condition: From the dropdown menu, select a series or condition from the details pane, pinned items or recently used sections. This series or condition is referred to as the input item.
Select the summary statistic you want to plot: From the dropdown menu, select the statistical function to be applied to your input item. This statistic will be calculated over every capsule in your bounding condition (selected below). Series and Conditions have different types of statistics which are available in this menu.
Select the bounding condition: From the dropdown menu, select the condition over which the input item will be summarized. For example, if you want to calculate a daily average value, select a condition here which has a capsule for every day. (Daily capsules can be created using the Periodic Conditions Tool)
Maximum capsule duration: Choose the maximum capsule duration for the bounding condition. This is the longest the capsule can be to be used for the signal from condition calculation.
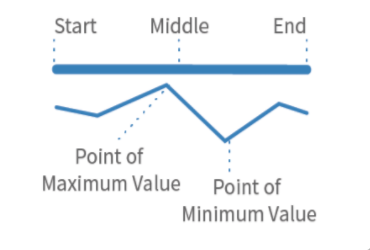
Select where to place the timestamp of the summary statistic: For each capsule in your bounding condition this tool will generate a single sample. The value of that sample is determined by the input item and the summary statistic and the timestamp for that sample is taken from a point on each bounding capsule. Options are graphically depicted below.
Select the interpolation method of your new signal: Select the method with which the trend will display and the calculation engine will mathematically represent the time between sample points.
Tip: Signals generated using this tool display particularly well using the bar chart sample format. To plot your signal as a series of bars, use the discrete interpolation method.
Available outside this analysis: Checking this box will allow this signal to be used in other workbench analysis and topics. It will be available for all Seeq users and will display in their search results. Consider using a unique name as the signal will be published to the global name space.
Examples Using Signal from Condition
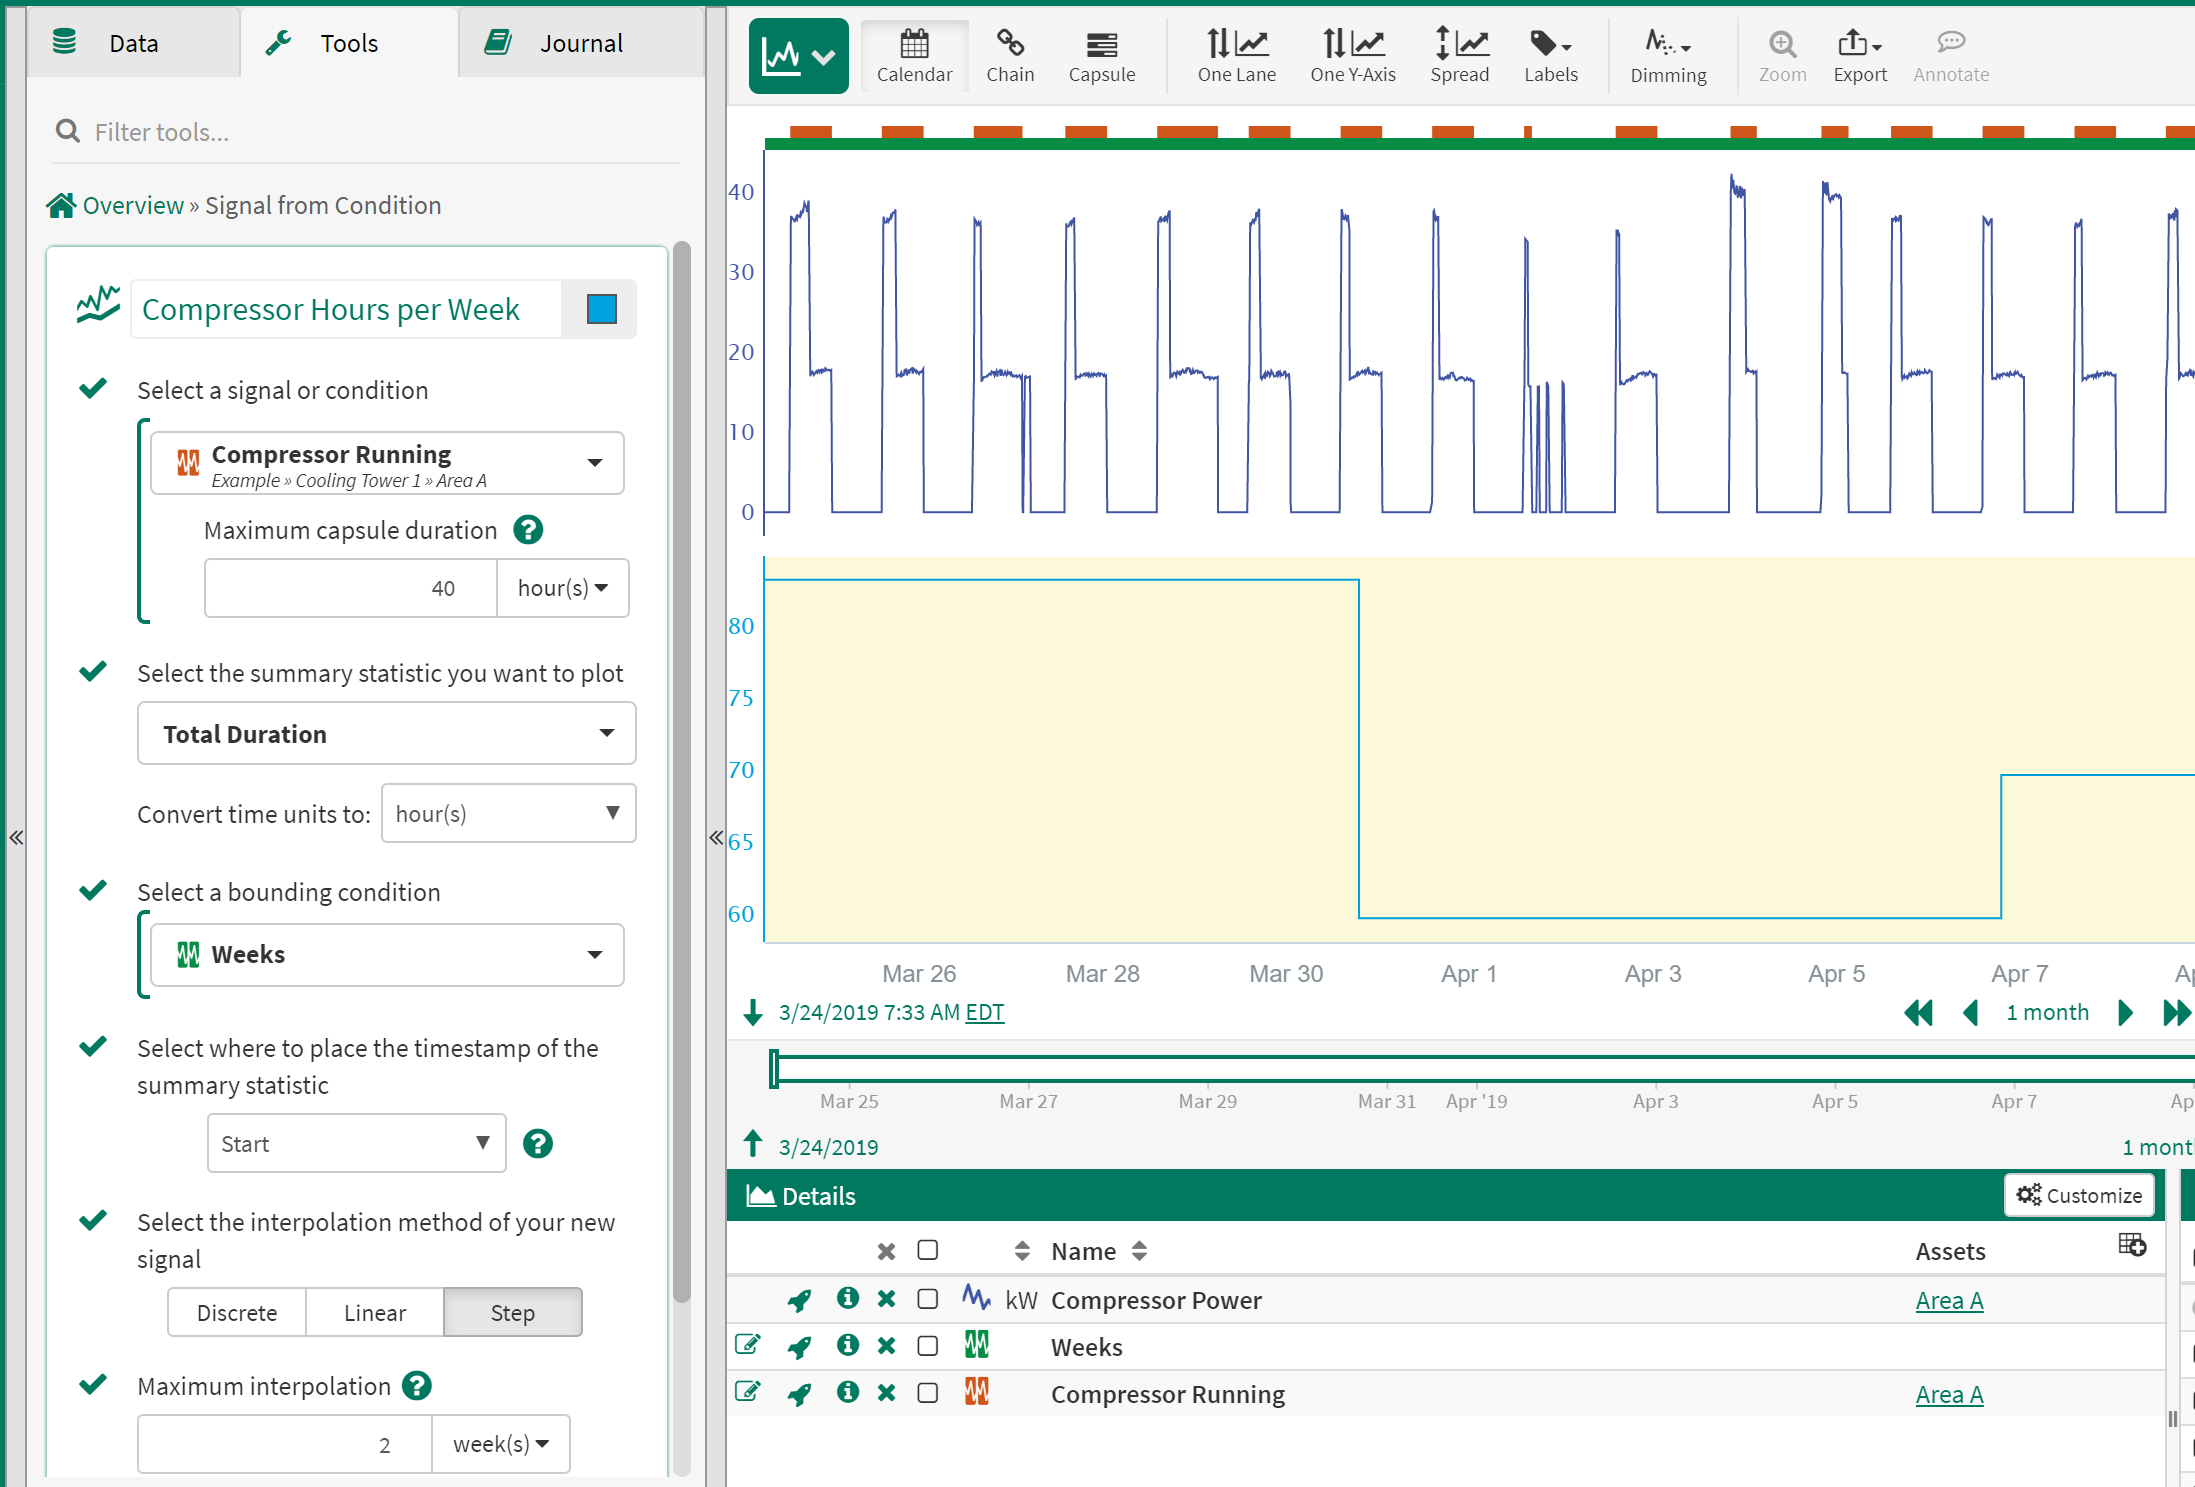
Calculate Equipment Run Hours per Week
Using the Value Search and other tools create a condition which captures when a piece of equipment is operating. Next, create capsules using the Periodic Condition tool which represent the time ranges you would like to aggregate over. For example, if you want to calculate run hours per day, create a daily condition. If you want to calculate run hours per week, create a weekly condition.
Selections in the Signal from Condition Tool
Select a Signal or Condition - Equipment running condition
Summary statistic - Total Duration
Convert time units to - Seconds/Minutes/Hours
Select a bounding condition - Time period condition
Select where to place the timestamp - Start (preferred selection for time aggregations)
Select the interpolation method - Step (preferred selection for time aggregations)
Calculate Equipment Run Hours per Week
Calculate Equipment Cycles per Week
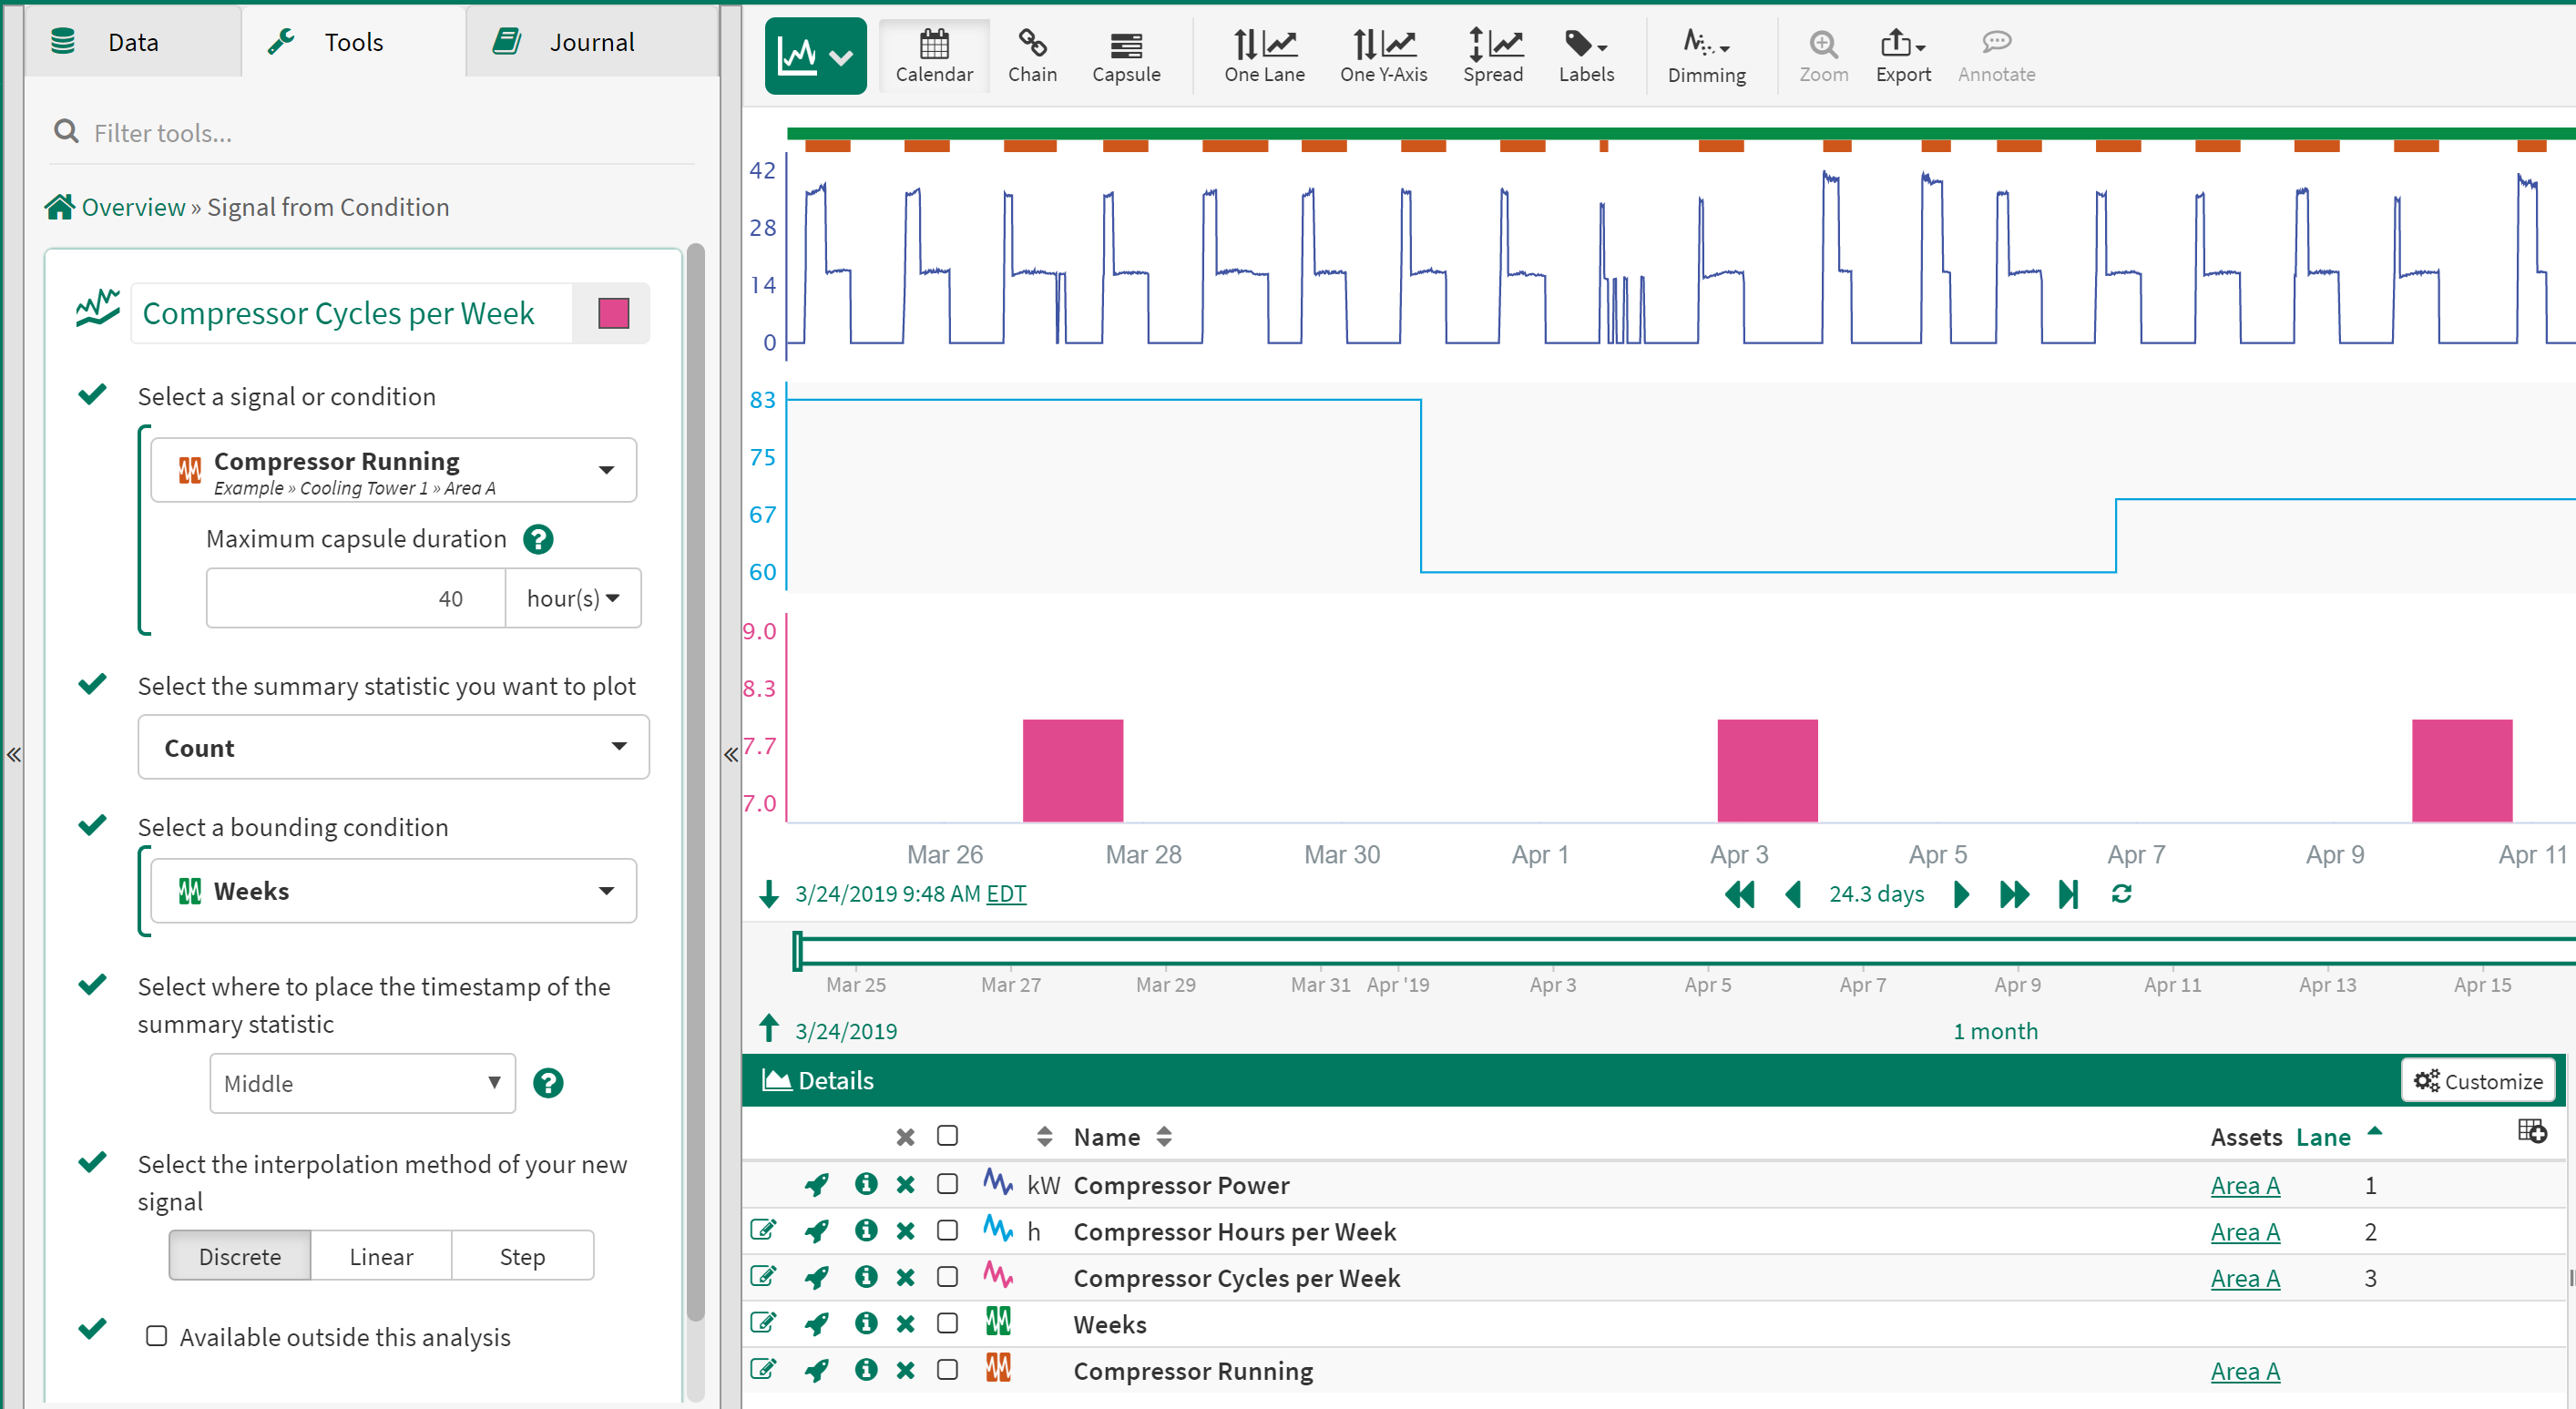
Calculate Equipment Cycles per Week
Using the Value Search and other tools create a condition which captures when a piece of equipment is operating. Next, create capsules using the Periodic Condition tool which represent the time ranges you would like to aggregate over. For example, if you want to calculate cycles per day, create a daily condition. If you want to calculate cycles per week, create a weekly condition.
Selections in the Signal from Condition Tool
Select a Signal or Condition - Equipment running condition
Summary statistic - Count
Select a bounding condition - Time period condition
Select where to place the timestamp - Middle (preferred selection for discrete interpolation method)
Select the interpolation method - Discrete (creates bar chart view)
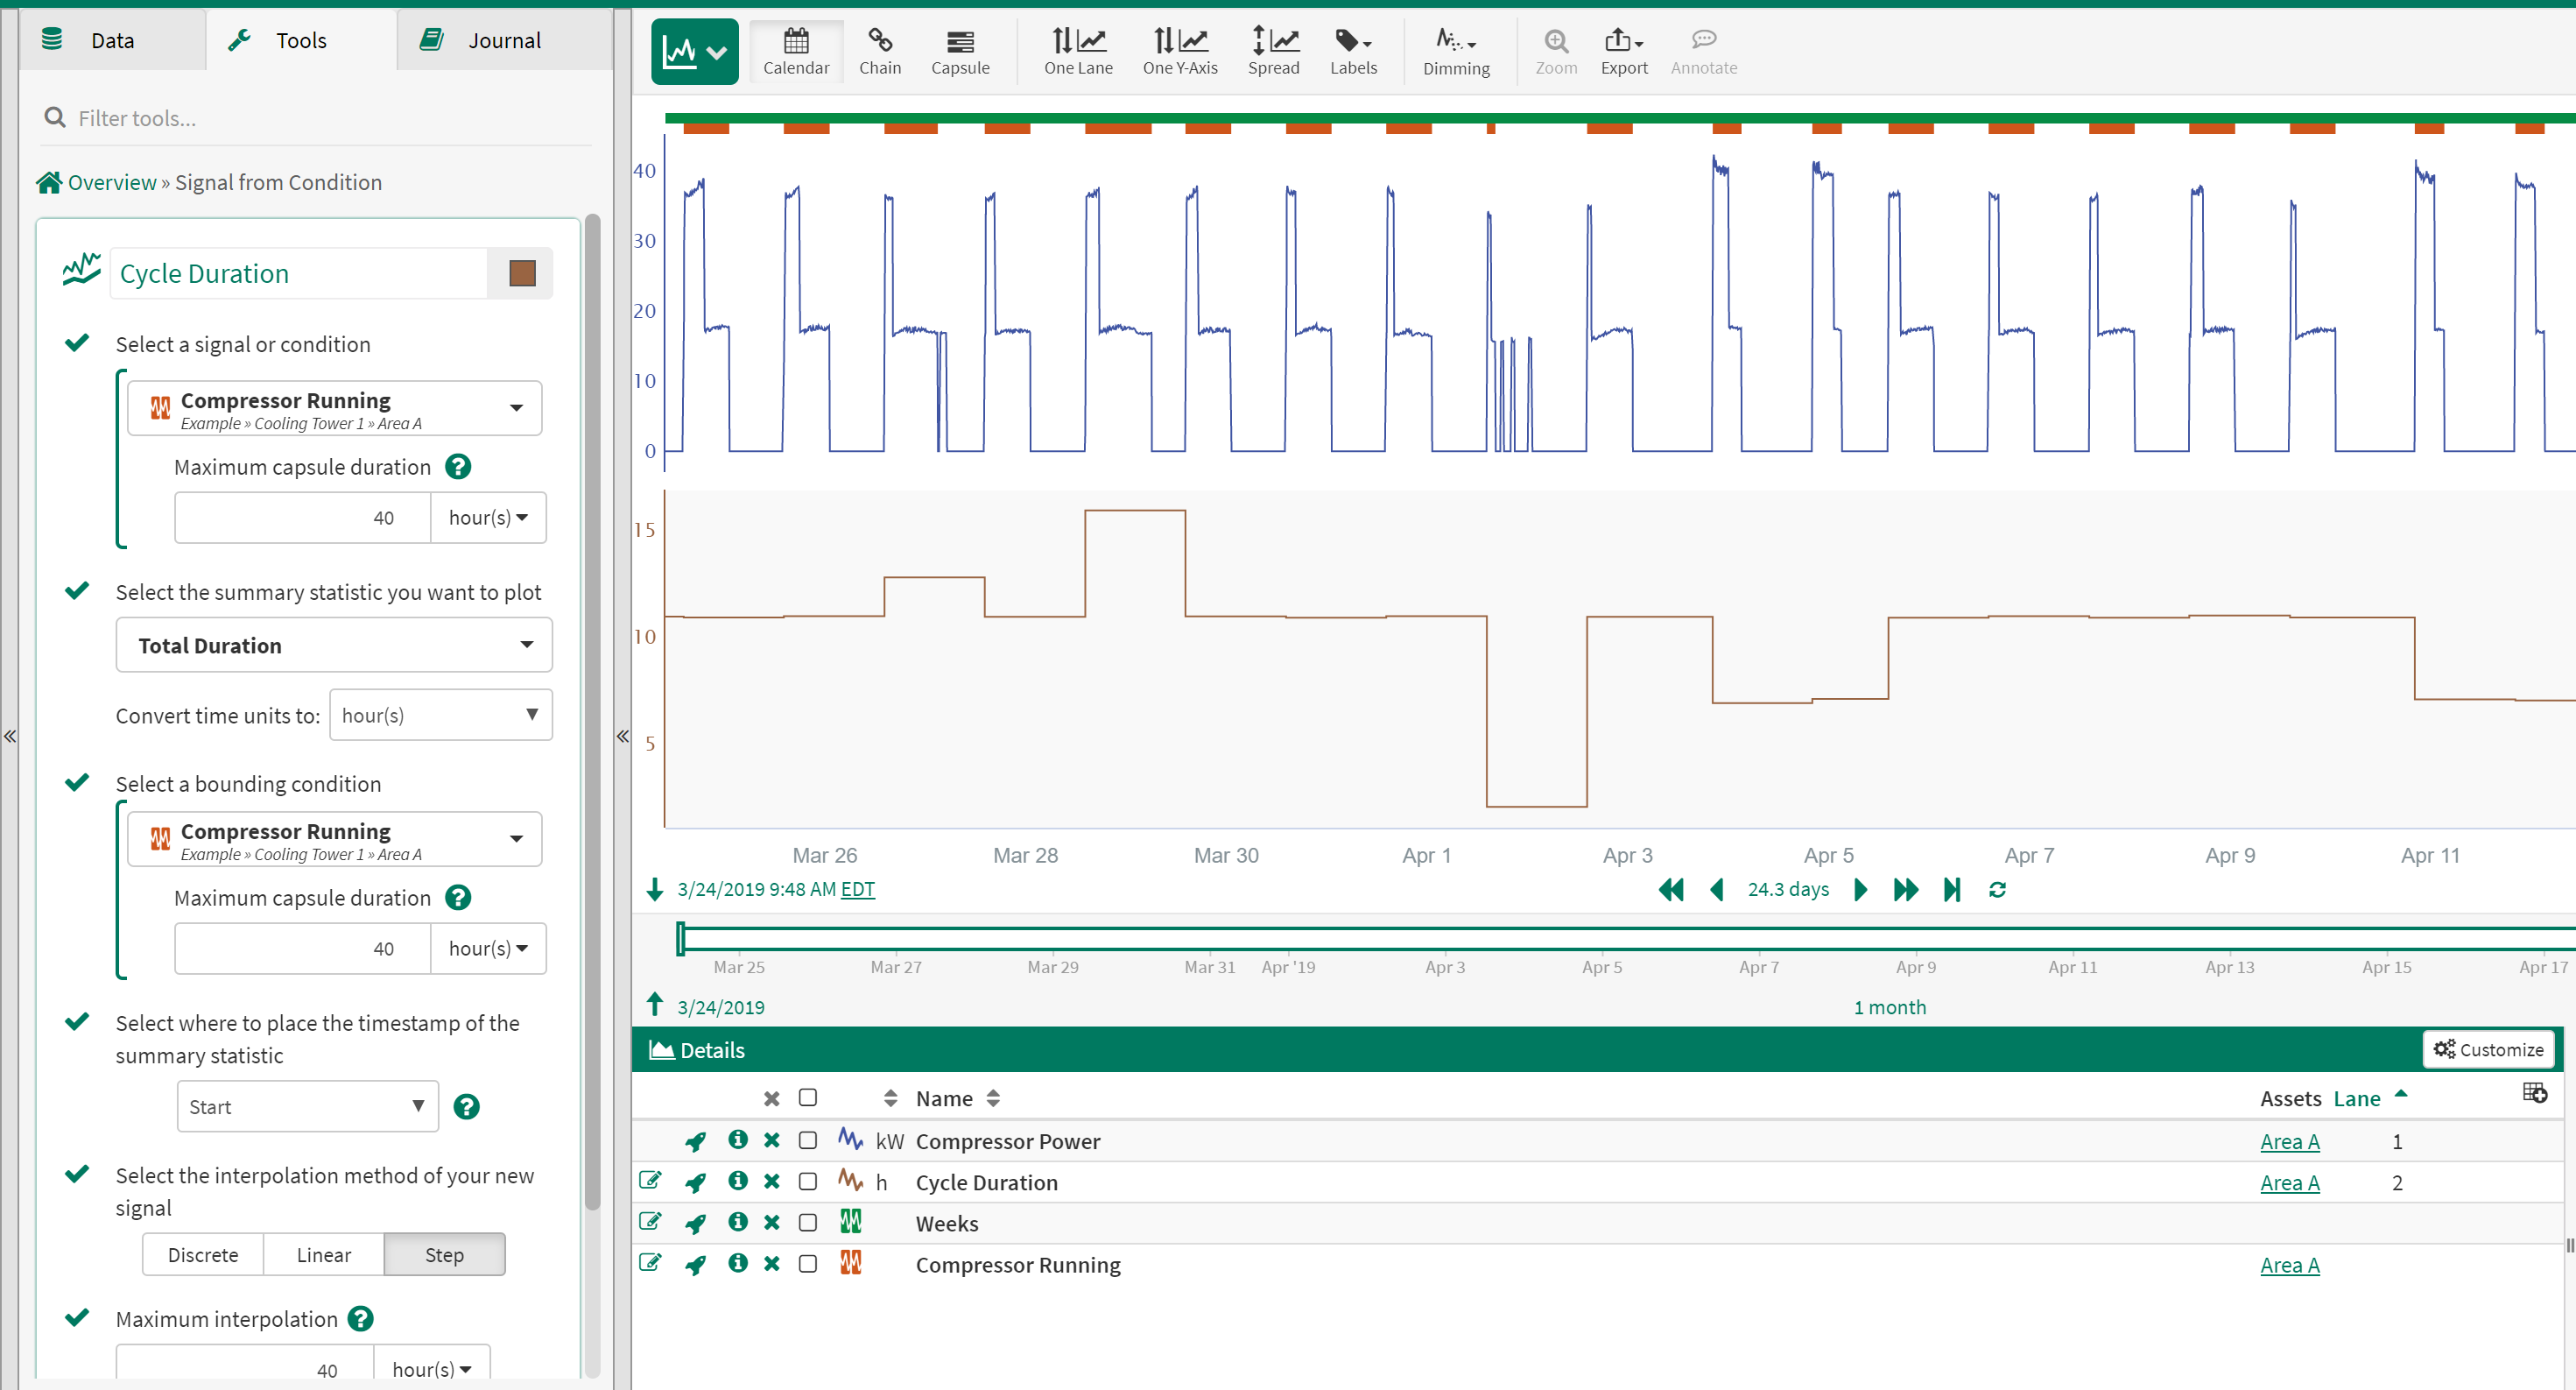
Calculate and Trend Cycle/Batch Duration
Using the Value Search or other tools create a condition which captures when a piece of equipment is operating or when a batch starts and ends.
Selections in the Signal from Condition Tool
Select a Signal or Condition - Equipment running condition
Summary statistic - Total Duration
Convert time units to - Seconds/Minutes/Hours
Select a bounding condition - Equipment running condition
Select where to place the timestamp - Start/Middle/End
Select the interpolation method - Step/Linear/Discrete
Calculate and Trend Cycle/Batch Duration