What's New?
Workbench
More powerful Tables
Grouping and aggregations in Table view will let you roll up calculations across grouped rows. You might use this in a Simple Table to get the sum of all production over a time period in a table across assets. Read more in the KB Tables & Charts | Grouping-and-Aggregating.
You might use this in a condition table to get the benefit of detailed events and an overall count compare event. You can explore your data more with grouping and aggregation in Workbench before taking it somewhere else with OData.
But wait, there’s more!
Simple Tables with more than one item can be now sorted (finally!).
You can resize column widths in Workbench if you are working with a really long bit of text. Use Auto-size column options in the column dropdown to return to default column widths.
Reorder more columns in Condition Tables. Go ahead and drag and drop scorecard metrics to be later in the table, or properties to be ahead of scorecard metric columns.
Tables can be even bigger. Did you know there used to be a 10,000 row limit on tables in Workbench? Now you can have up to 500,000 rows. You’ll likely find you can sort and filter these larger tables more quickly than you could before.
Group a simple table to get a roll up
Exploring batch operations with aggregations across capsule properties
Duplicate worksheets between workbooks
Users can choose to copy a worksheet they are duplicating to an existing workbook. This will also make copies of local asset groups and trees they may be using in the worksheet that is duplicate.

Display Trend Values
If you want to see the values of a trend, you can choose to display these in the Customize panel. This is recommended for signals that do not have very dense data.
This update is packed with even more!
Rename calculated items even more easily by selecting the name in the Details Pane and editing in line! This only works for items created in Seeq - you can’t rename something your datasource has defined.
Scatter plot dot connection colors follow dot coloring.
Right click worksheets, Seeq Home icon, or folder breadcrumbs at top of any page to open in new tab!
Organizer
Dashboards
Dashboards are a new alternative to Organizer Documents for users who may not want to work in the constraints of a word editor. Dashboards currently support Workbench and Text content. There are still times to use a Document, like for routine reporting if you still have those workflows.
Add a new Dashboard to any Organizer with the + icon at the top left. You can more freely move content around the page. Date Ranges and Asset Selections apply just as they do in Documents. Tables in Dashboards can have a fixed height and become scrollable. Read more in the KB Inserting Content - Dashboards.
Sort and Filter Tables in Organizer
Both viewing and editing users can use sort and filter in Organizer Documents and Dashboards to update tables displayed. Changes made are transient and will not remain the next time the page is loaded. In order for a consistent sort or filter on any table, apply it in Workbench before inserting the content in Organizer.
Notifications History
Have you felt a need to troubleshoot your email notifications? Check out the Notification History accessed through the user icon. The last 7 days worth of email notifications will be searchable here. Non-administrators will only see their own notifications, while administrators will see all notification traffic.
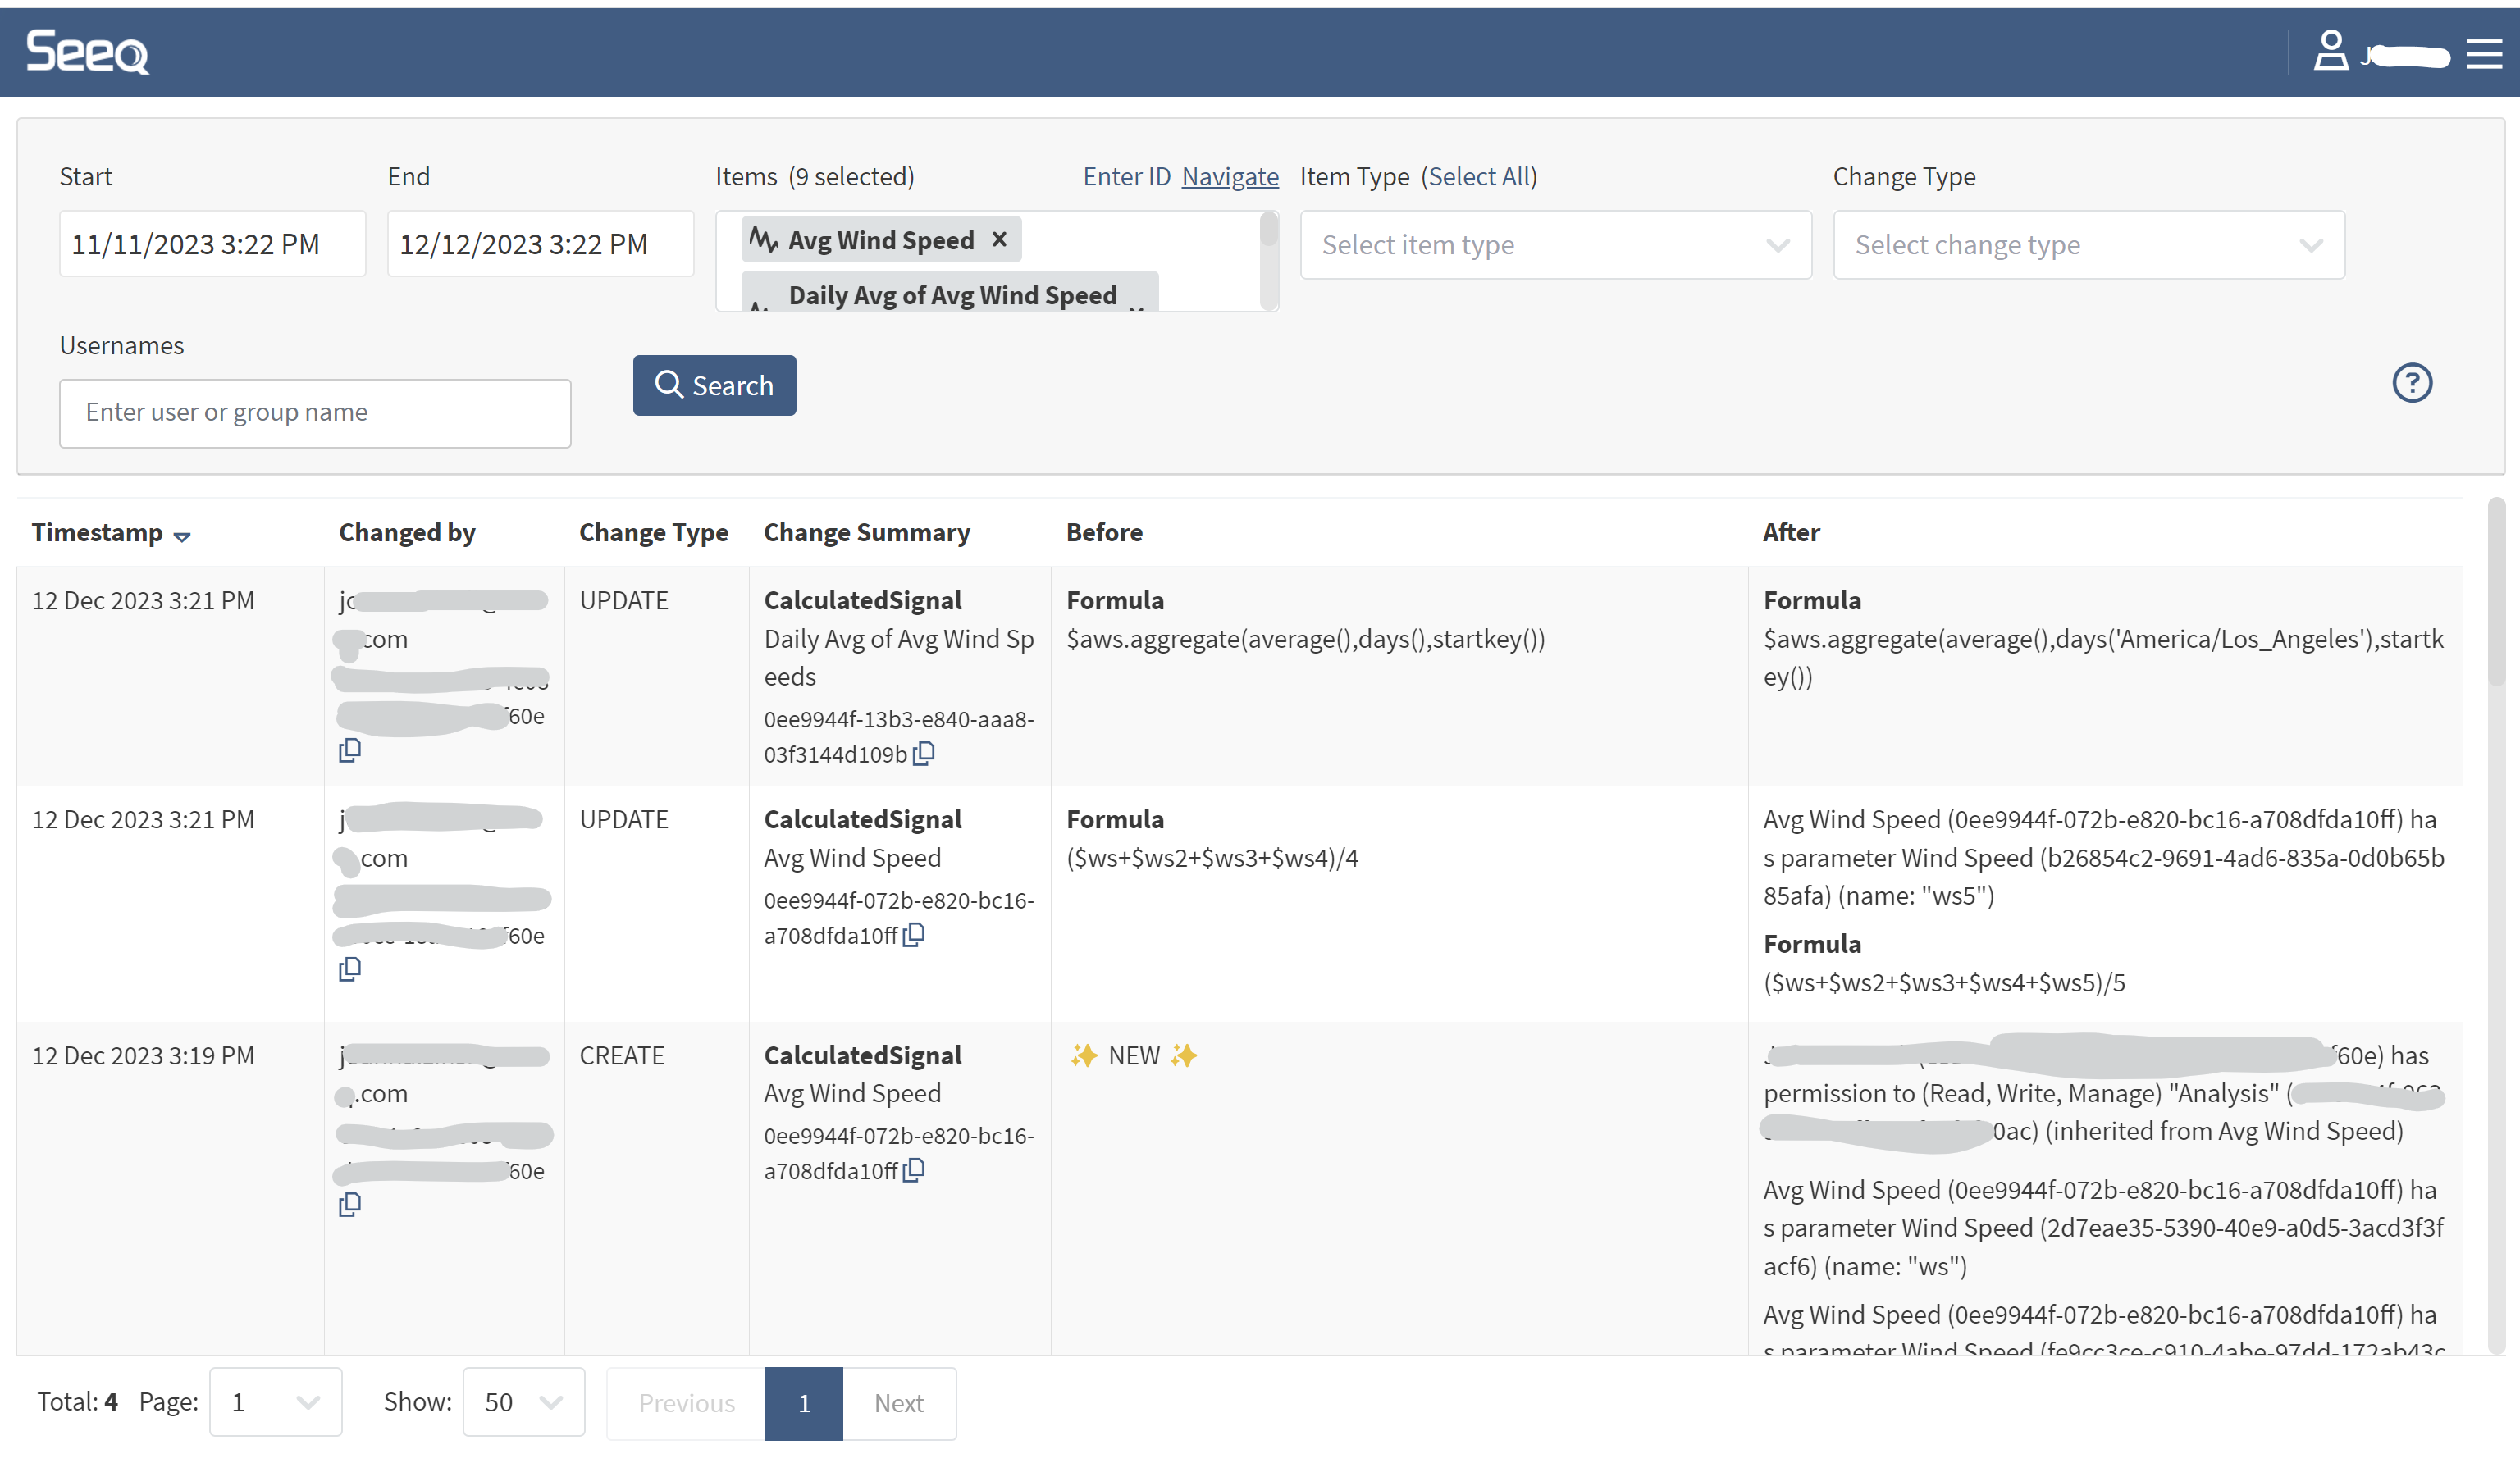
Audit Trail Legibility Improvements
Audit Trail users can now spend less time in the API trying to understand what entries mean. While UUIDs are still present to show exactly what items may have been changed, the Audit Entry interface has been cleaned up to make auditing Seeq something a human can do.
OData Exports
Gone are the days of running into memory limits because you are trying to export too much data. Users of the new modern OData export protocol can now take advantage of streaming OData. Check out the OData page for more information about the modern v4 protocol.
Administrators
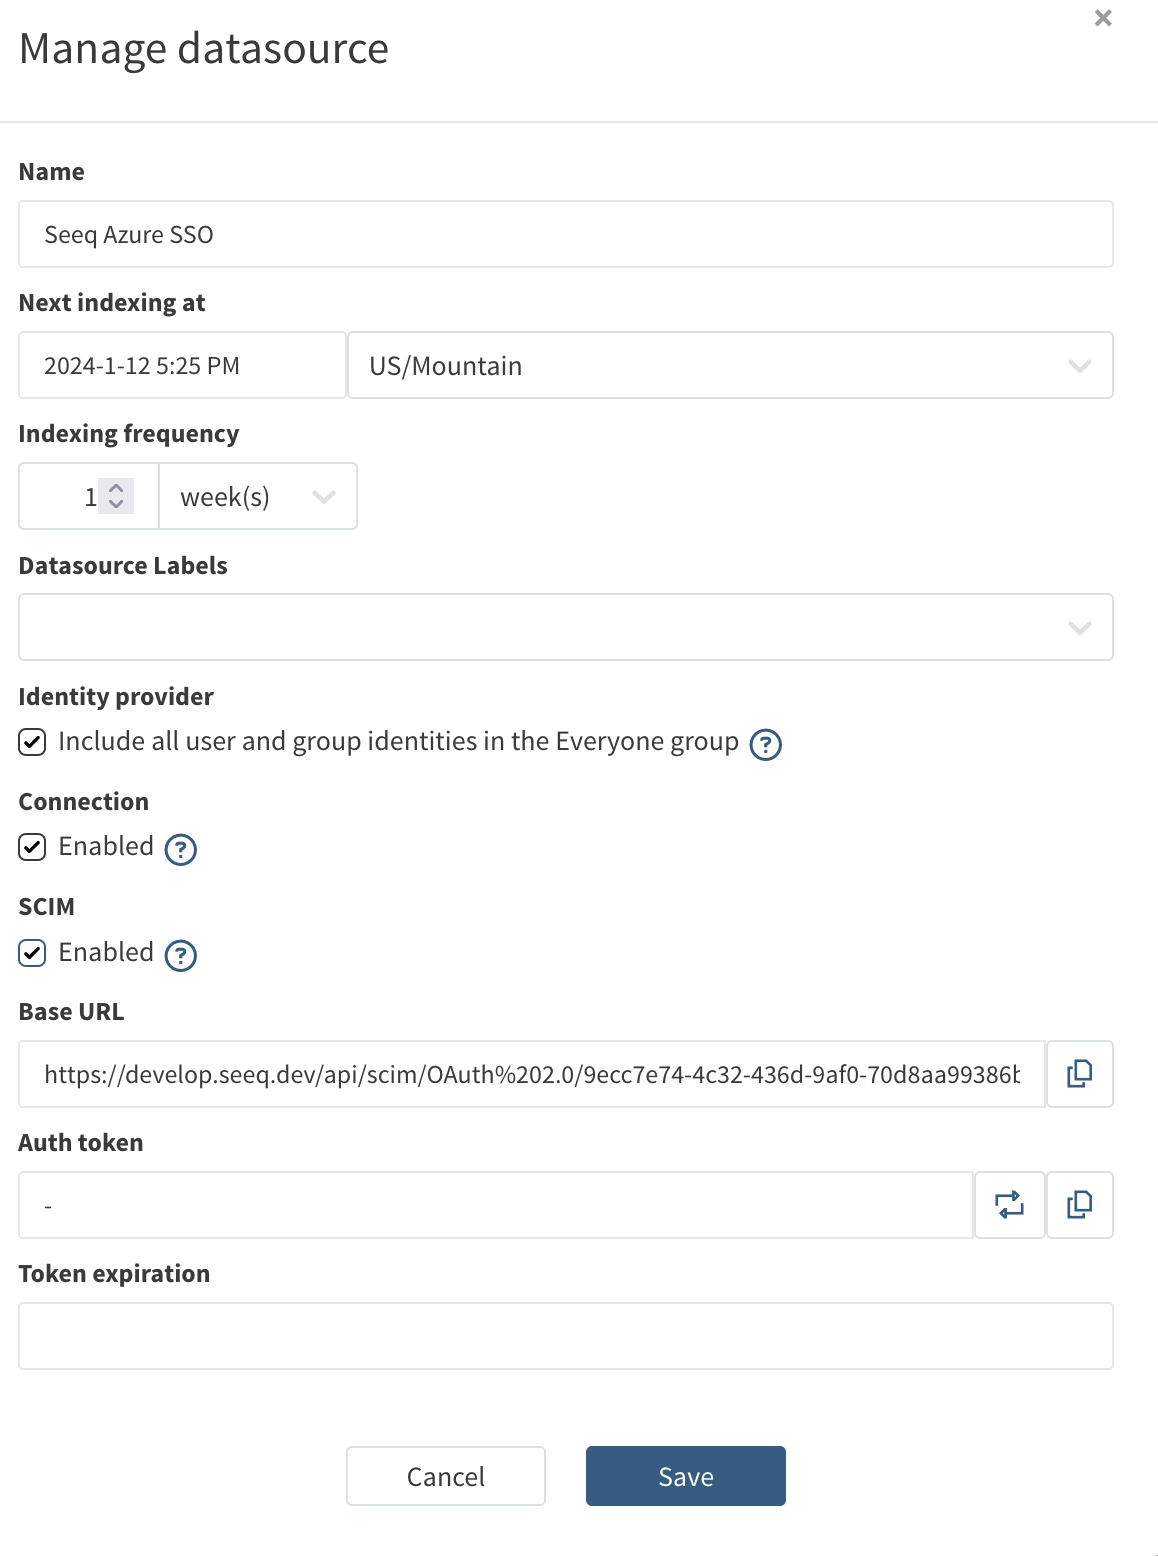
SCIM Support
Seeq administrators can now manage users with the SCIM protocol. After adding an OAuth 2.0 authentication provider, Seeq Administrators will be able to enable SCIM. This allows system administrators within an organization to manage users and groups in Seeq from their identity management platforms. This includes synchronizing users, groups, memberships, and user removals from any identity management platform that supports SCIM 2.0.
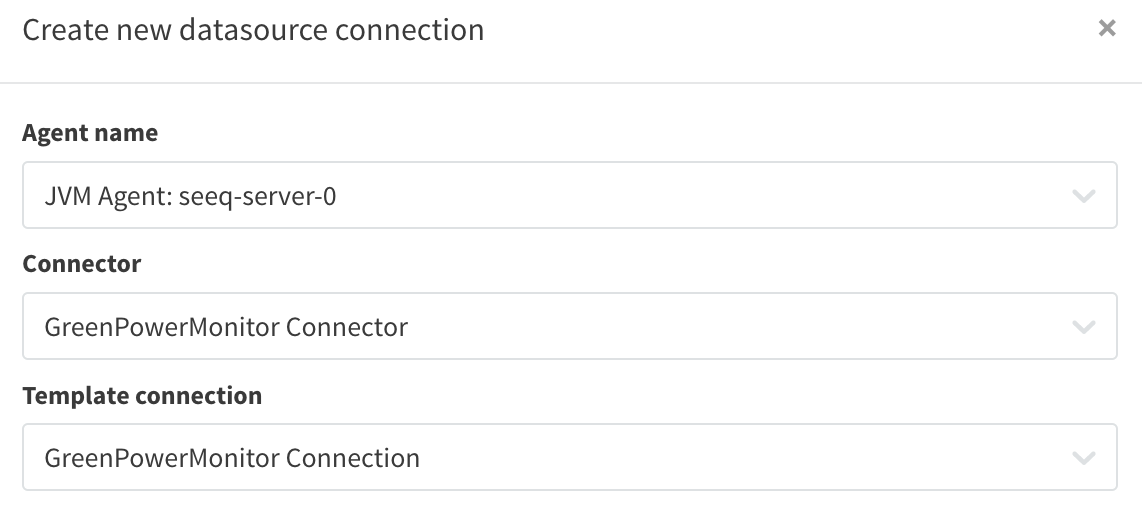
Green Power Monitor
Customers that use Green Power Monitor can now connect to the GPM Portal to analyze their data within Seeq.
REST API Query Method for IP.21 Connections
IP.21 can now be configured to connect to Aspen’s REST API rather than SQLPlusX. This allows for easier configuration for cross-firewall applications, as well as improved performance in several cases.
Encoded Sensitivity Label into Exports
Administrators are now able to encode a static string in the metadata of exported documents, PPT , Excel, and PDF. This mechanism allows you to identify data that was exported from a system like Seeq using 3rd party security platforms. This feature can be enabled from the Admin panel under Features/Export/SensitivityLabel
Read more in the release notes.
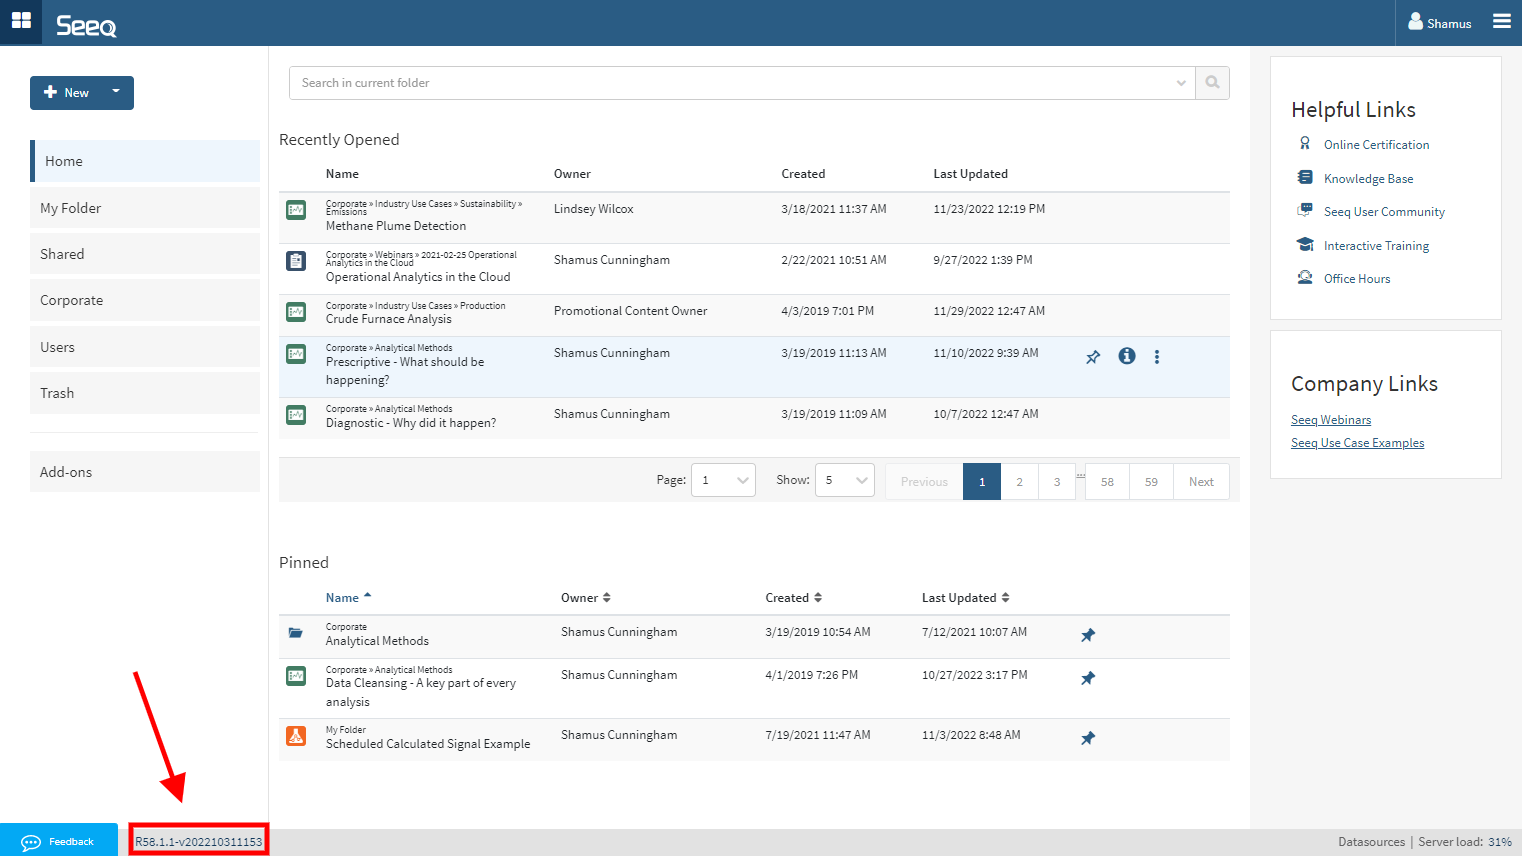
Check out the lower left corner of your Seeq browser window to see which version you have.