What's New?
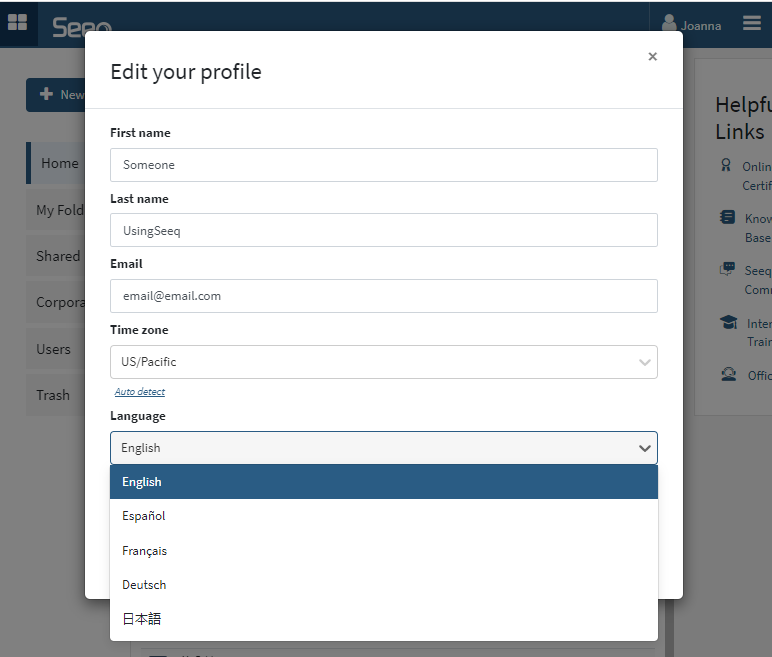
Seeq Habla Español
Spanish is the most recent addition to the growing list of supported languages. Select it from the language dropdown in your User Profile to work with Seeq in Spanish.
Workbench
Bulk Modify Asset Group Calculations
Asset Groups has long had a feature to add a calculation, but previously you had to edit the formula one by one for each asset or delete the column and recreate it. Now you can simply check a box at the bottom of the formula window in the Asset Group Editor to apply the formula changes to that calculation on all other assets. This makes it easier to iterate on calculations inside an Asset Group.
Customizing Details Pane
Over time Seeq has added a lot of options for customizing the display from the details pane. We have split the options into 4 buttons, keeping the old view under “All” and adding three new views, Axis, Lane, and Style, to make it easier to find the customization you are looking for.
Changing Order of Conditions
Users have always enjoyed the ability to easily customize the order of signals on the display using the Customize button. Now you can also change the order in which conditions show up on the display.
Boundaries are now Metrics
We’ve had two tools that create shaded regions on the trend for a while and needed to simplify things. The Boundaries Tool has been removed and you will find all boundaries have been migrated to new metrics. Don’t worry, anywhere you had a boundary displayed will still look the same until you remove the signal from the display, but you will no longer use eyeballs to turn colored regions on and off. If you remove the signal with the boundary displayed, you will need to add the metric to get the colored region back.
You will get notified of this change with a little pop up message and can click on a link in that pop up to show you the Item Usages for that item (first available in R55), which will include the new metric with Boundary in the name for you to add to your display and modify to your heart’s content.
New columns for Condition Tables
This release brings more flexibility to columns that can display in Condition Tables. Now you can also add Condition Name and other Condition Properties to the Condition Table.
Organizer
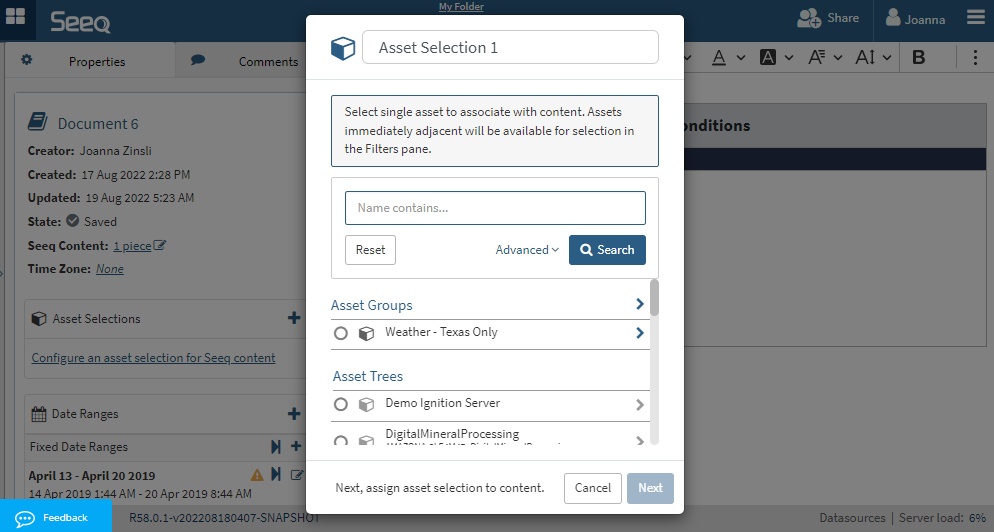
Asset Groups are more discoverable for selection
No longer search for an asset group to associate it with an asset selection after content is inserted in Organizer! Just find them on the list like you do in Workbench after you’ve inserted content from the workbook where they were created.
Data Lab/SPy/API
If you use or have created Add-ons, you may encounter some challenges when upgrading to R58 or later versions. For more information on updating your Add-ons, please visit the Tips and Tricks page.
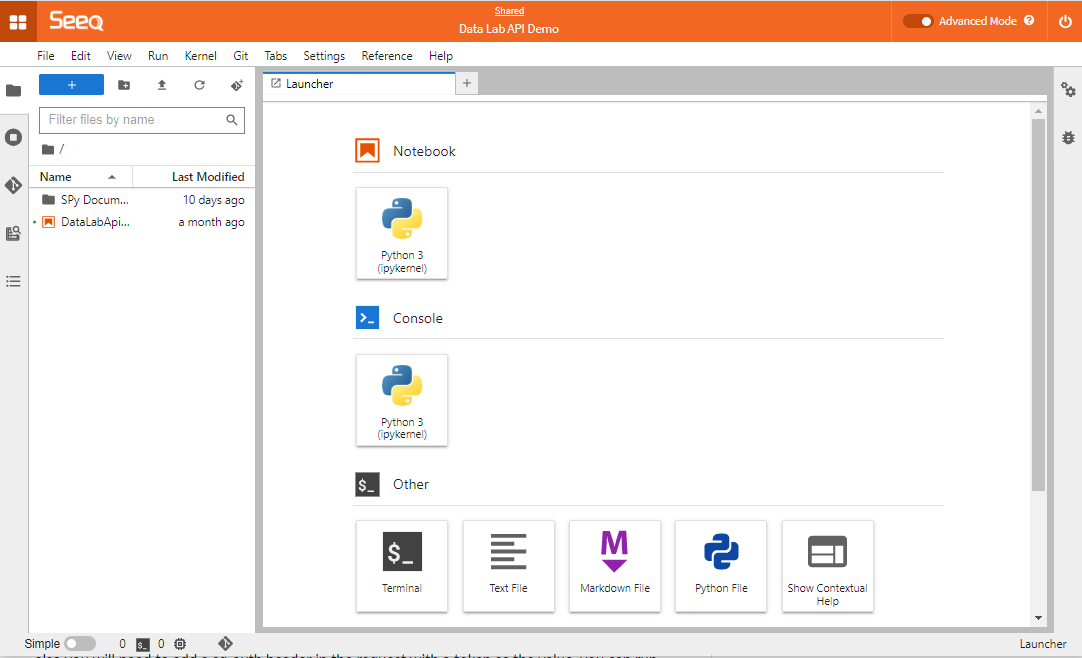
JupyterLab
Any Data Lab Notebook can be worked in JupyterLab by toggling the Advanced Mode in the header.
JupyterLab is a more feature rich environment that gives users all kind of flexibility. Your settings are yours and yours only and are persistent across all projects. Some of the exciting features are—but not limited to — Git integration, debugging, Dark Mode. Tabs can be moved around to your likings. We encourage you to go and explore. Kick the tires. If you like it you can set this as your default by checking the “Advanced Mode as default” in the Settings menu.
Data Lab Functions for Frontend Add-ons
We’ve worked some magic and now you can use a Notebook in a Data Lab Project as an API endpoint for frontend Add-ons. This means that you can develop an Add-on that more seamlessly integrates into the Tool Pane or Display, loads quicker, and doesn’t have to pop out into a new tab or window.
We are still working on the documentation, but this was too good to not tell you. Contact us for more information.
Administrators
Data Usage
A new tab in Administration gives insight on how Seeq is used, specifically how much data is flowing through Seeq. Use this interface to aggregate how the data flows by date, user, type, or source. Filter by individual users or groups.
You might use this to identify your super users and which types of Seeq content are frequently accessed. Read more in the KB.
Note that previous versions of Seeq did not track the source (URL) of usage, so there will be many N/A entries looking back at previously existing data. The majority of usage going forward will have a source and URL associated.
Read more details in the release notes.
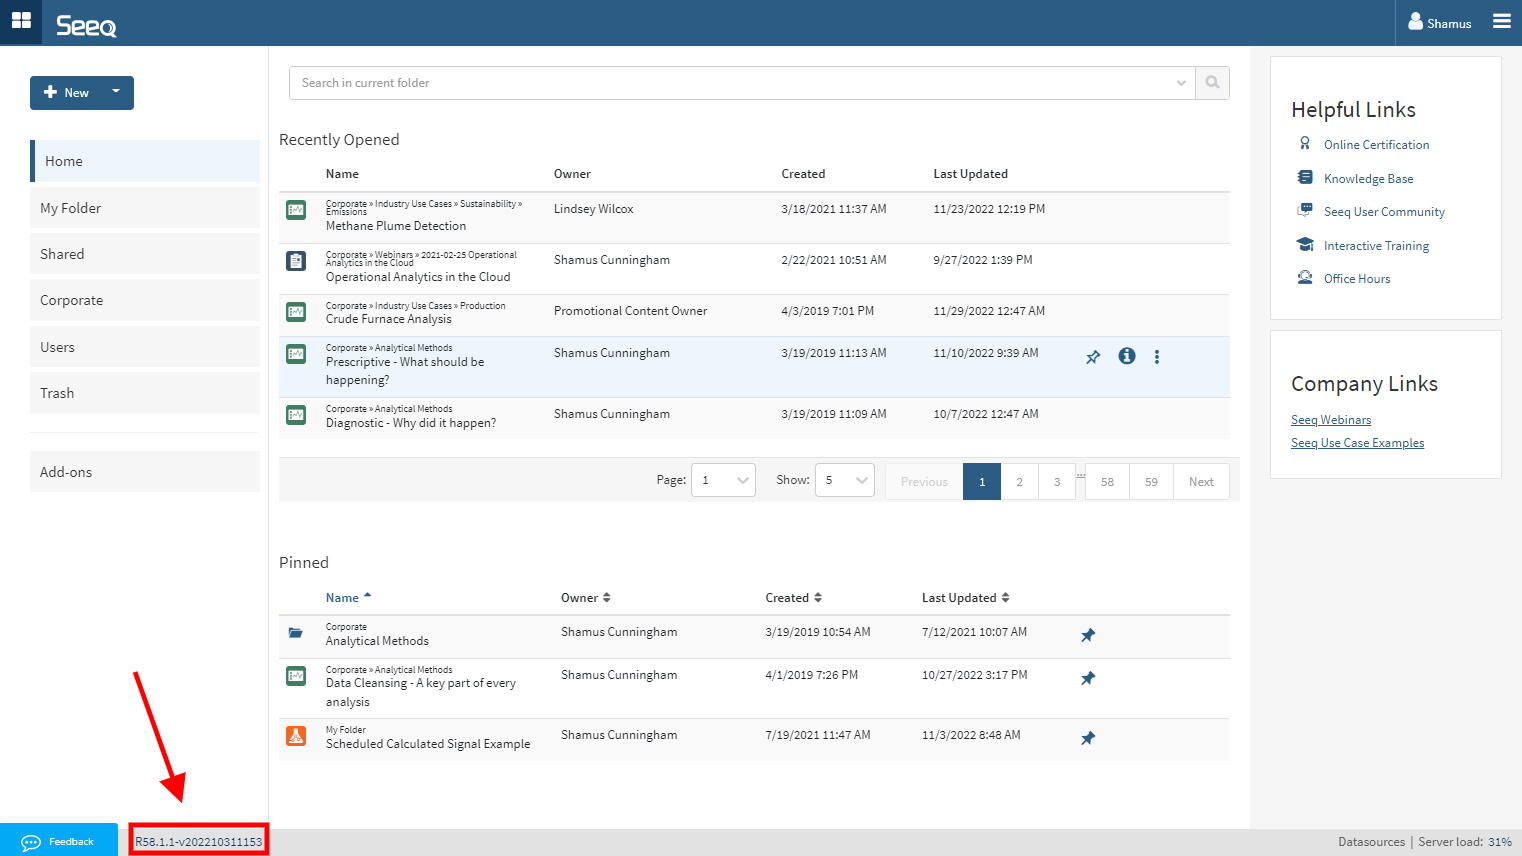
What’s New Demo
Check out the lower left corner of your Seeq browser window to see which version you have.