
What is Seeq?
Seeq offers 3 browser-based apps:
-
Workbench (trending & data analytics)
-
Organizer (auto-updating reports & dashboards)
-
Data Lab (deploy Python scripts)
So you can work, collaborate, & share, anytime & anywhere. Analytics & visualizations can auto-update as new data are recorded.

Access All Data in One Place
Search for your data and click to add it to the trend.
Your IT/Admin sets up data connectors to historians, SQL data, & much more.
Seeq handles data with different sample spacing (gridding) using automatic cross-interpolation, eliminating hours of manual work.

Analyze Data
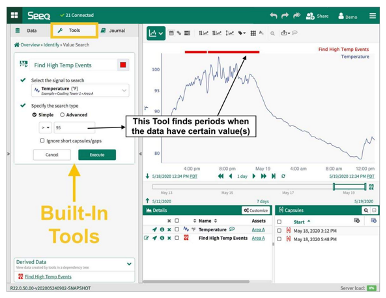
with point-&-click tools in the Workbench app.
Seeq has built-in tools for:
-
Contextualization (identifying periods of interest)
-
Data cleansing
-
Calculations, including custom calculations
-
Modeling & prediction
Deploy Python scripts, use no-code ML Add-ons, and make your own Add-ons in Data Lab.
Visualize Data
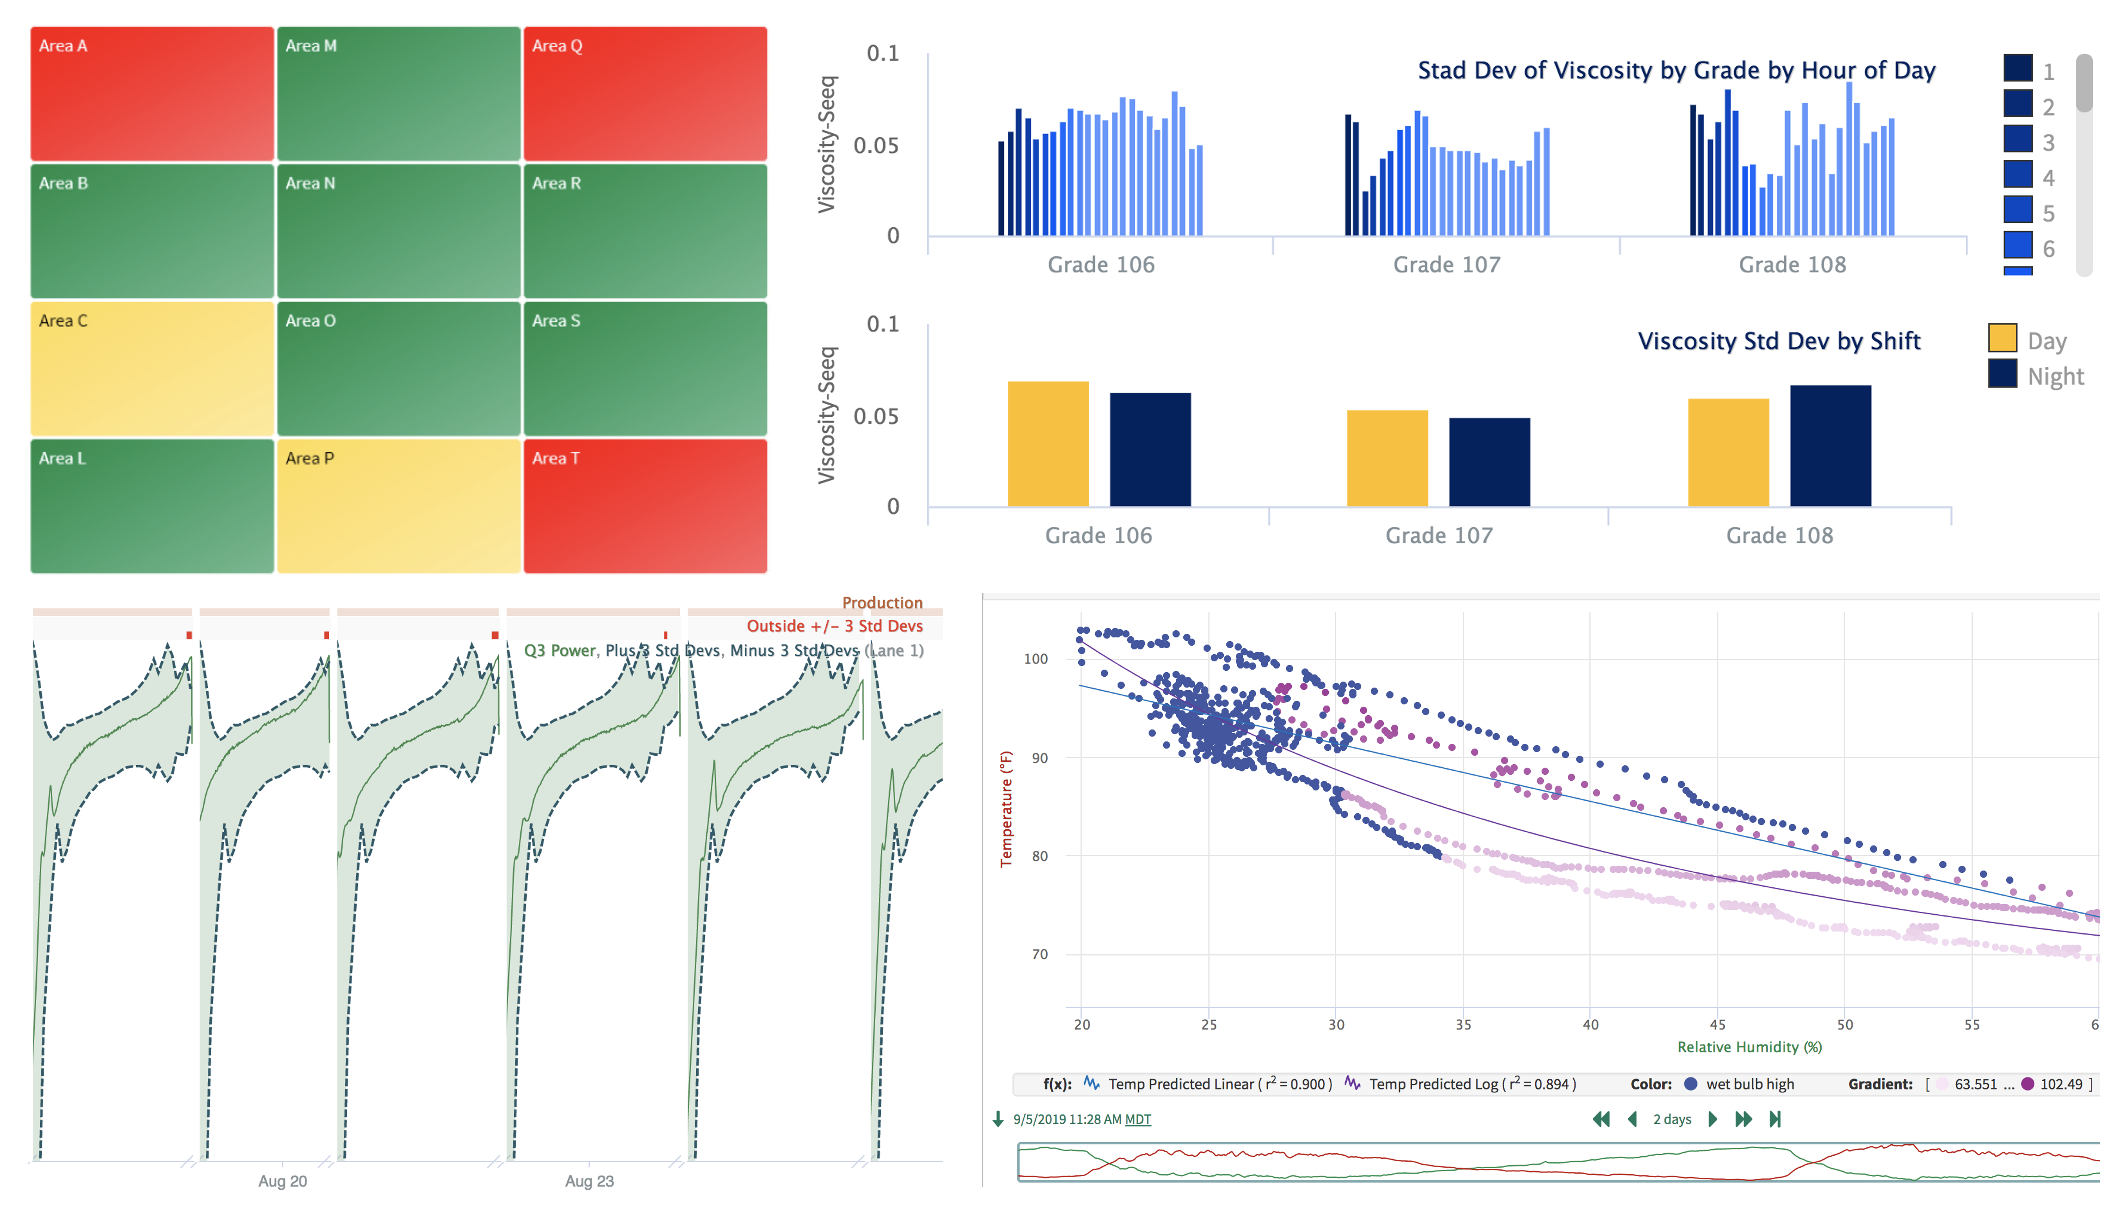
Interactive trending enables you to find insights quickly.
Seeq also features XY plots, bar graphs, tables, a variety of built-in chart types, asset tree maps that show you alerts occurring across groups of similar units, various "event" views, & more.
Bookmark any step or view to quickly return to that moment in your analysis.
Auto-Updating Reports & Dashboards
in the Organizer app.
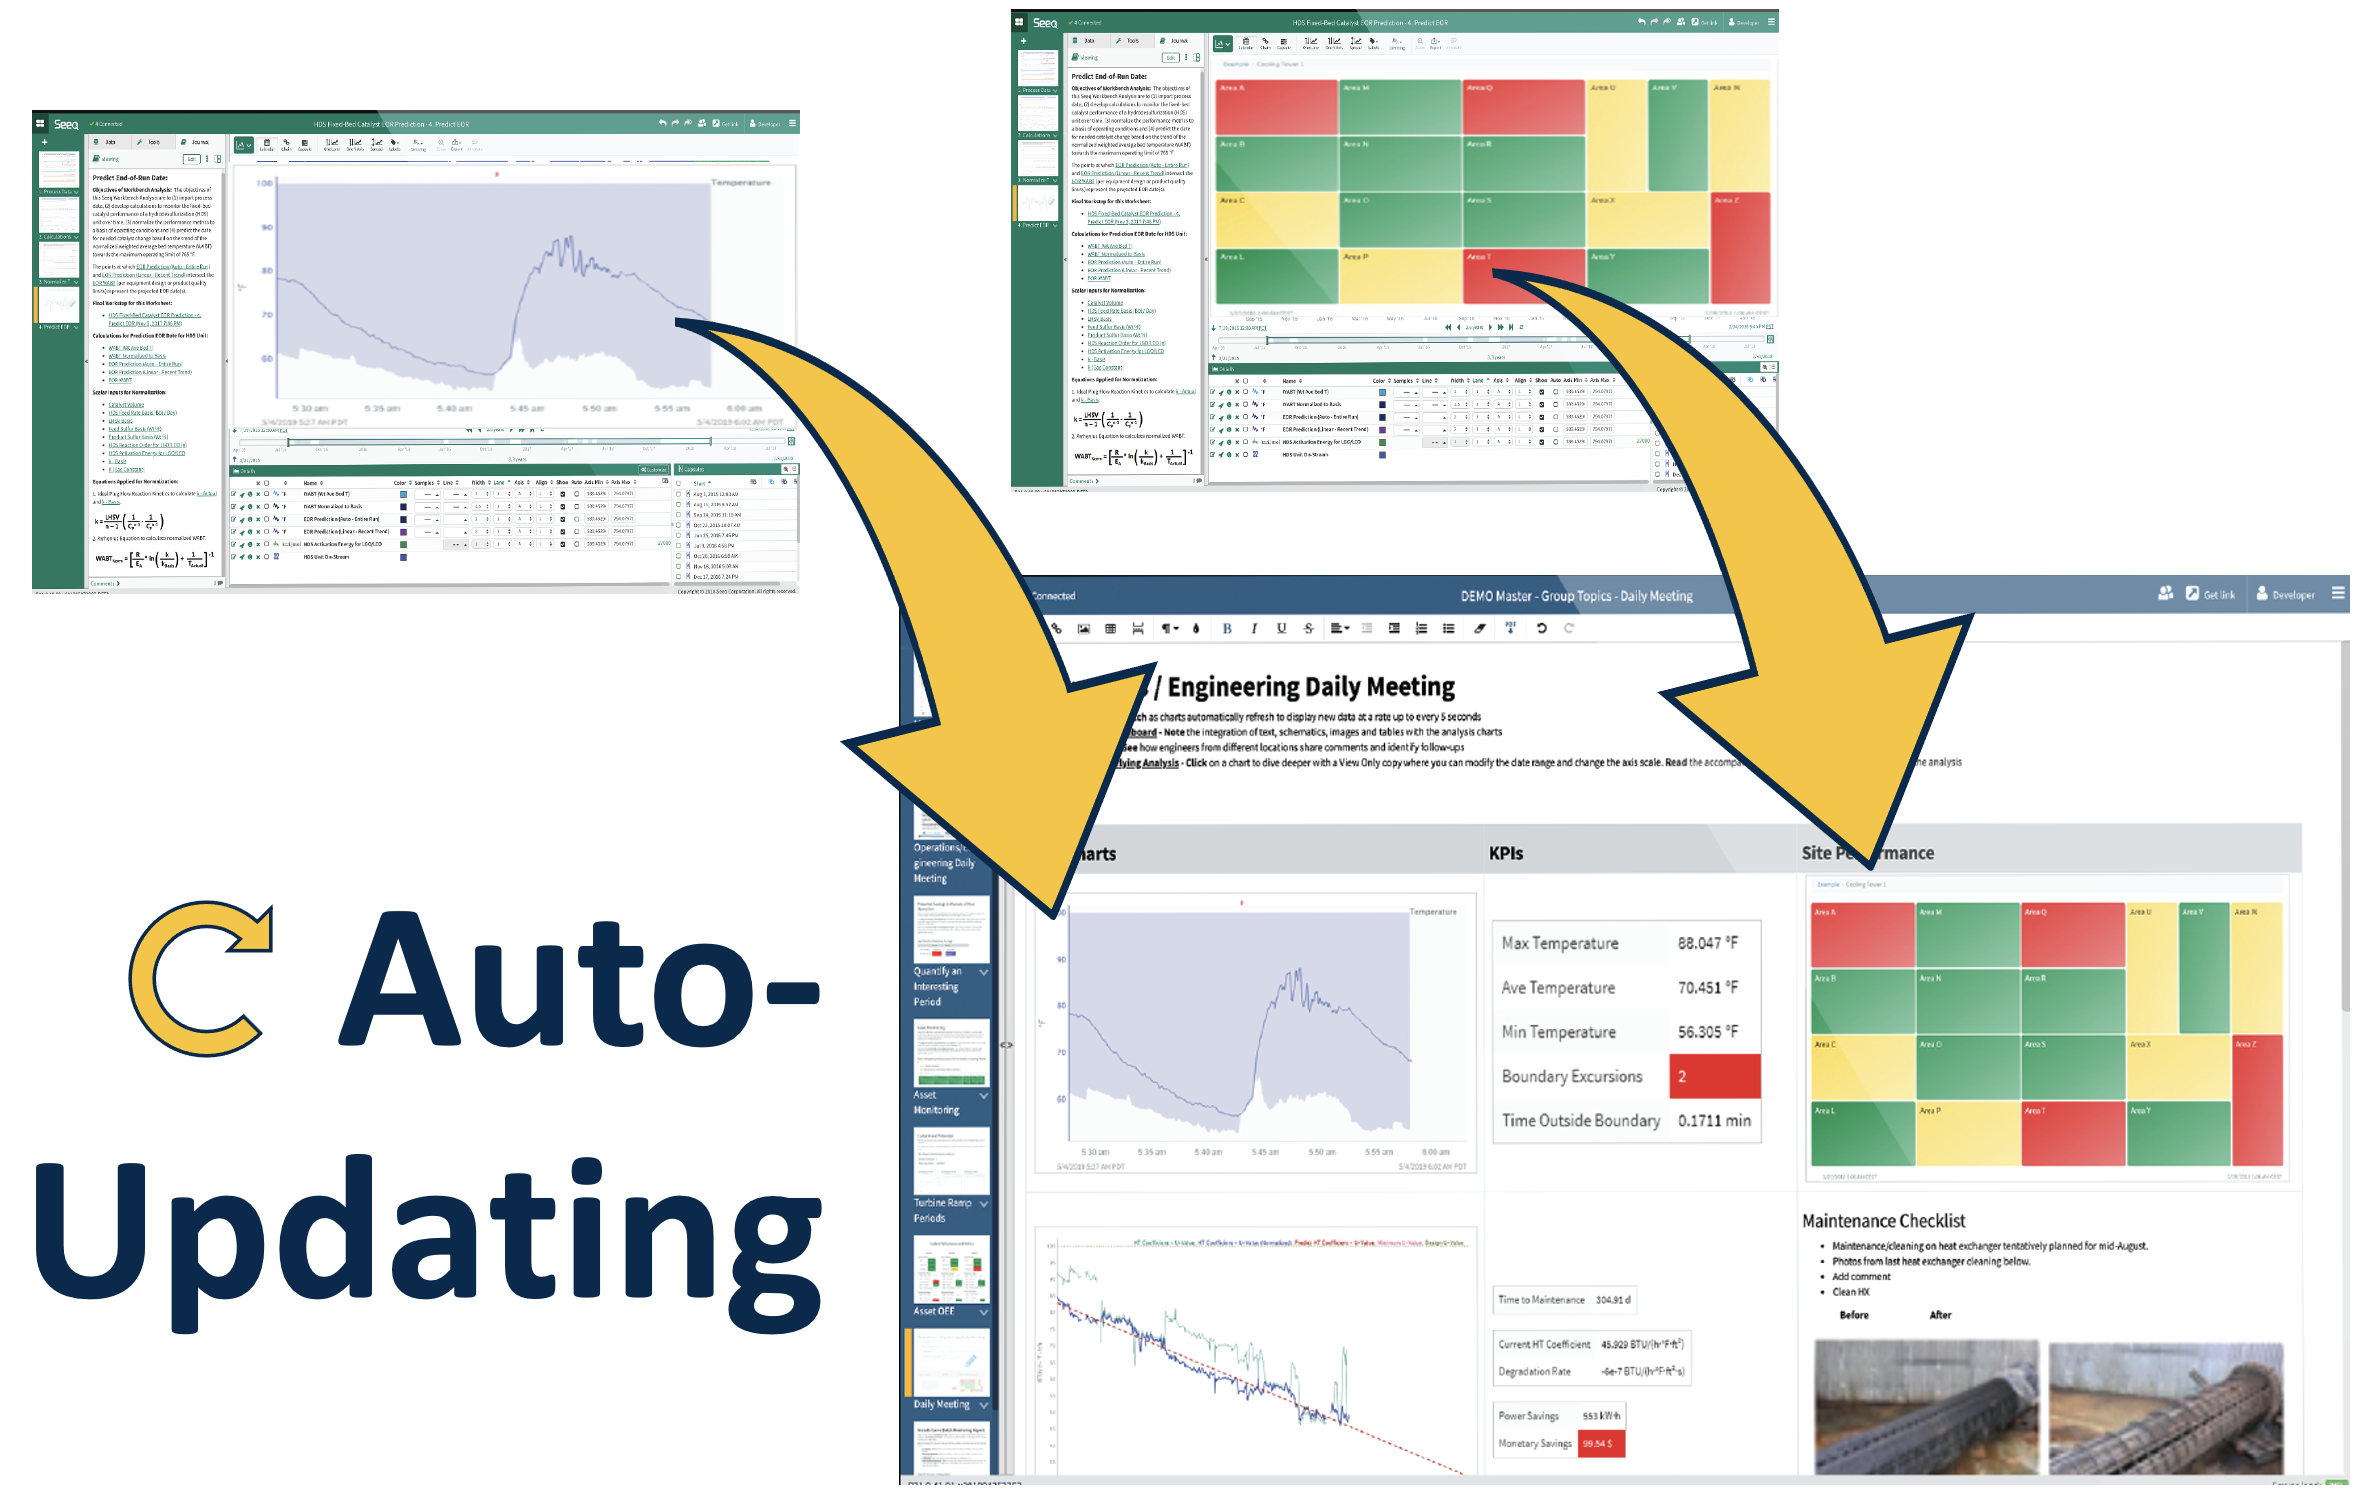
Compile analytics figures with other information into reports or dashboards. Then, set them to auto-update on-demand or on schedule as needed.
What’s Next?
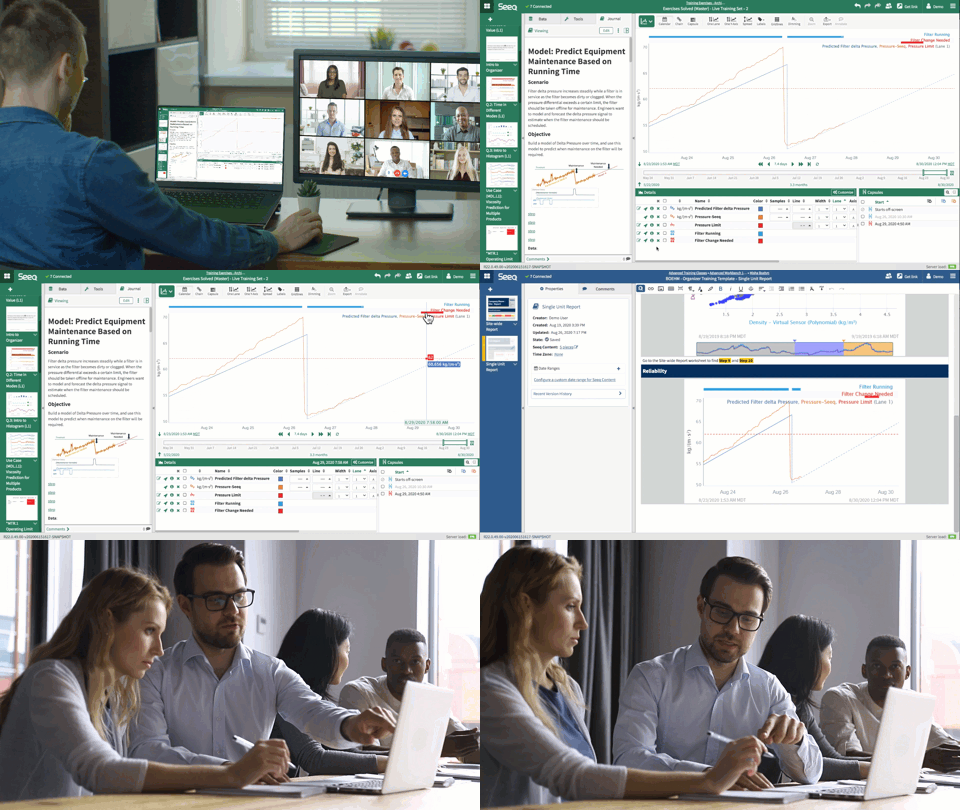
Hands-on Training
-
Quickly learn skills useful for your role
-
Hands-on, industry-relevant exercises
-
Certifications
How to Access Training
-
Get Branch Code* (from Seeq home screen or your admin)
-
Click “Register” on training.seeq.com
-
Choose your role
Browse resources on support.seeq.com
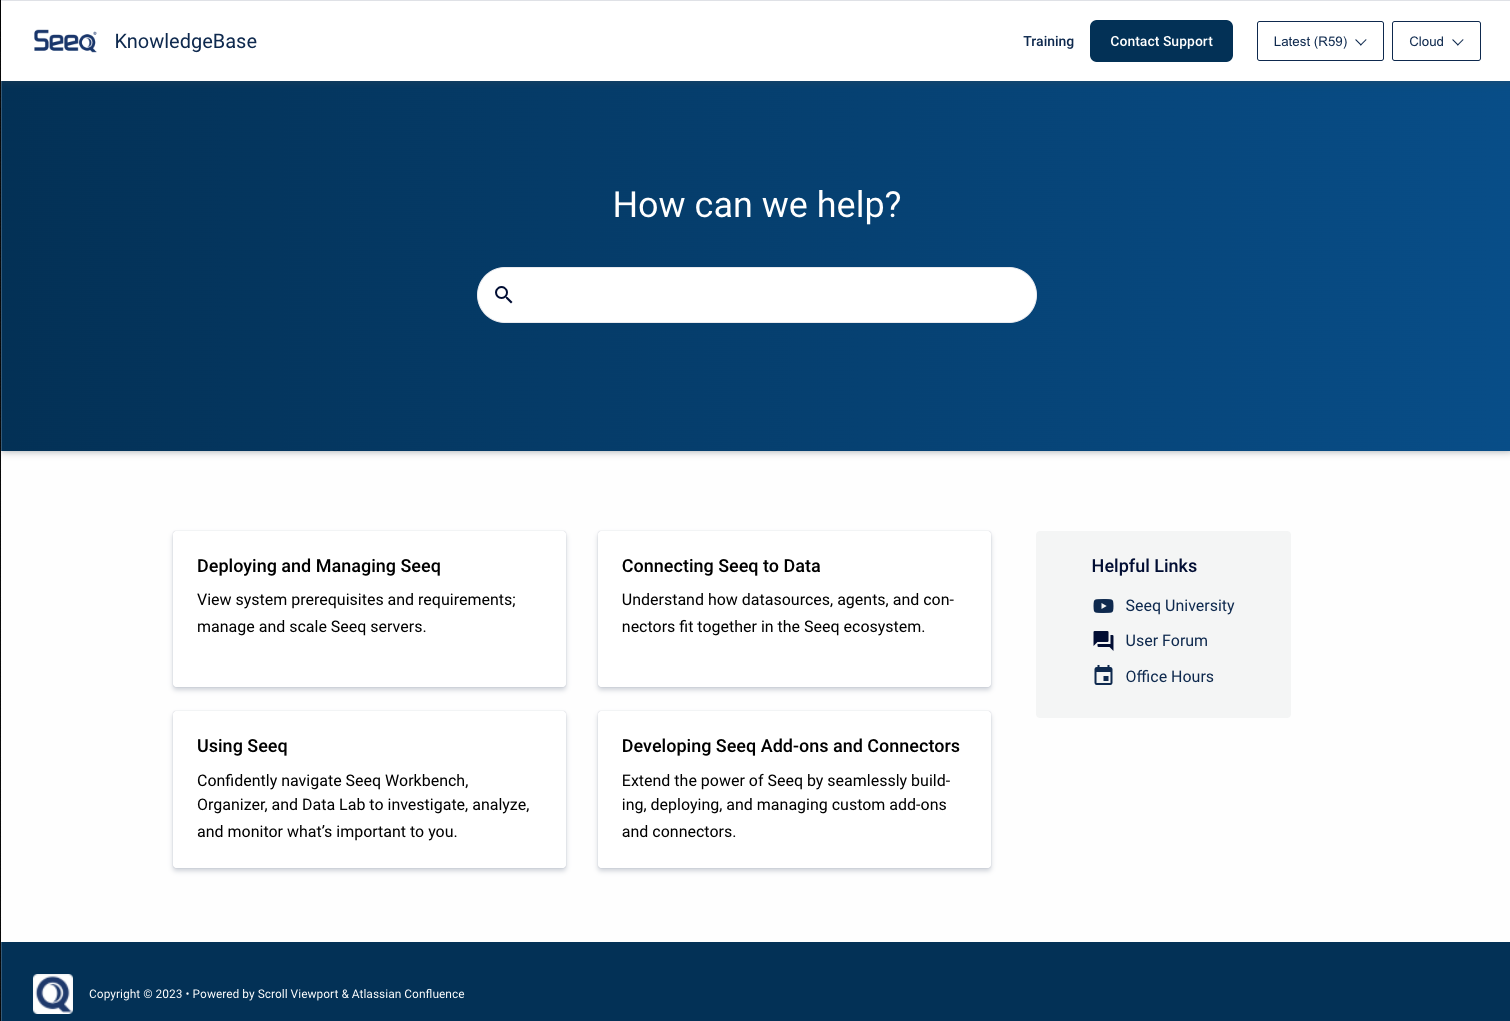
Knowledge Base, Videos, Forum, Office Hours, and more.
Also accessible through your Seeq Homescreen.