Export to Excel
Overview
Seeq has the option to export data shown on Seeq Workbench to an Excel file.
This article details the different parameters that will affect the data exported and how they can be changed.
Export Options
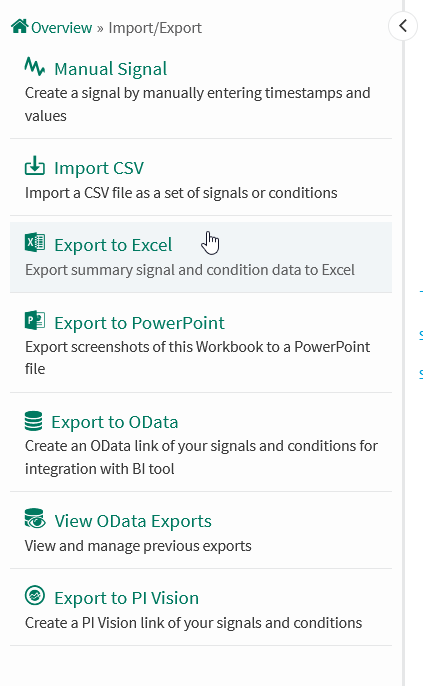
Export to Excel is located in the “Import/Export” list from the Tools tab of the Data panel.
Configuring the Excel Export
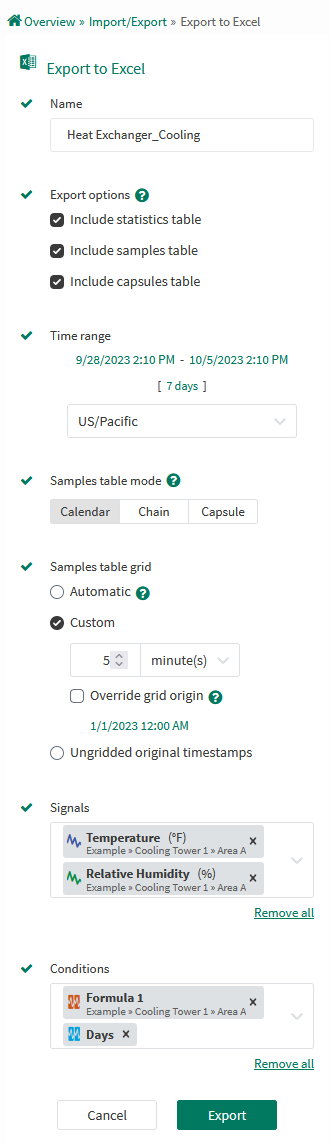
Name: Provide a relevant name that will be used in identifying the export. This will be set as the name and title of the Excel file.
Export options: Specify which sheets should be included in the file.
Statistics table: The stats for each signal and condition across the entire exported duration.
Samples table: Lists the signals' values at times specified by the Mode and Grid options.
Capsules table: The list of all capsules within the time range.
Time range: Specify the time range by adjusting the start, end and duration fields.
Time Zone: This is the time zone to be used to localize all times within the export. This setting defaults to that of the source worksheet. If the selected zone observes daylight savings time, ambiguities may occur at these events.
Samples table mode: The format to be used for the Samples sheet.
Calendar: Lists all signals' and conditions' values using real-world timestamps.
Chain: The same as Calendar mode, but filtered to only include timestamps where capsules are present.
Capsule: Lists signal values within each capsule. Timestamps are zero-based from the start of each capsule.
Sample table grid: The grid option determines the timestamps that will be reported in the sample table.
Automatic: Resamples the signals to a grid period based on the amount of time being exported.
For example, exporting 1 week of data will result in a grid period of 5 minutes. A 1 year export will use a 1 day grid period.Custom: Resamples the signals according to the grid period you set. For example, a grid period of 1 hour leads to values with timestamps separated by an hour.
Override Grid Origin: The specific date and time to orient the grid period. For example, this allows a weekly grid to be calculated every Monday at 9:00 AM rather than the default of Sunday at midnight.
Ungridded original timestamps: Each signal’s original samples will be output.
Signals: Modify the list to only include the signals desired in the export.
Conditions: Modify the list to only include the conditions desired in the export.
The Exported File
Information Sheet
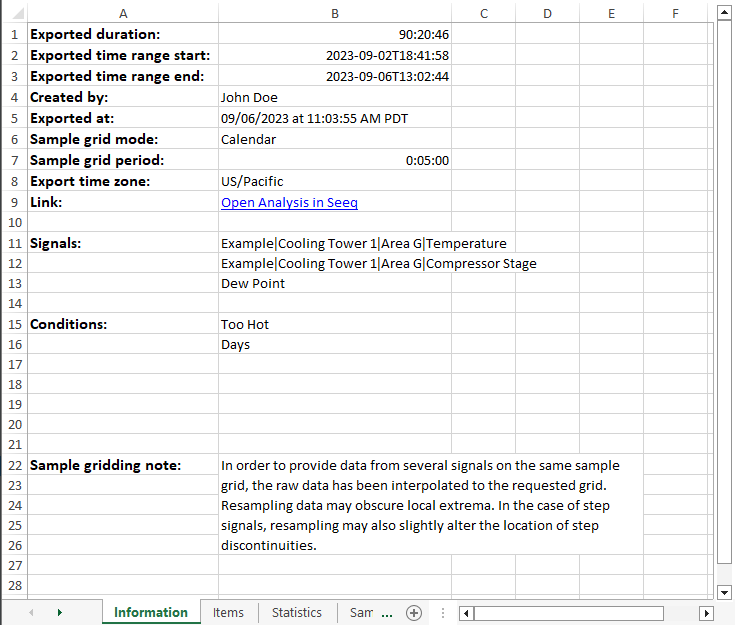
The Information sheet details the meta information about the export. It includes which configuration options were used to generate this file; who, when, and where the export came from; and a list of the items being output.
Error Reporting
Several rows of the Information sheet are reserved to report if errors were encountered while creating the file.
Using the current start and end time, the Samples/Capsules sheet would contain more rows than Excel allows...
Excel can only display approximately one million rows. If the Samples or Capsules sheet would result in more rows than a valid XLSX file supports, the data will be cropped to prevent such errors. Try creating a new export with a smaller time range, a larger resample period, or fewer items to prevent this error.At least one item had warnings or errors while retrieving data...
A runtime error or warning occurred while fetching data. Common errors can include disconnected datasources or invalid calculations. Warnings are often smaller issues such as maximum interpolation gaps or large query expansions. The specific errors and warnings will be listed in the Warning column of the Items sheet.At least one data sheet could not be generated...
No data was able to be output to the Samples or Capsules table at all. All items resulted in an error or had an empty data result. Check the Items sheet for specific errors and warnings.At least one signal cannot be gridded because it has Discrete interpolation...
Discrete signals are incompatible with resampling. Choose “Ungridded original timestamps“ or use the$signal.setMaxInterpolation(...)formula to output such signal data.
Items Sheet
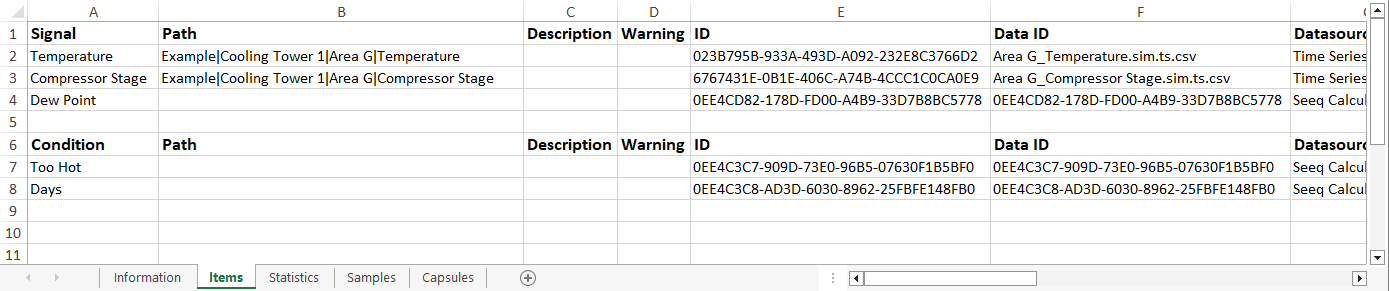
The Items sheet lists all items included in the export. Signals are listed first, followed by Conditions, and any unsupported or unreadable items last.
Signals and Conditions list their name, asset path, description, any runtime errors and warnings that were encountered, and their Seeq ID, followed by all other item metadata properties in alphabetical order (minus specific properties that are unlikely to be useful such as UI Config).
The error items list their name as reported by the UI, the Seeq ID, the type, and the error that was encountered.
Statistics Sheet
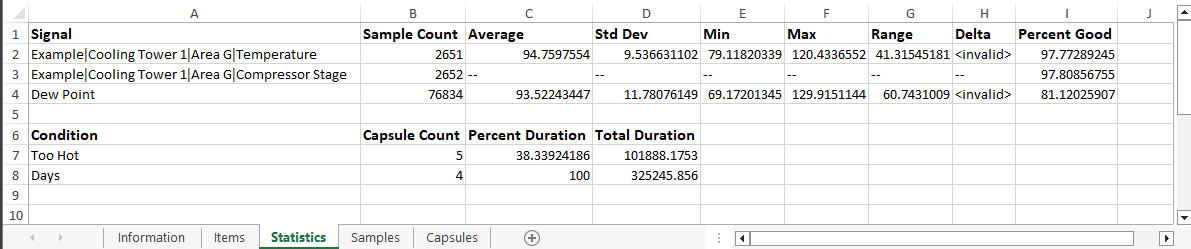
The Statistics sheet gives the general stats of the signals and conditions within the exported time range.
Signal statistics include the sample count, average (time-weighted), standard deviation (time-weighted), minimum (before resampling), maximum (before resampling), range (max - min), delta (end value - start value), and the percent of samples that had valid data.
Capsule statistics include the capsule count, the percent of time where capsules were present, and the total duration of all capsules within the time range (in seconds).
Samples Sheet
The Samples sheet reports the value of each signal (and condition) at different timestamps. The grid period options determine the timestamps that will be output.
Calendar and Chain mode
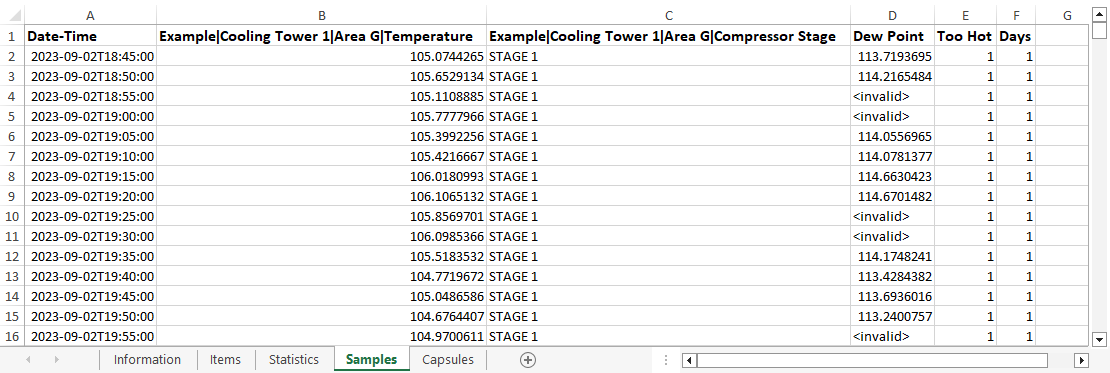
These modes output the signals' value at each real-world timestamp. Conditions are represented as signal-like data using the $condition.countOverlaps() formula function.
Calendar mode lists all timestamps within the exported interval. Chain mode filters out times where no capsules are present.
Capsule mode
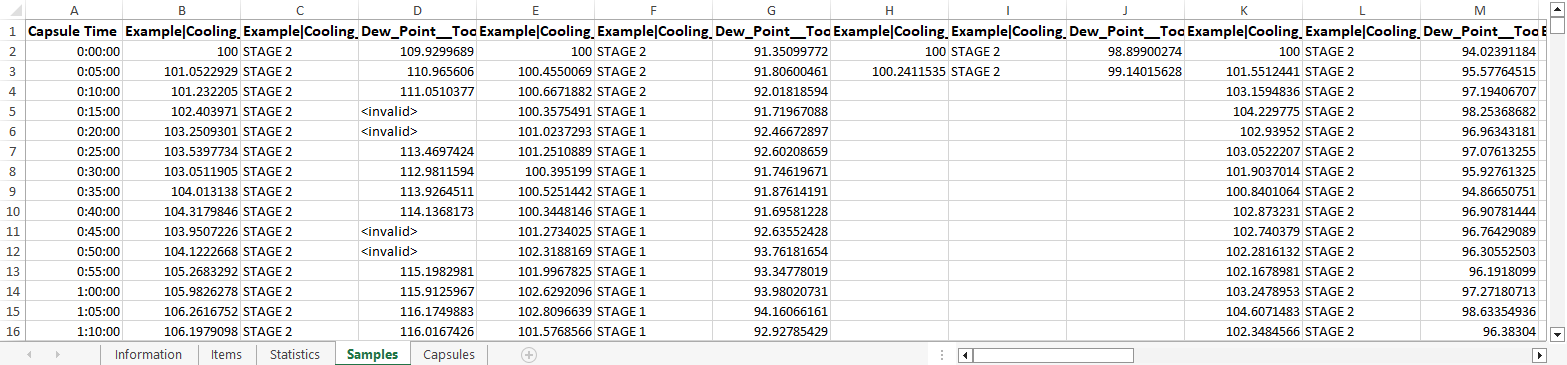
Capsule mode outputs a column for each signal + capsule pair. The signal segments are gridded from the start key of each capsule.
Signal interpolation note
Since samples do not always occur at a select timestamp, Seeq interpolates to determine what would be the value of the signal at this point if it had a sample. Please refer to Interpolation to learn more about the options Seeq has for editing interpolation.
When looking to export to Excel in Seeq, take note of how the data is being brought from your historian and made into a Seeq signal. The formula tool can be used to make changes to the format of the signal without changing the value of the samples. Once the interpolation and sampling rate are known, your grid period can be changed to export the data to Excel at the rate you want. If the selected zone observes daylight savings time, ambiguities may occur at these events. The time zone can be found in the Information tab of the Excel export in the line that contains "This file was created".
Capsules Sheet
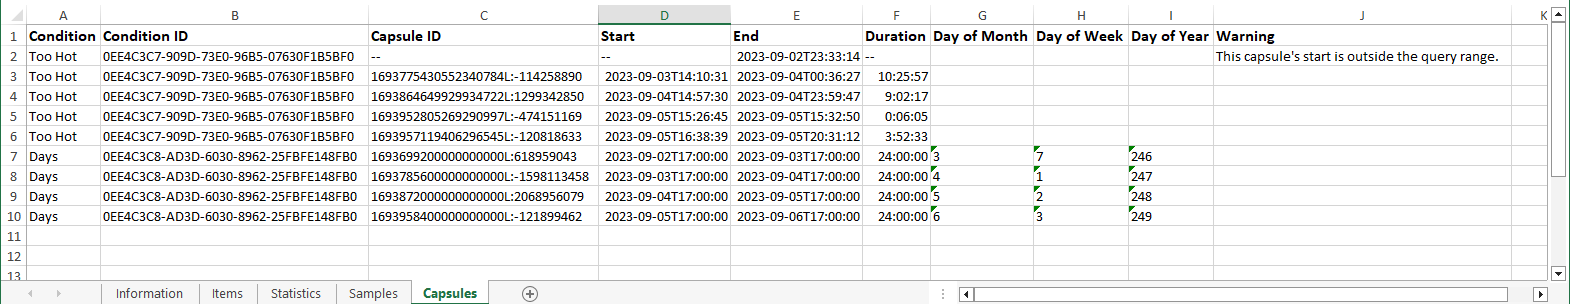
The Capsules sheet lists all capsules within the exported time range. The start, end, and duration are listed for all capsules (when available) followed by the capsule properties in alphabetical order.
Remember that only capsule properties set via .setProperty('Property Name', ...) in Formula will be exported to the Capsules Sheet. Statistics or properties established in the Capsules Pane in the Worksheet will not be included in the Export.
Set Capsule Statistics using Formula and they will be included in the Export. For example:
days() // Create a daily condition
.setProperty('Average', $signal, average()) // Set the Average of $signal as a property
.setProperty('Shift', 'A') // Set the property 'Shift' to 'A'
Alternatively, if you’re only interested in the capsule properties you can utilize Table View in a “Condition Table” and add columns for statistic you'd like to see. The table can be copied and pasted directly into Excel.