Histogram
Histogram enables users to aggregate a signal within conditions, over periods of time, or with respect to another signal. This tool can be used to identify statistical distributions, pivot one signal off of another, or summarize a signal in specific periods of interest. These periods of interest can be with respect to time, signal values or capsule properties.
Using the Histogram Tool
Select the signal you wish to aggregate: From the dropdown menu select a signal from the details pane, pinned items or recently accessed sections.
Select the statistic you would like to use: From the dropdown menu select a statistic to apply to the aggregated signal.
Select aggregation type: Selecting the radio button for Value, Condition, or Time. This will change the subsequent options as represented by each bullet below.
- Value: Select value to aggregate one signal with respect to itself or another signal.
- Select the signal you want to use to define bins: From the dropdown menu select a time-series from the details pane, pinned items or recently accessed sections. This time series will be used to generating the x-axis of the histogram
- Select how the bins will be determined: Select a radio button for Size of bin or Number of bins to define the granularity of the histogram. Min and Max will autopopulate, but are editable if desired.
- Size of Bin: Enter a number that will represent the range of each column of the histogram. This could be a decimal or an integer. The number of columns will be calculated based on size of bin, min and max.
- Number of Bins: Enter an integer for the total number of columns to be displayed in the histogram. The range of each column will be calculated based on number of bins, min, and max.
- Min: Is autopopulated based on data in display range. Edit as desired.
- Max: Is autopopulated based on data in display range. Edit as desired.
- Select how the bins will be determined: Select a radio button for Size of bin or Number of bins to define the granularity of the histogram. Min and Max will autopopulate, but are editable if desired.
- Select the signal you want to use to define bins: From the dropdown menu select a time-series from the details pane, pinned items or recently accessed sections. This time series will be used to generating the x-axis of the histogram
- Condition: Select condition to aggregate the signal within a condition created. This is most useful for conditions that have properties associated with them.
- Select a condition: From the dropdown menu select a condition from the details pane, pinned items or recently accessed sections.
- Select property: From the dropdown menu select Capsule Series Origin or another named property. Capsule Series Origin will return only one column. Selecting a property will return a column for each property of that condition that exists. This may be helpful if product types, procedures or operator information has been added to a condition as a property, to name a few examples.
- Time: Select a radio button from the list to aggregate the selected signal within specific periods of time.
- Hour of Day will generate a bin for each hour in the day 1 to 24. Each bin will represent an aggregation of the selected signal within a specific hour in a day. For example, if more than one day is present, all data from 5 AM to 6 AM in all days will be aggregated into a single bin.
- Day of the Week will generate a bin for each named for a day of the week. This will aggregate the signal in the display range to the day of the week in which it occurred. For example, if more than one week is in the display range, data from all Mondays in the display range will be aggregated in a single bin.
- Day of Month will generate a bin for each named for a day of the month 1 to 31. This will aggregate the signal in the display range to the day of the month in which it occurred.
- Day of Year will generate a bin for each day of the year 1 to 365/366. Each day in the year is counted with January 1 = 1. Note that when comparing a leap year with non leap years, subsequent days are relative to the first day of the year and not necessarily the same date as the previous year.
- Week of Year will generate a bin for each week of the year 1 to 52. Each week is incremented from the Monday before January 1st, or on January 1st if its a Monday.
- Month of Year will generate a bin for each month of the year January - December. Note that if the display range spans the same month over multiple years (Jan 2017 & Jan 2017) they will be combined into a single bin.
- Quarter of Year will generate for each quarter of the year Q1-Q4.
- Year will generate a bin for each year in the display range.
Add Grouping: There may be times where more than one grouping is desired. A second grouping generates a series of columns within each of the primary bins. Select the plus sign next to Add grouping to further bin the data. Each of the above (Value, Condition, Time) also apply to a second grouping.
Examples of Histograms in Seeq
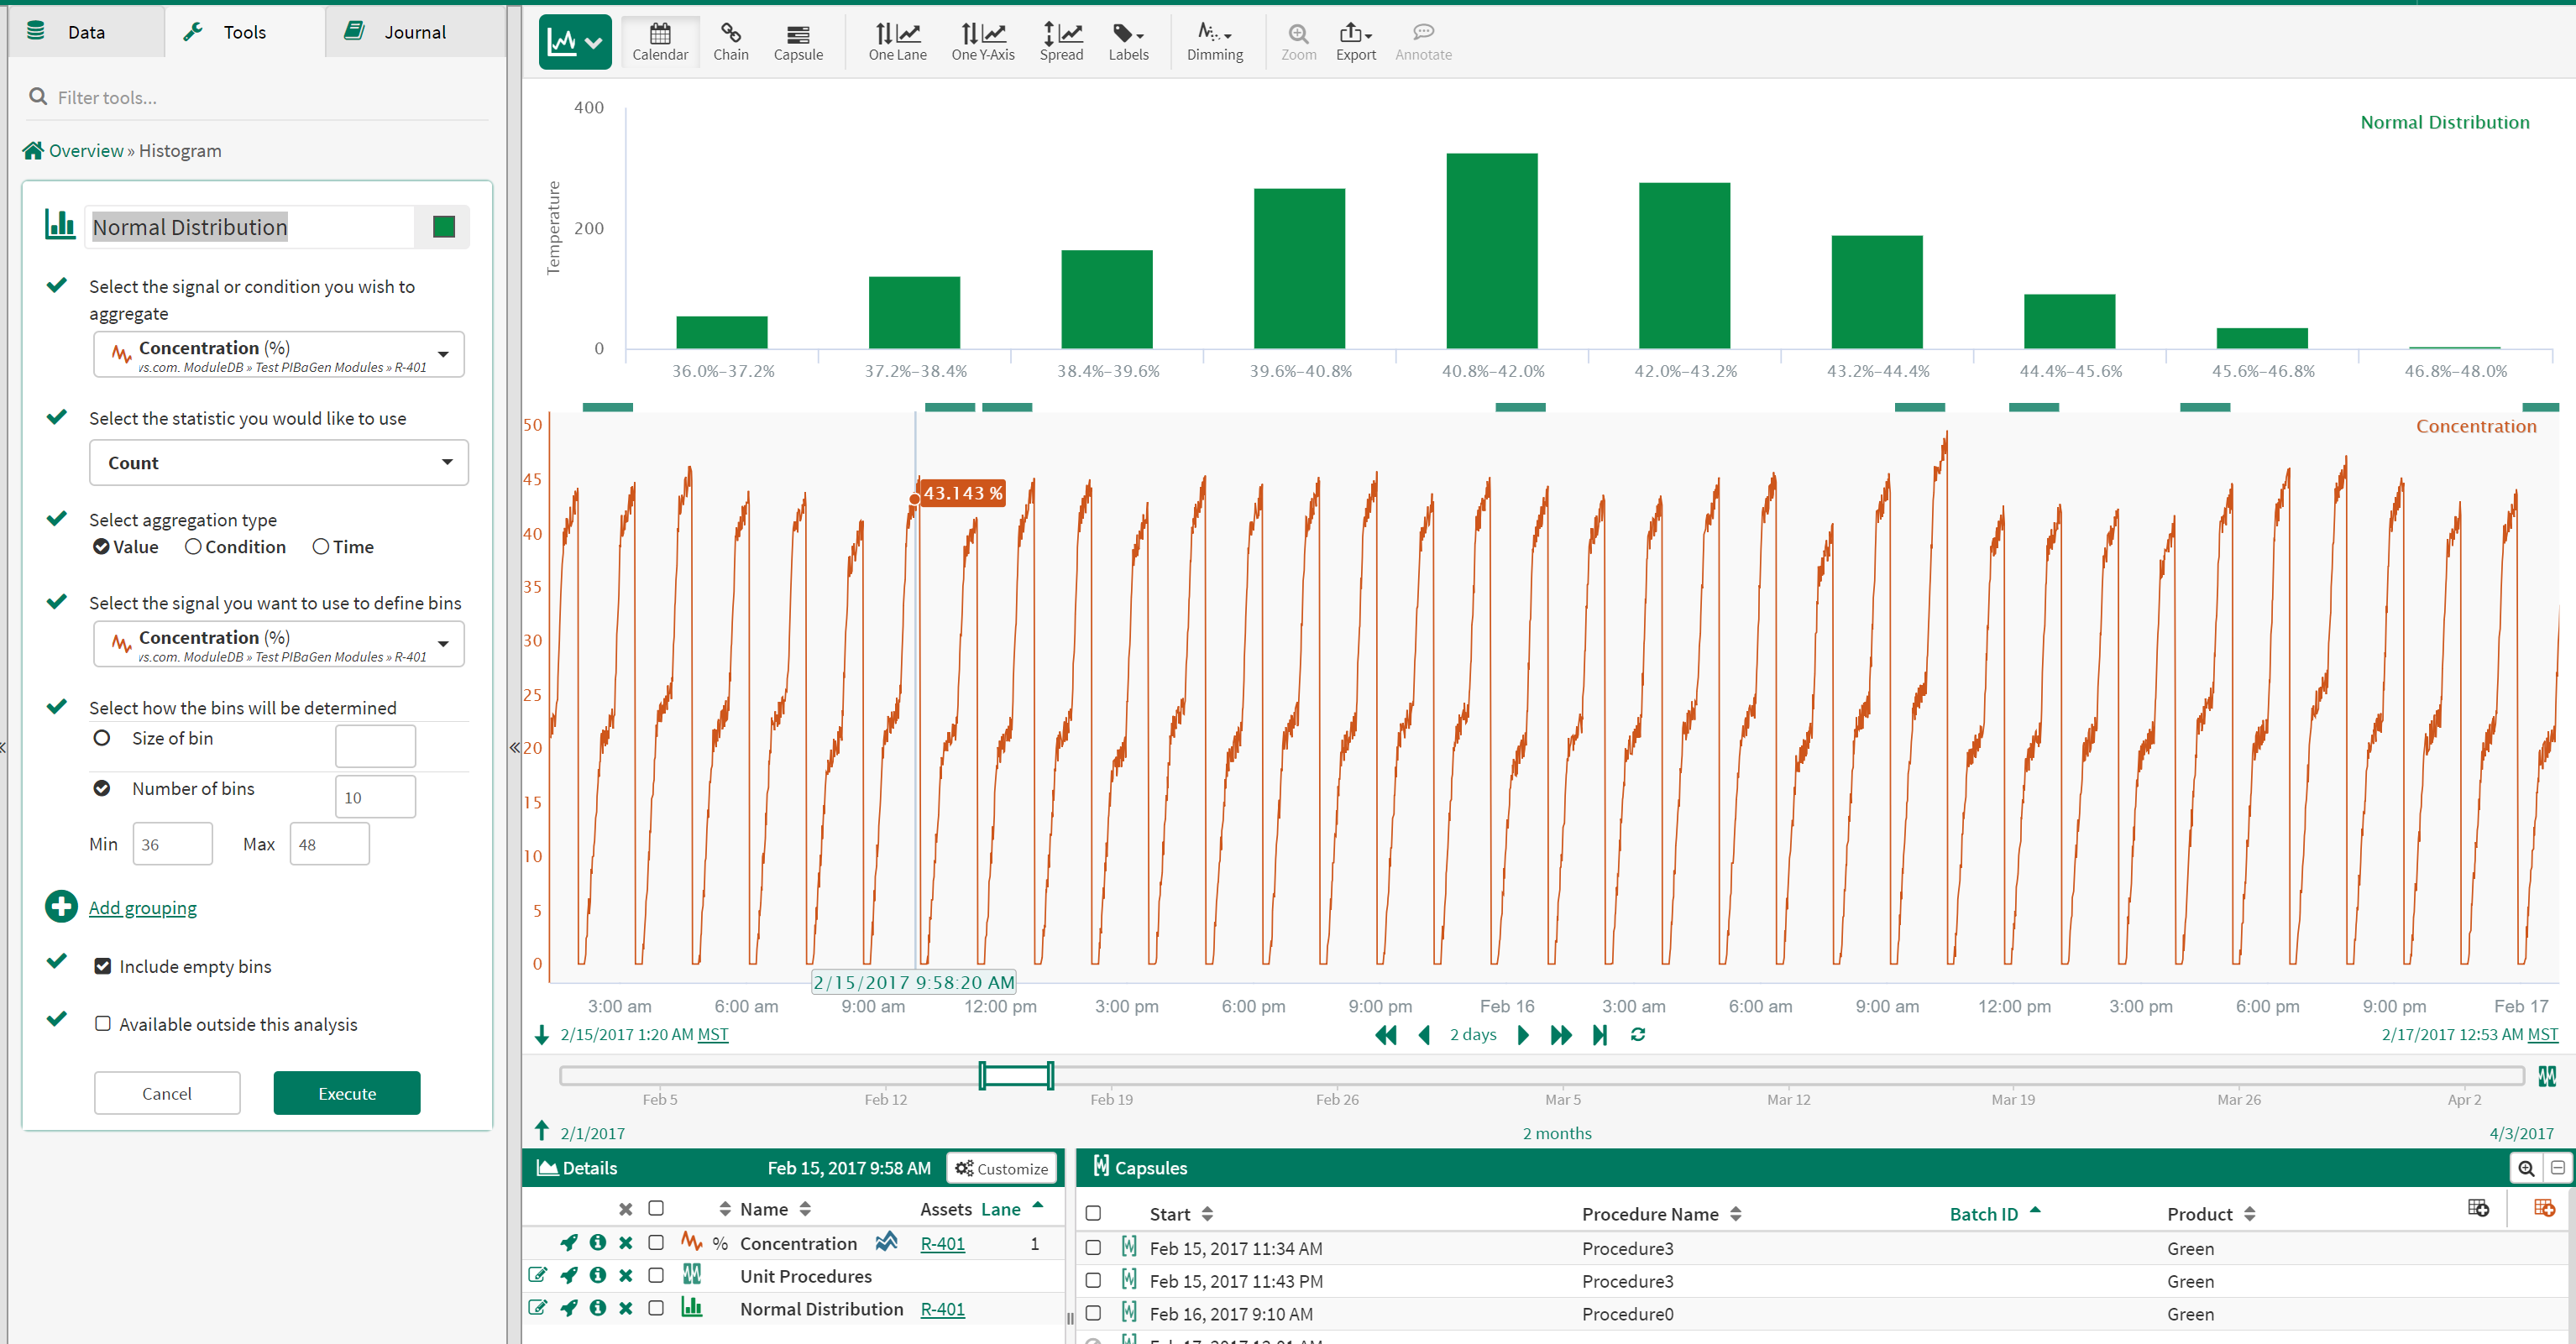
Histogram for Statistical Distribution
To create a histogram of the data for identifying statistical distribution, aggregate by value and select the same signal for aggregating and defining bins. Select the "count" statistic. This will let you see if your distribution is normal, bimodal, skewed, or other. Below is an example of a histogram from data that is close to normally distributed.
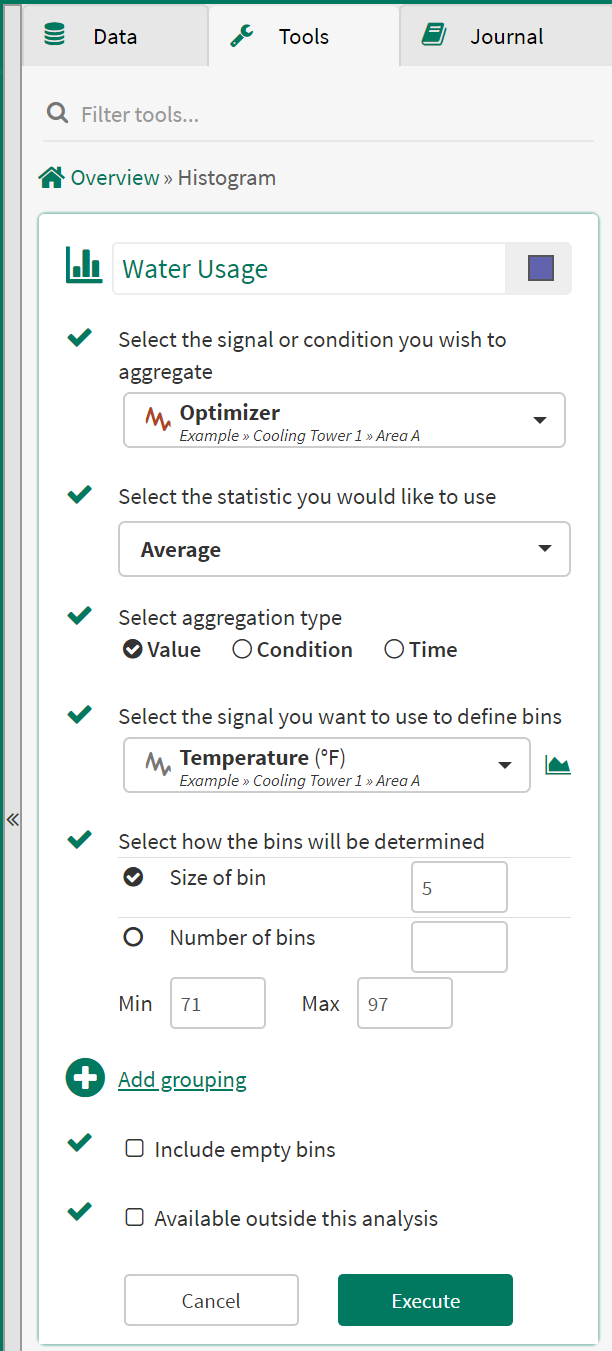
Aggregating by Value
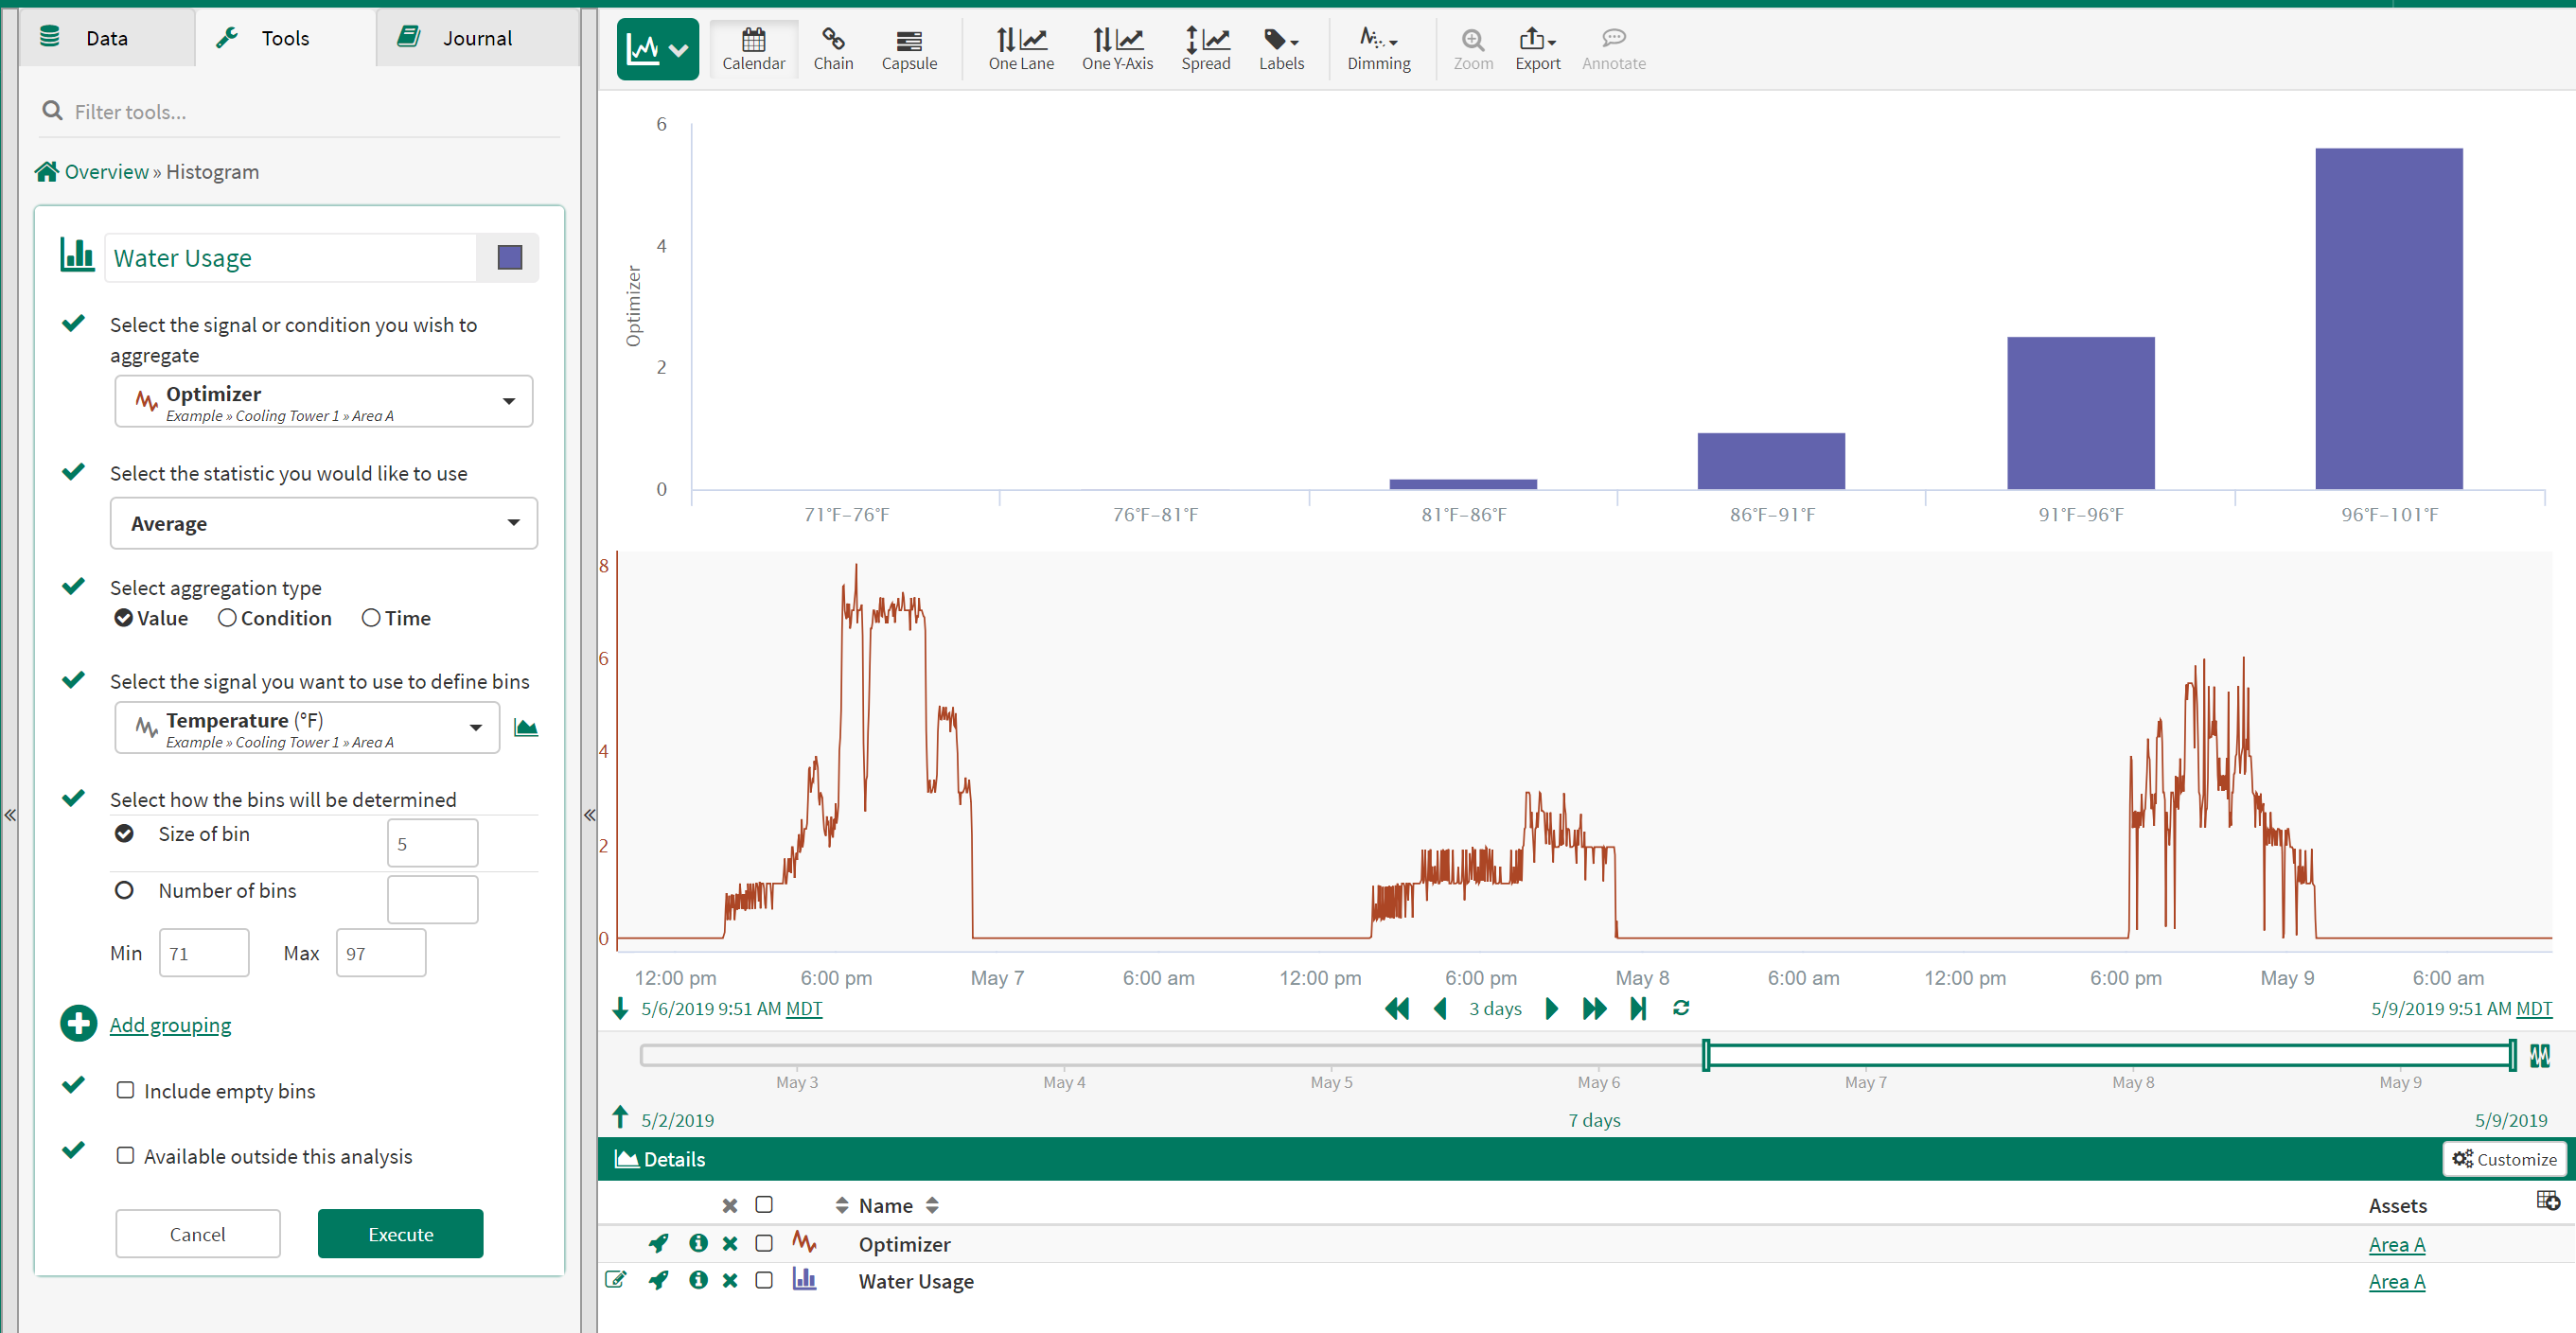
The histogram below represents the average water flow (Optimizer) within 5 degree temperature bins. More water is used in higher temperature ranges in the 1 day viewed in the display range.
Aggregating by Condition
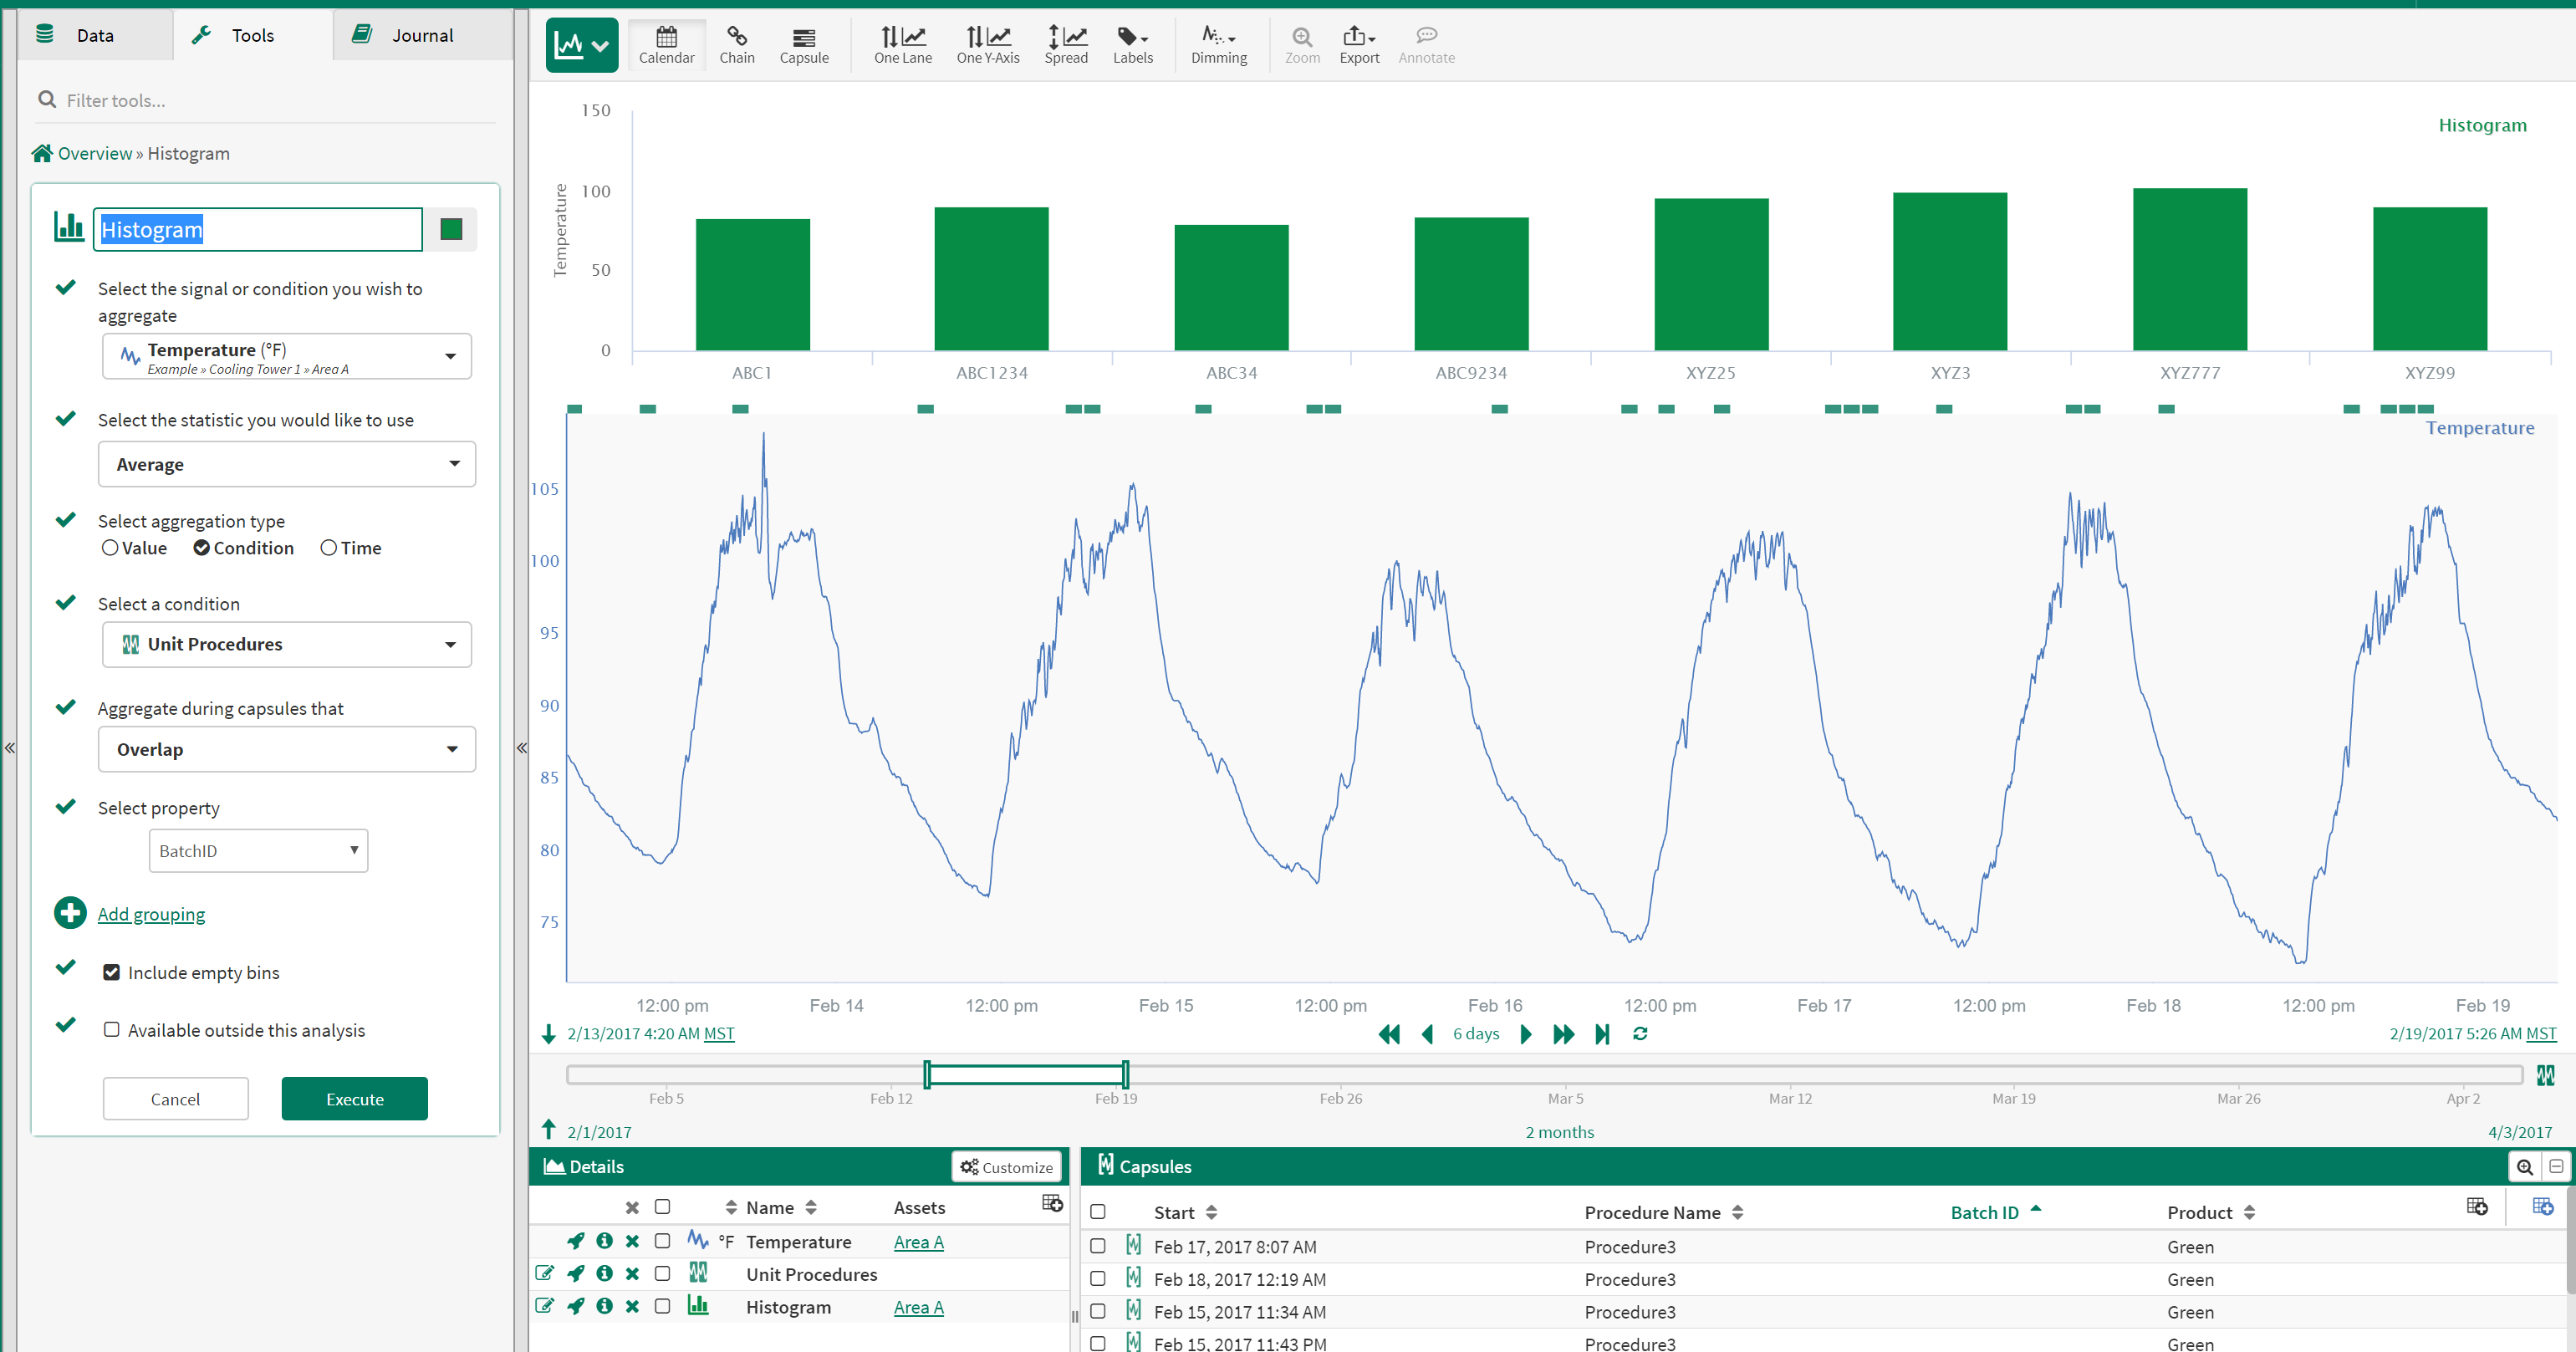
If properties have been assigned to conditions, these properties can be another way to aggregate data within the histogram tool. The below histogram represents average temperature for each BatchID identified within identified Unit Procedure conditions.
Aggregating by Time
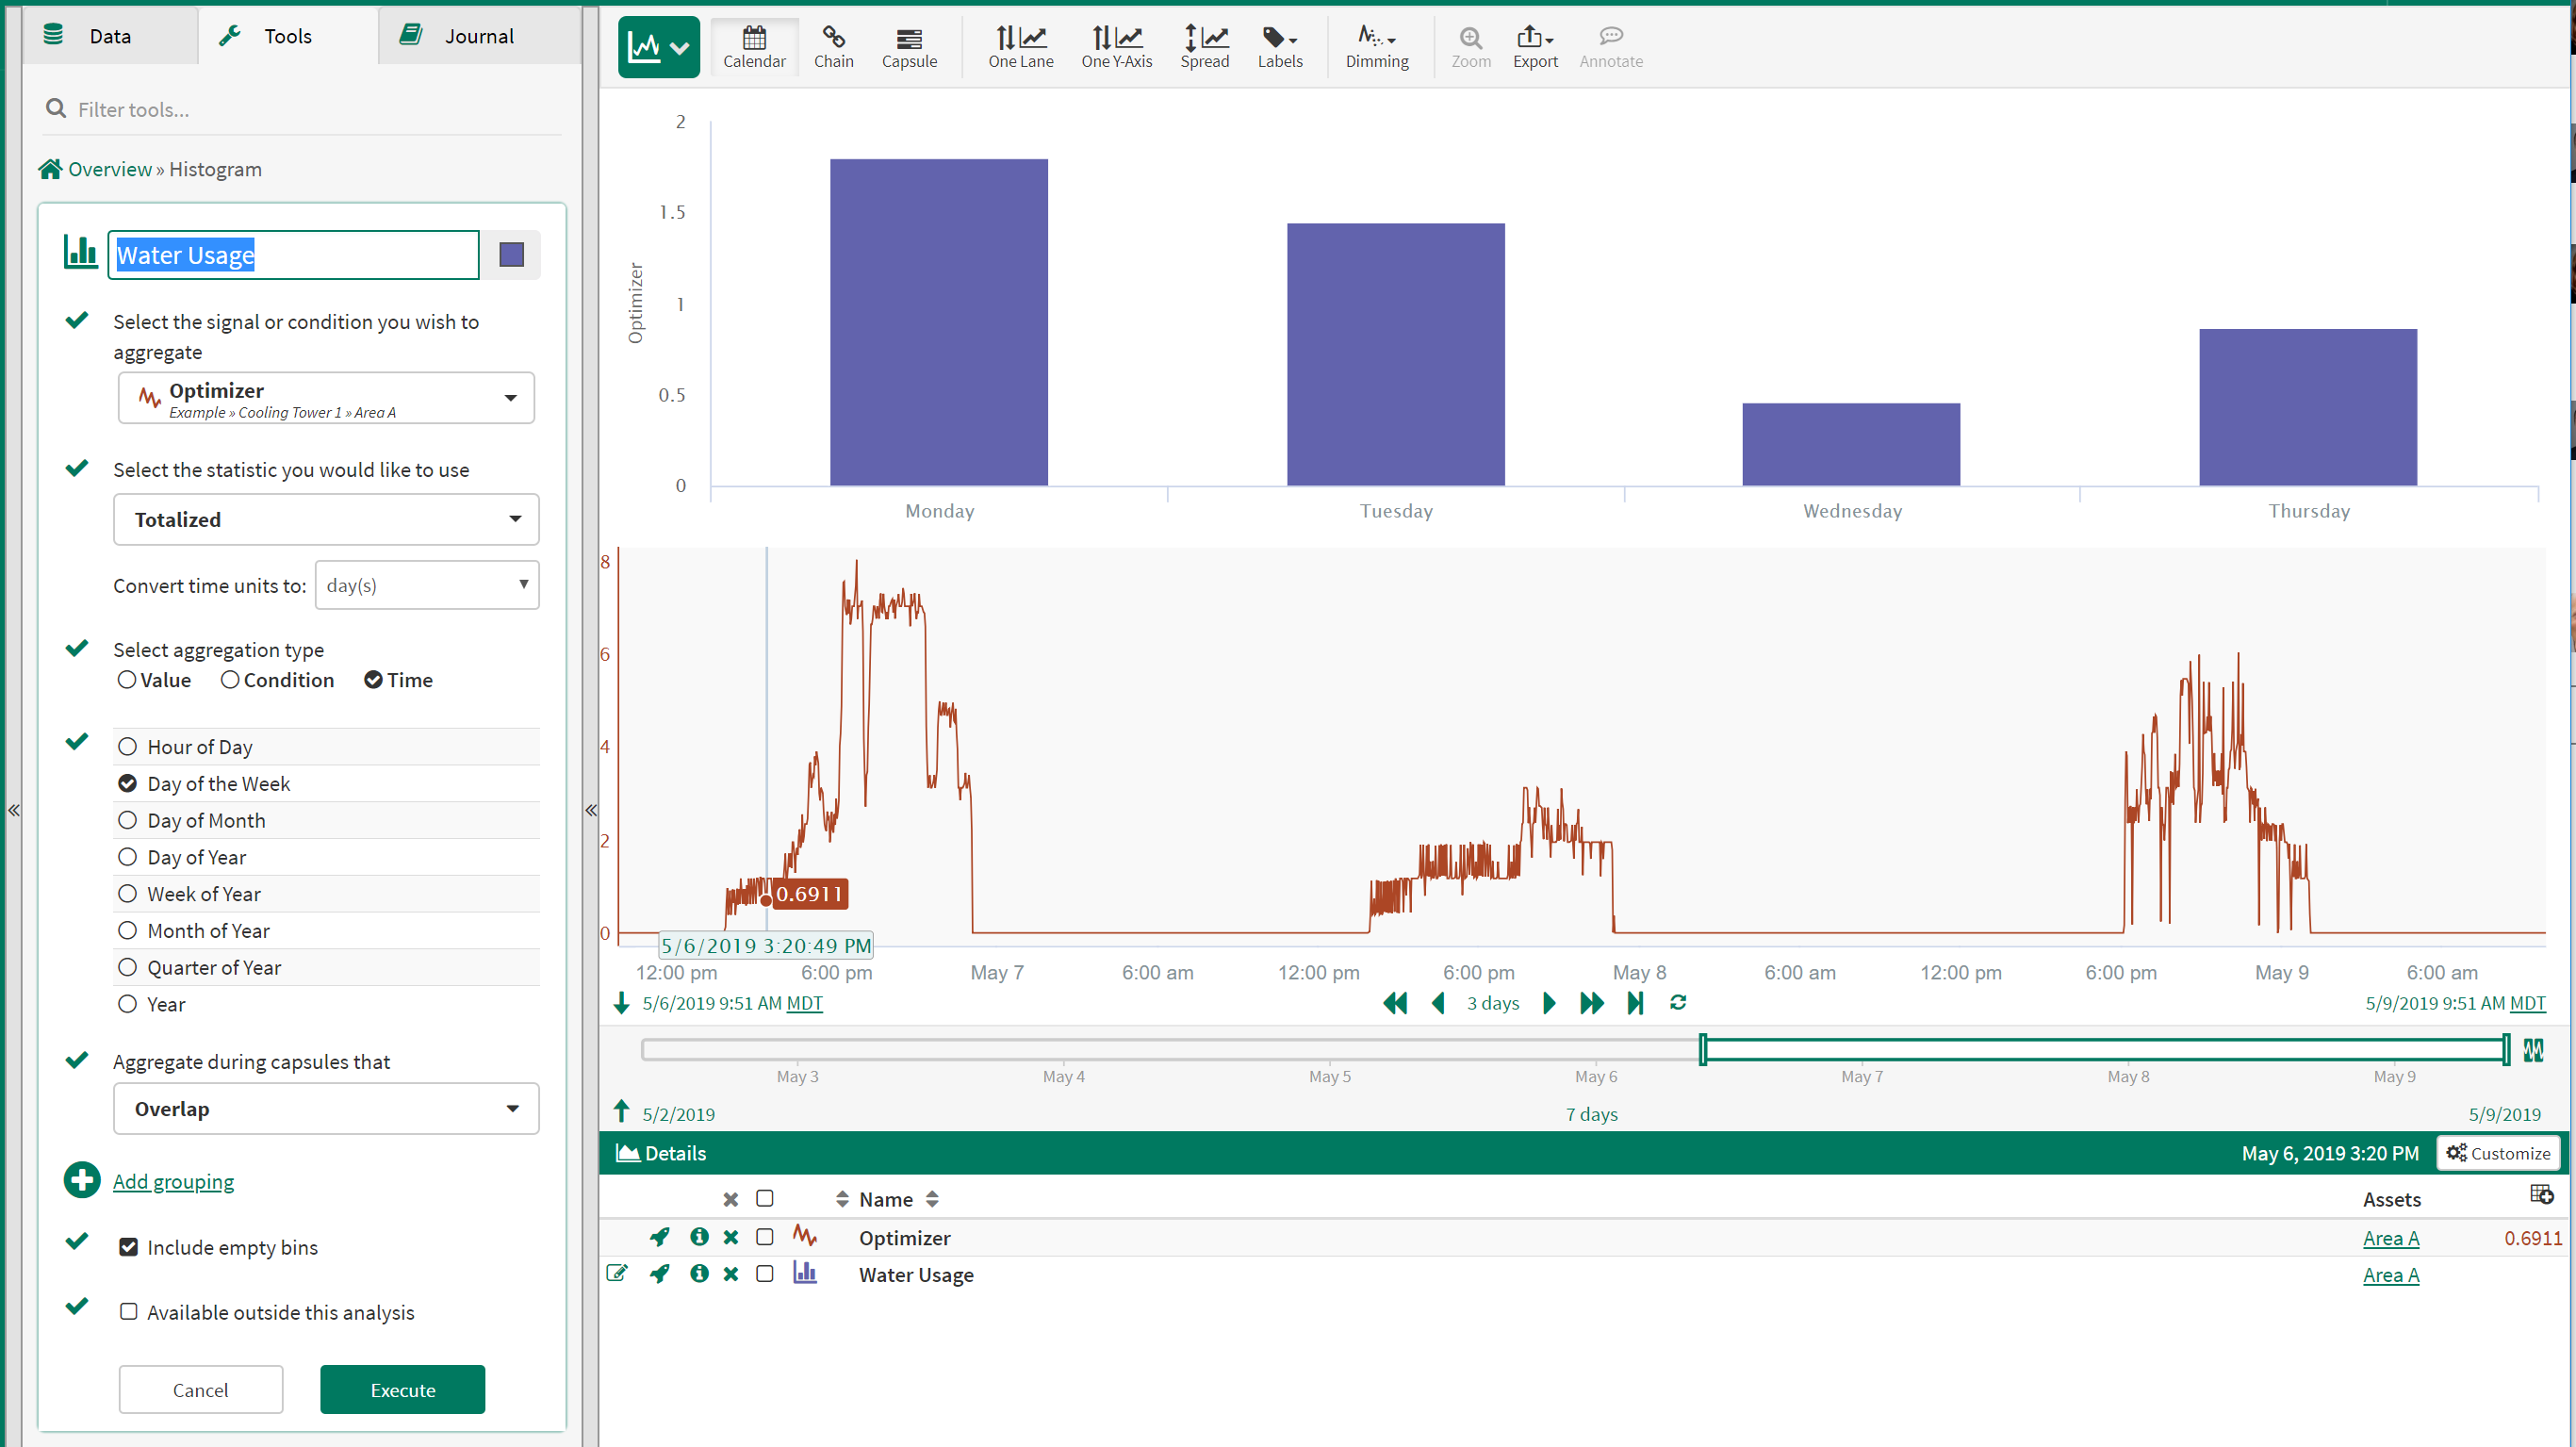
The below histogram is using the totalize statistic to calculate the volume of water used each day in the 4 day period. Note 5 columns exist because the 4 days included part of Monday and part of Friday.
Add Grouping
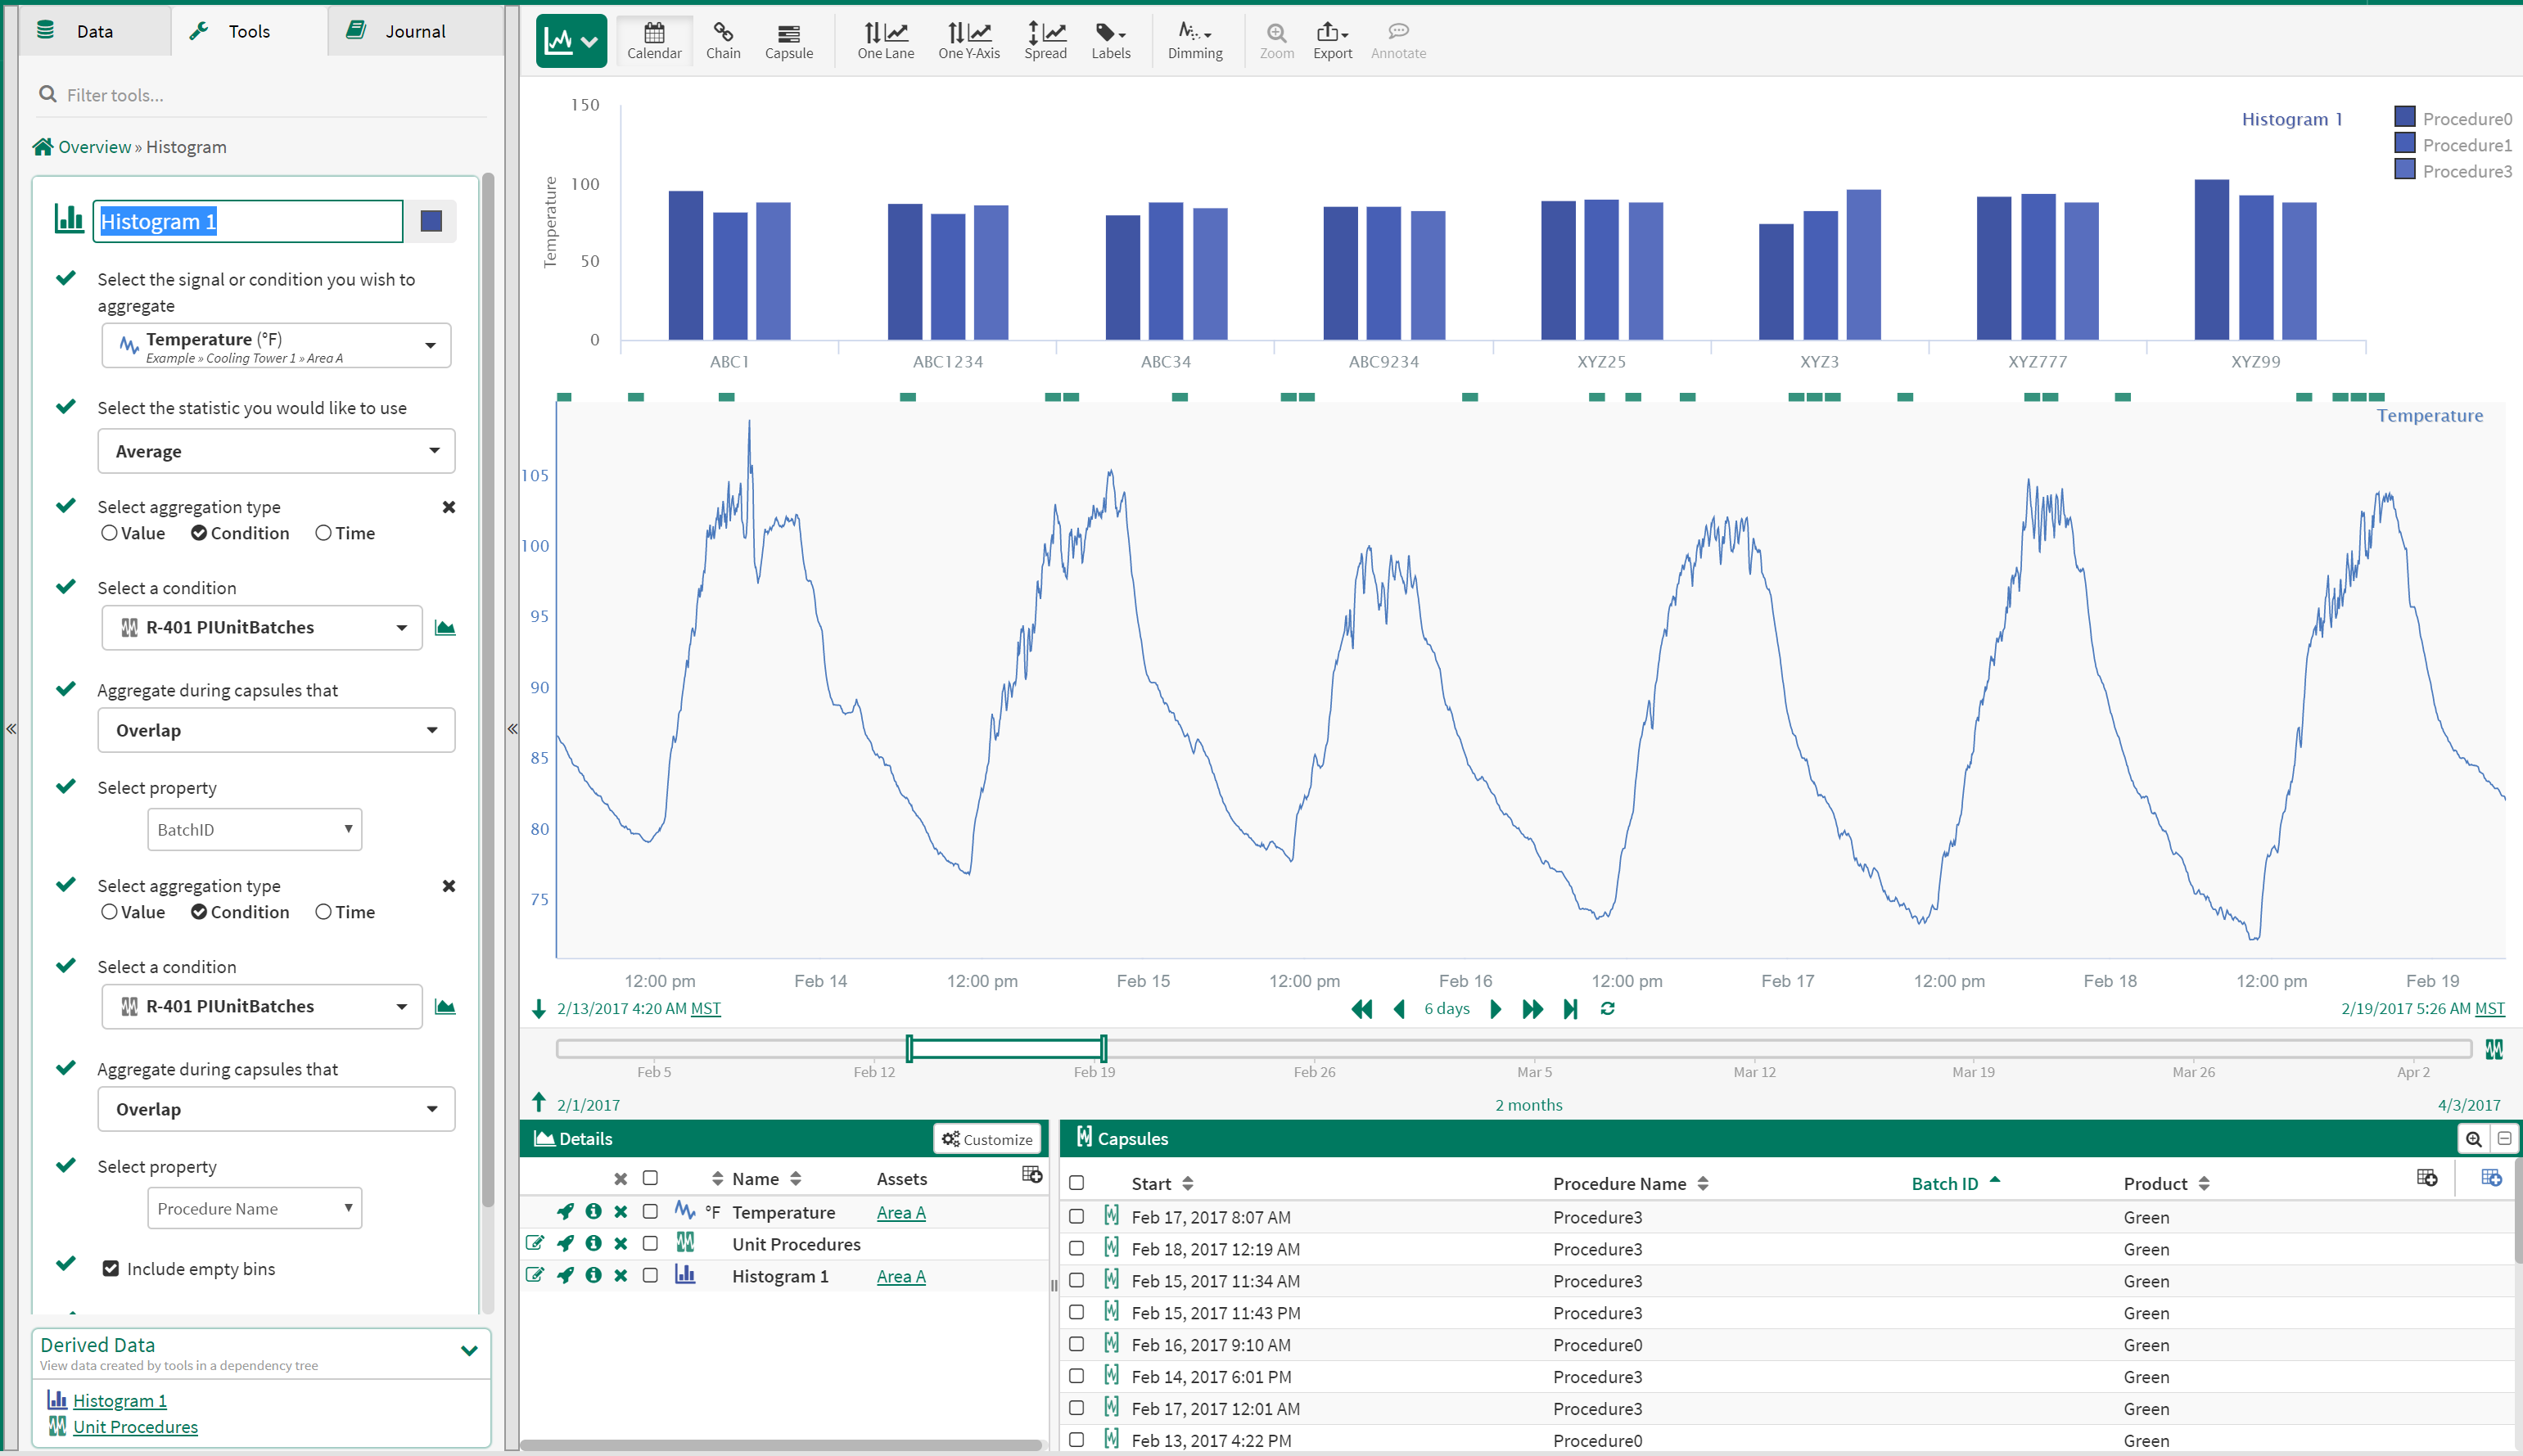
One example of using two bins when aggregating by condition is below. Average temperatures are broken out first by BatchID (x-axis), and then by Procedure Name (up to two columns for each BatchID, each representing average temperature within the procedure).
Another example of adding a grouping may be to quantify change over a period of time. The below example takes the aggregation by value example and aggregates again by time to see average water usage within 5 degree temperature ranges over the last 3 quarters.
Customizations:
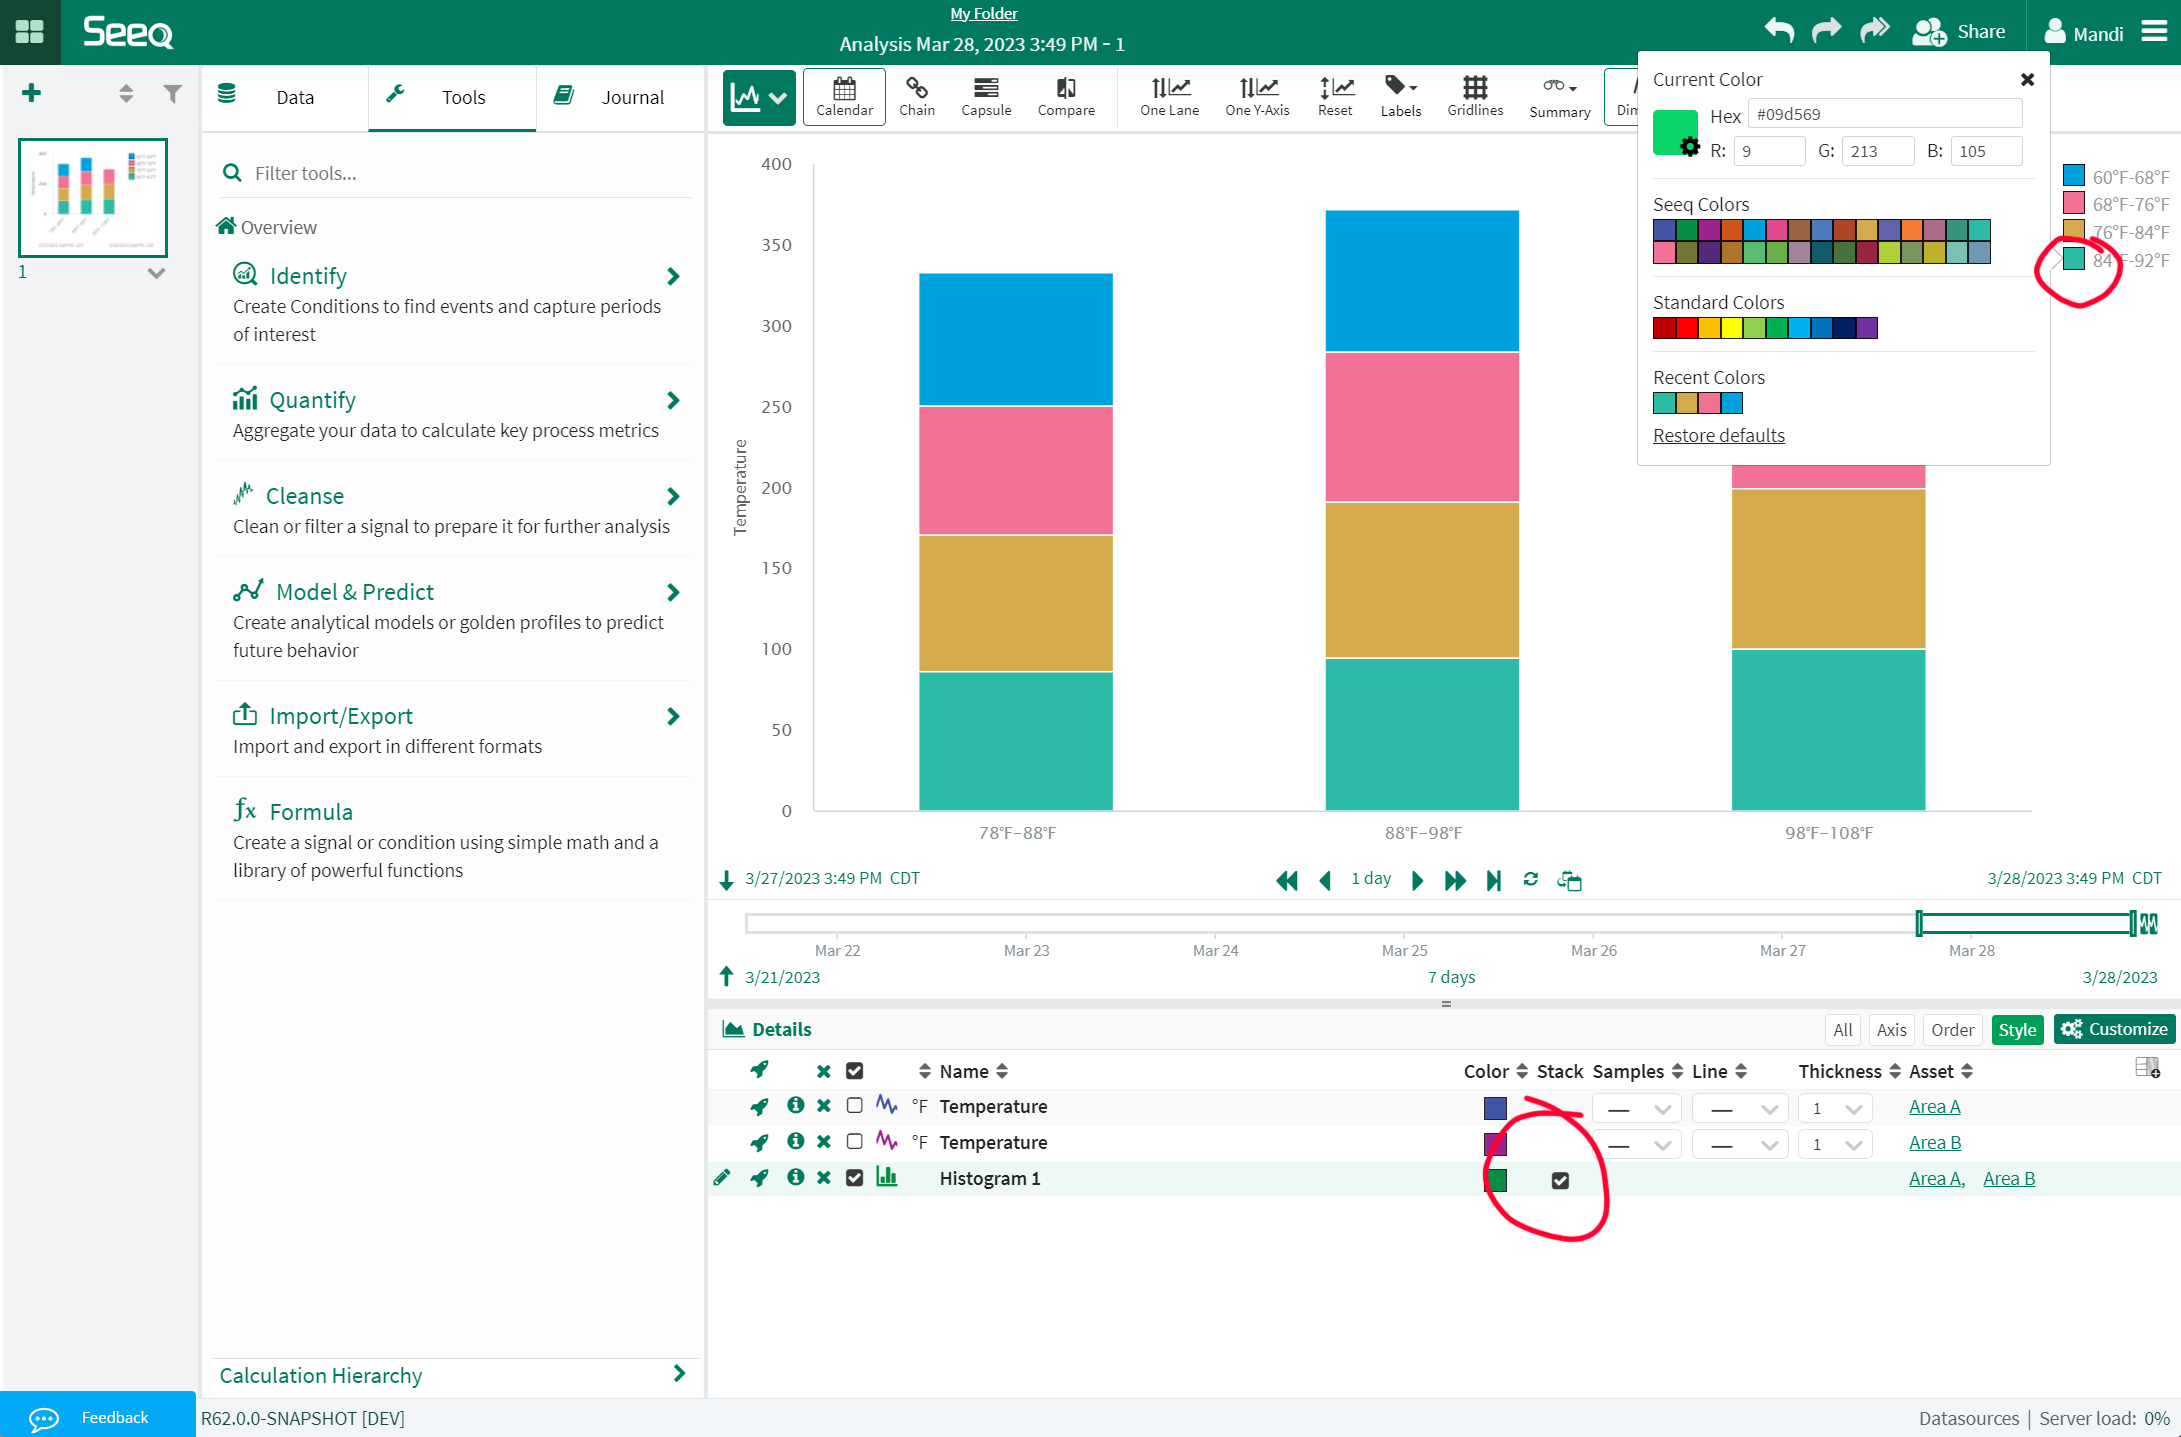
- Stack data by clicking the "Customize" button in the Details pane header
- When using the multiple groupings you can specify the color for each group by clicking on the legend in the upper right hand corner of the histogram