Scatter Plot Selection Tool
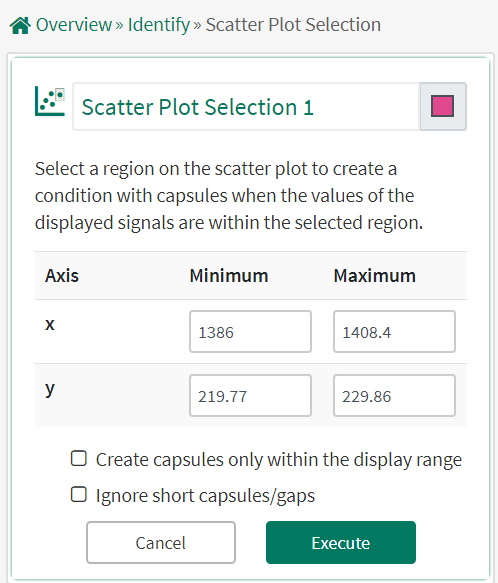
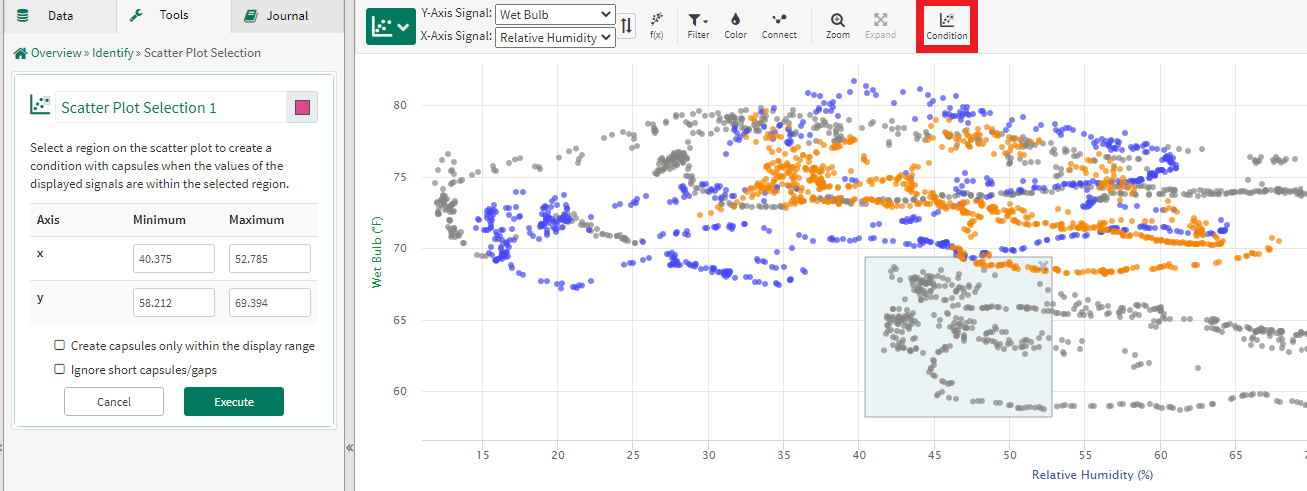
The Scatter Plot Selection tool allows users to create a new condition from a region selected on the scatter plot. The condition created will have capsules when the values of both of the plotted signals are inside the selected region.
Using the Scatter Plot Selection Tool
Example Uses
You see unexpected outliers when viewing two signals on the scatter plot. You create a condition representing that region of the plot, and use it to highlight these time periods in Trend View to investigate other signals and possible causes of aberrant behavior.


