Isolation Forest (iForest)
What is an Isolation Forest (iForest)?
Imagine you're sorting through a box of marbles. Most of the marbles are similar in size, color, and texture, but occasionally, you find an odd one—perhaps it's much larger, a different material, or an unusual color. Isolation Forests work in a similar way: they identify the "odd ones out" in a dataset.
Isolation Forests isolate anomalies by randomly splitting data along its features, similar to how you might quickly separate the unusual marbles from the common ones by noticing obvious differences. Points that are very different from the majority of the data—like those rare marbles—stand out and are isolated more quickly.
How Isolation Forests Work for Detecting Anomalies in Time Series Data
Detecting anomalies in time series data is about identifying events that deviate significantly from normal patterns. Isolation Forests achieve this by:
Randomly splitting the data into smaller subsets using features.
Measuring how quickly each data point gets isolated.
Normal data points require many splits to be isolated because they fit well with the rest of the data. In contrast, anomalies get isolated much faster due to their distinct characteristics.
Example: Imagine monitoring a pipeline’s pressure over time. An Isolation Forest trained on historical data can learn what normal pressure fluctuations look like. If the algorithm detects a sudden, sharp deviation in pressure that isolates quickly, it flags this as an anomaly, signaling a possible leak or blockage.
Using the Isolation Forest Tool
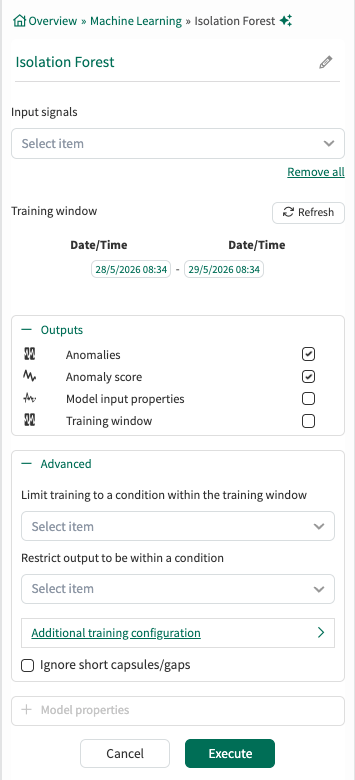
Input Signals: From the dropdown menu, select at least one signal to serve as independent variable(s) for the model.
Training window: Select the fixed window of data on which the model will be trained. This defaults to the display range but can be modified.
Outputs:
Lists all outputs available for the current tool configuration. Choose which outputs the tool should generate and add to Trend. Default outputs are preselected, and additional supported outputs can be selected as needed. For detailed descriptions of each output, see the output documentation.
Advanced Options:
Limit to condition within training window: You can choose to limit the data supplied for training to data from within the training window and within a condition. For example, choose a condition that identifies when an operation is running and all data outside of the condition (when the unit is not running) will be ignored for the model training.
Restrict output to be within a condition: You can limit the data displayed to only show results within a relevant condition. If you limit the model to periods of time when the unit is running, you would likely want to restrict the output to the same running condition. You can use different condition here than the training window if appropriate.
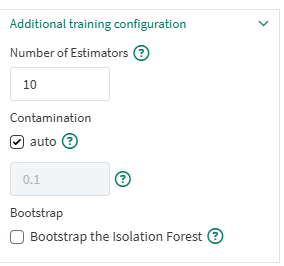
Additional Training Configuration
Number of Estimators: This number represents how many partitions are used to describe the clusters of data. A higher number can result in a more accurate number, but training and evaluation will take longer.
Contamination: The default is auto. This number represents the expected percentage of anomalies in the training data. The default value tries to estimate this percentage automatically. You can unselect this check box and apply a different value below to specify contamination. Smaller values will result in fewer anomalies being detected.
Bootstrap: Default is unselected, where sampling without replacement is performed. When selected, trees are fit on random subset of training data sampled with replacements.
Use Cases for Isolation Forests in Key Industries
Manufacturing and Production Monitoring
Isolation Forests help spot irregularities in production processes and equipment health:
Predictive Maintenance: Detecting unusual vibration, temperature, or pressure data to predict when machinery may fail.
Defect Detection: Flagging anomalies in product dimensions or sensor readings during manufacturing to ensure quality.
Pharmaceutical Manufacturing and Quality Assurance
In industries where precision and compliance are critical, Isolation Forests help maintain consistent standards:
Process Variation Detection: Identifying irregularities in mixing times, ingredient proportions, or environmental conditions that may affect drug quality.
Environment Monitoring: Flagging anomalies in temperature, air pressure, or humidity levels in cleanrooms.
Chemical and Petrochemical Processes
Complex chemical systems benefit from anomaly detection to ensure efficiency and safety:
Reactor Monitoring: Identifying sudden shifts in pressure, flow rate, or chemical composition that could indicate inefficiencies or hazards.
Leak Detection: Pinpointing unusual data patterns that may signal gas or fluid leaks in pipelines.
Semiconductor Manufacturing
With high precision requirements, Isolation Forests assist in maintaining operational excellence:
Yield Optimization: Detecting sensor anomalies in wafer production, preventing defects in chips.
Environmental Control: Flagging changes in cleanroom conditions, such as particle contamination or temperature shifts.
Energy and Utilities
For critical infrastructure, Isolation Forests help maintain reliability and safety:
Power Grid Monitoring: Spotting anomalies in load patterns or voltage irregularities that could signal potential outages or stress points.
Pipeline Integrity: Detecting unusual flow rates or pressure changes that might indicate leaks or blockages.
Renewable Energy Systems
Wind Turbine Analysis: Identifying unusual vibration patterns or power output drops to schedule maintenance proactively.
Solar Panel Health: Monitoring performance metrics to flag anomalies that may indicate damage or efficiency loss.
Benefits of Isolation Forests
Efficient with High-Dimensional Data: Isolation Forests work well with datasets that have many features, making them ideal for sensor-heavy industries.
Fast and Scalable: The algorithm’s structure allows it to process large datasets quickly.
Unsupervised Learning: It does not require labeled data, making it flexible for anomaly detection in various environments.
A Few Limitations of Isolation Forests
While Isolation Forests are powerful, they have some limitations:
Randomness of Splits: Results may vary slightly due to the random nature of the algorithm. Ensuring reproducibility requires careful configuration.
Sensitive to Parameters: Performance can depend on parameters like the number of trees or subsampling size, requiring fine-tuning.
Assumption of Isolated Anomalies: They work best when anomalies are rare and distinct from normal patterns, making them less effective in complex datasets with overlapping distributions.
Notes on training the model
The data from the input signals that goes into training is auto gridded. This means that the samples from all the signals are aligned - same sampling rate across the training window. Each input signal will be resampled to have the same number of samples in the training window.
The signals may get down-sampled if the total number of samples in the training window is greater than 2.5 million.