Impact Reports provide a way to share and elevate internal Seeq use cases across an enterprise. Often individuals in one location may not be aware of how Seeq is used in other locations. Our customers follow best practices to host use case sharing sessions internally, and many leaders put a lot of effort into chasing down individual use cases to share. Impact Reports are intended to streamline the reporting of use cases and the value associated with them. This helps leaders understand how Seeq is used while also helping inspire individuals with use cases that may be relevant for them to apply.
Viewing Impact Reports
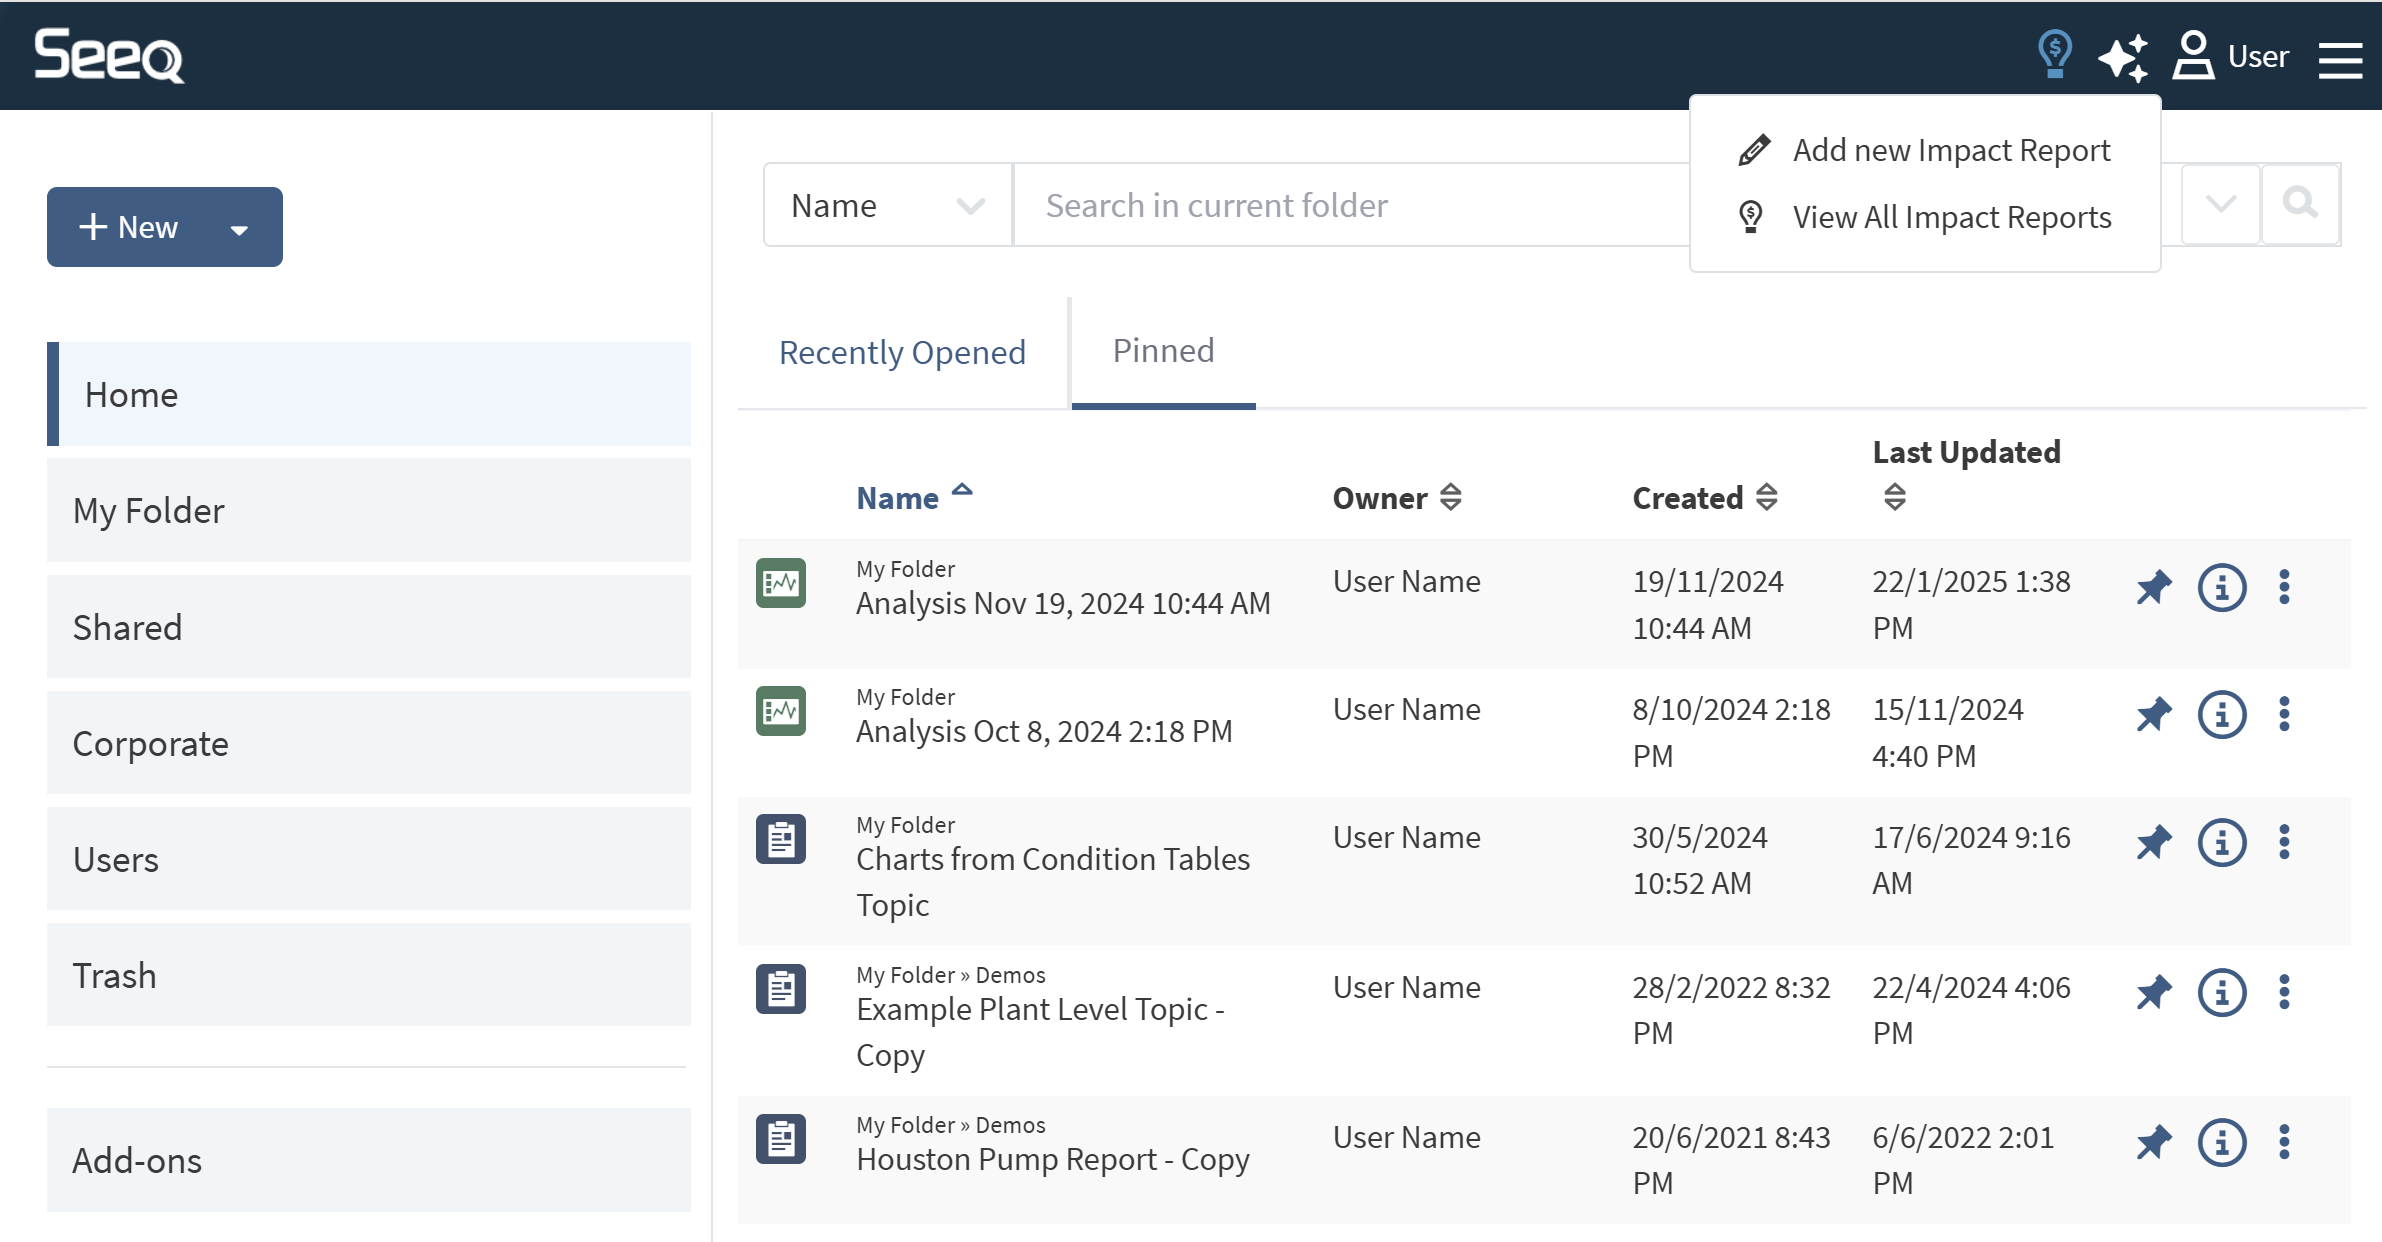
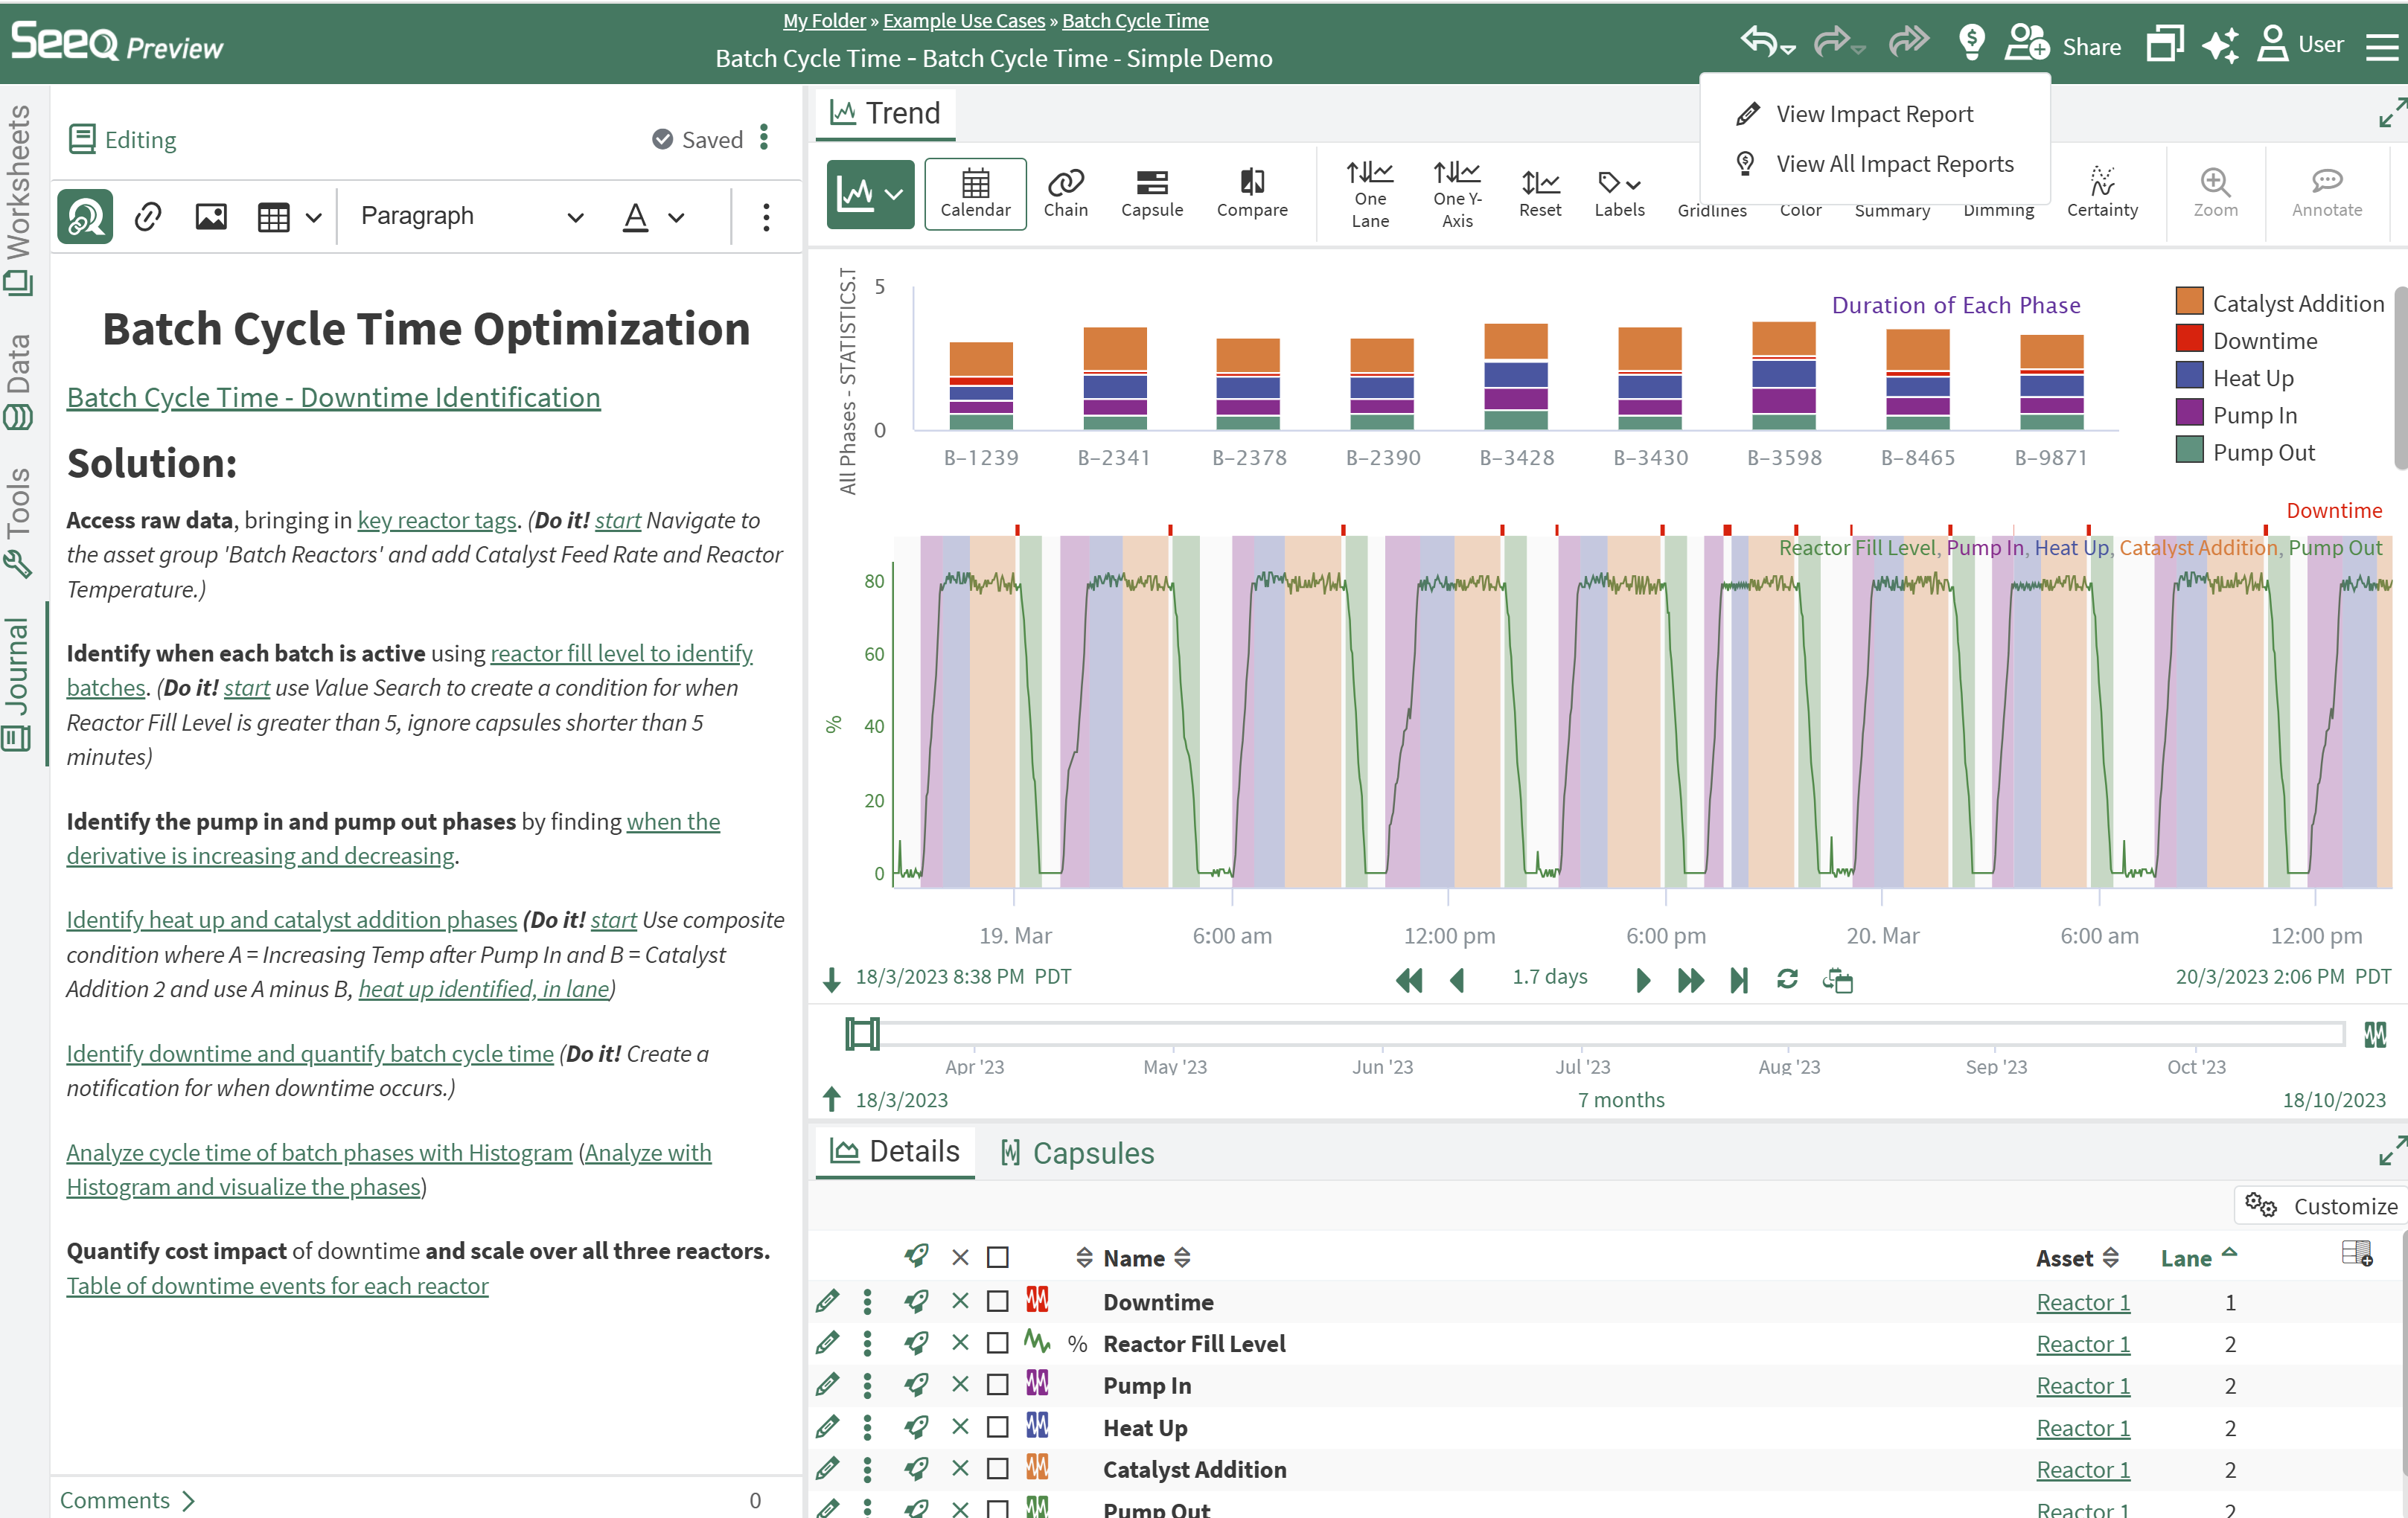
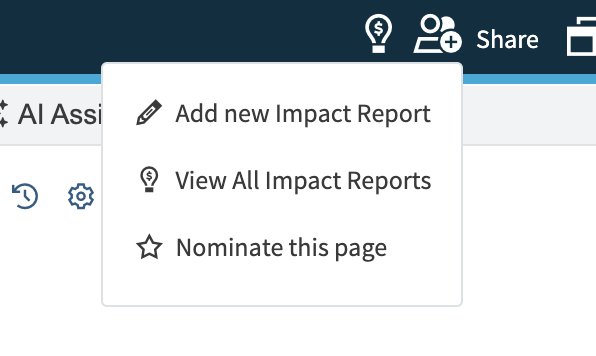
All Impact Reports are available in a single interface. Click the lightbulb in the upper right corner and select “View All Impact Reports” to access a single page to view and filter all Impact Reports. This lightbulb is accessible from any Seeq application. If you are on a link that has already been associated with an Impact Report, the lightbulb will be solid.
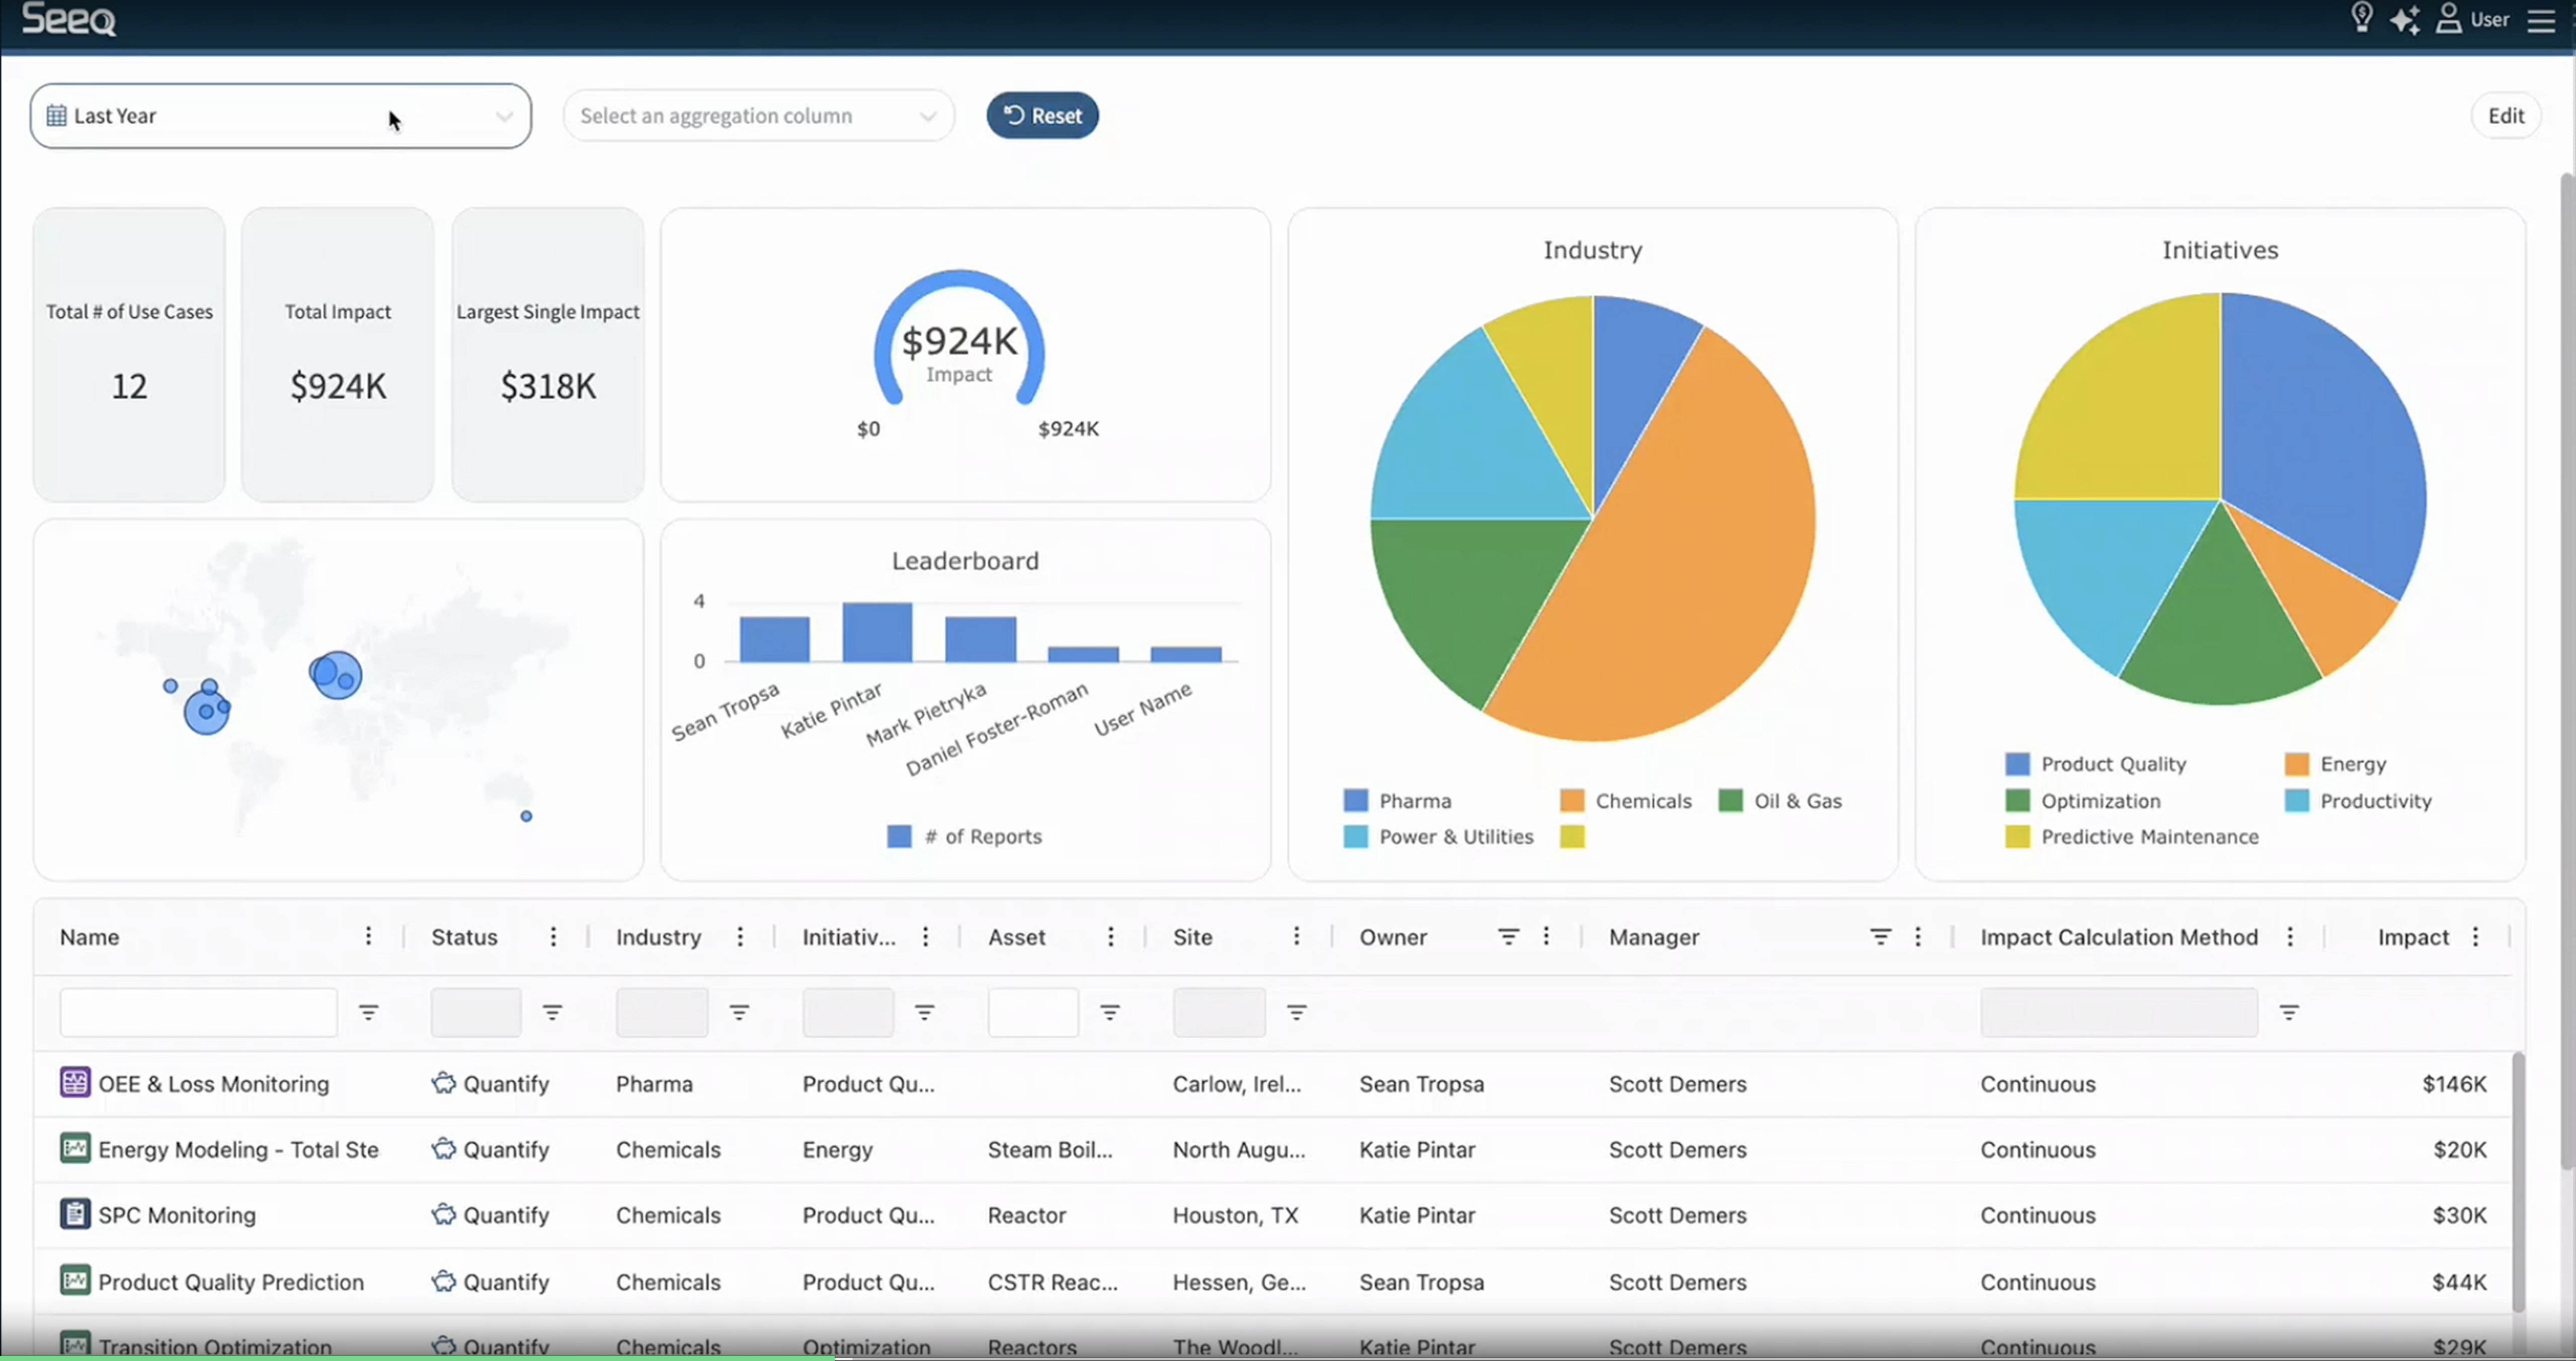
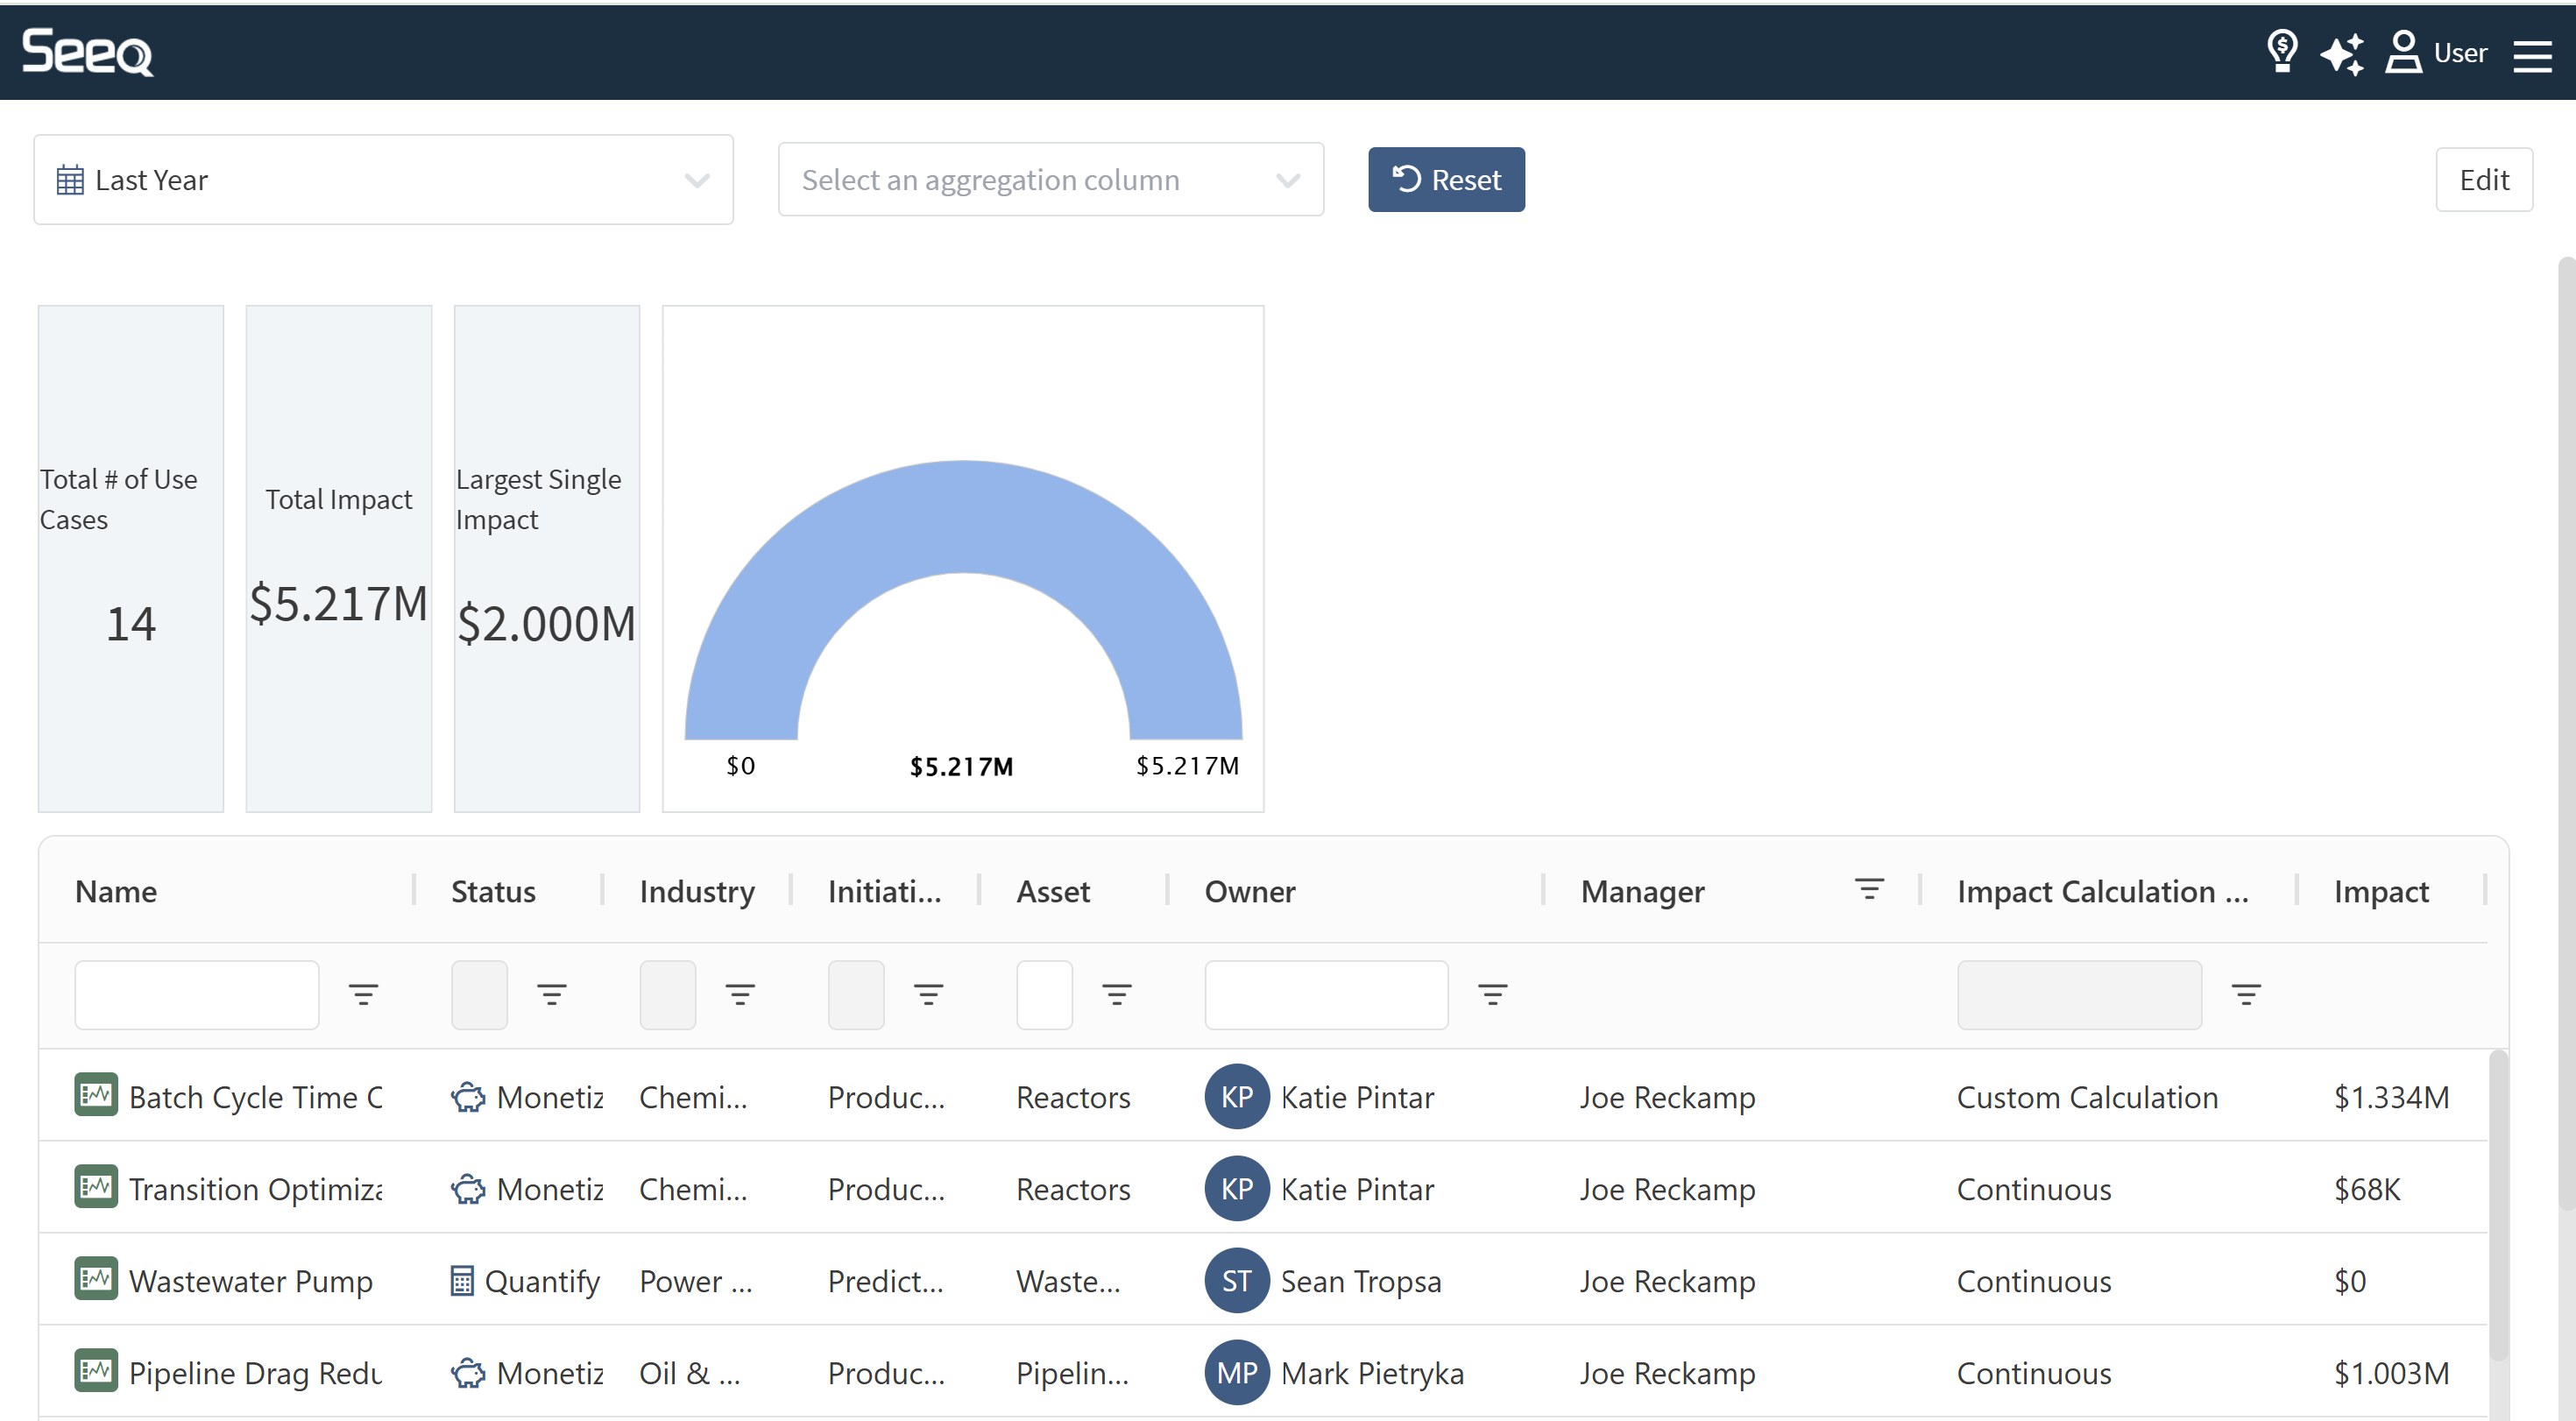
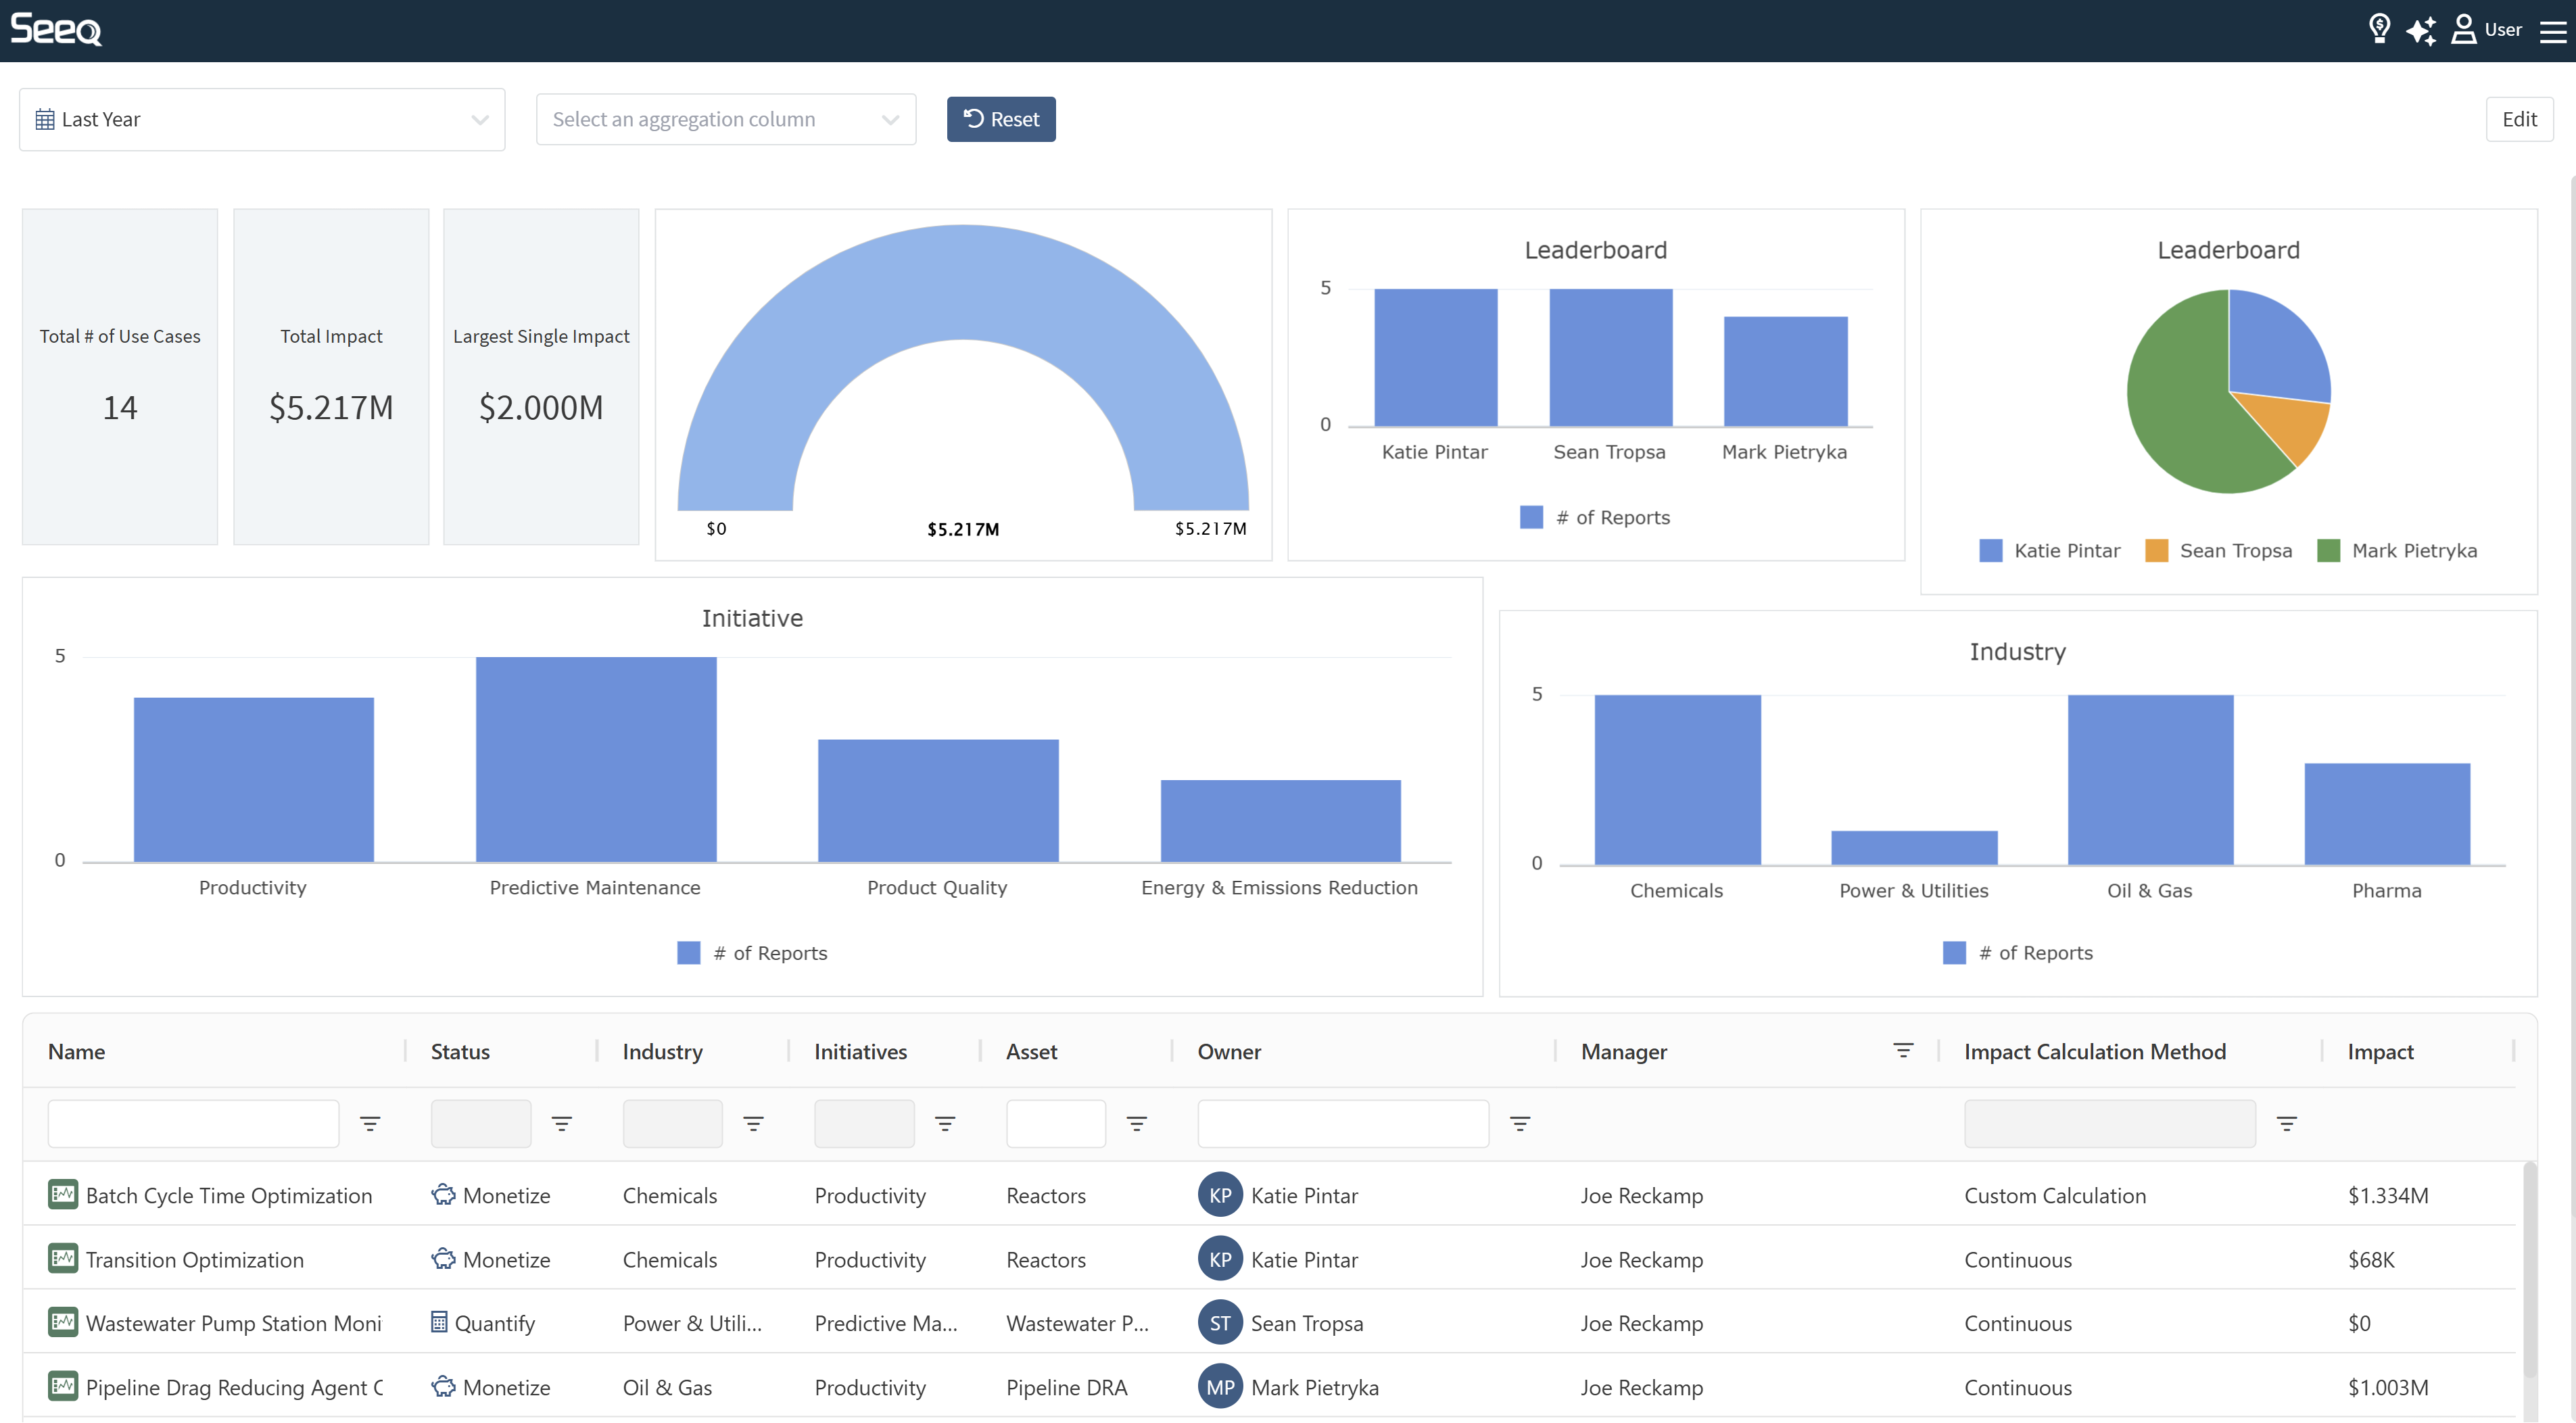
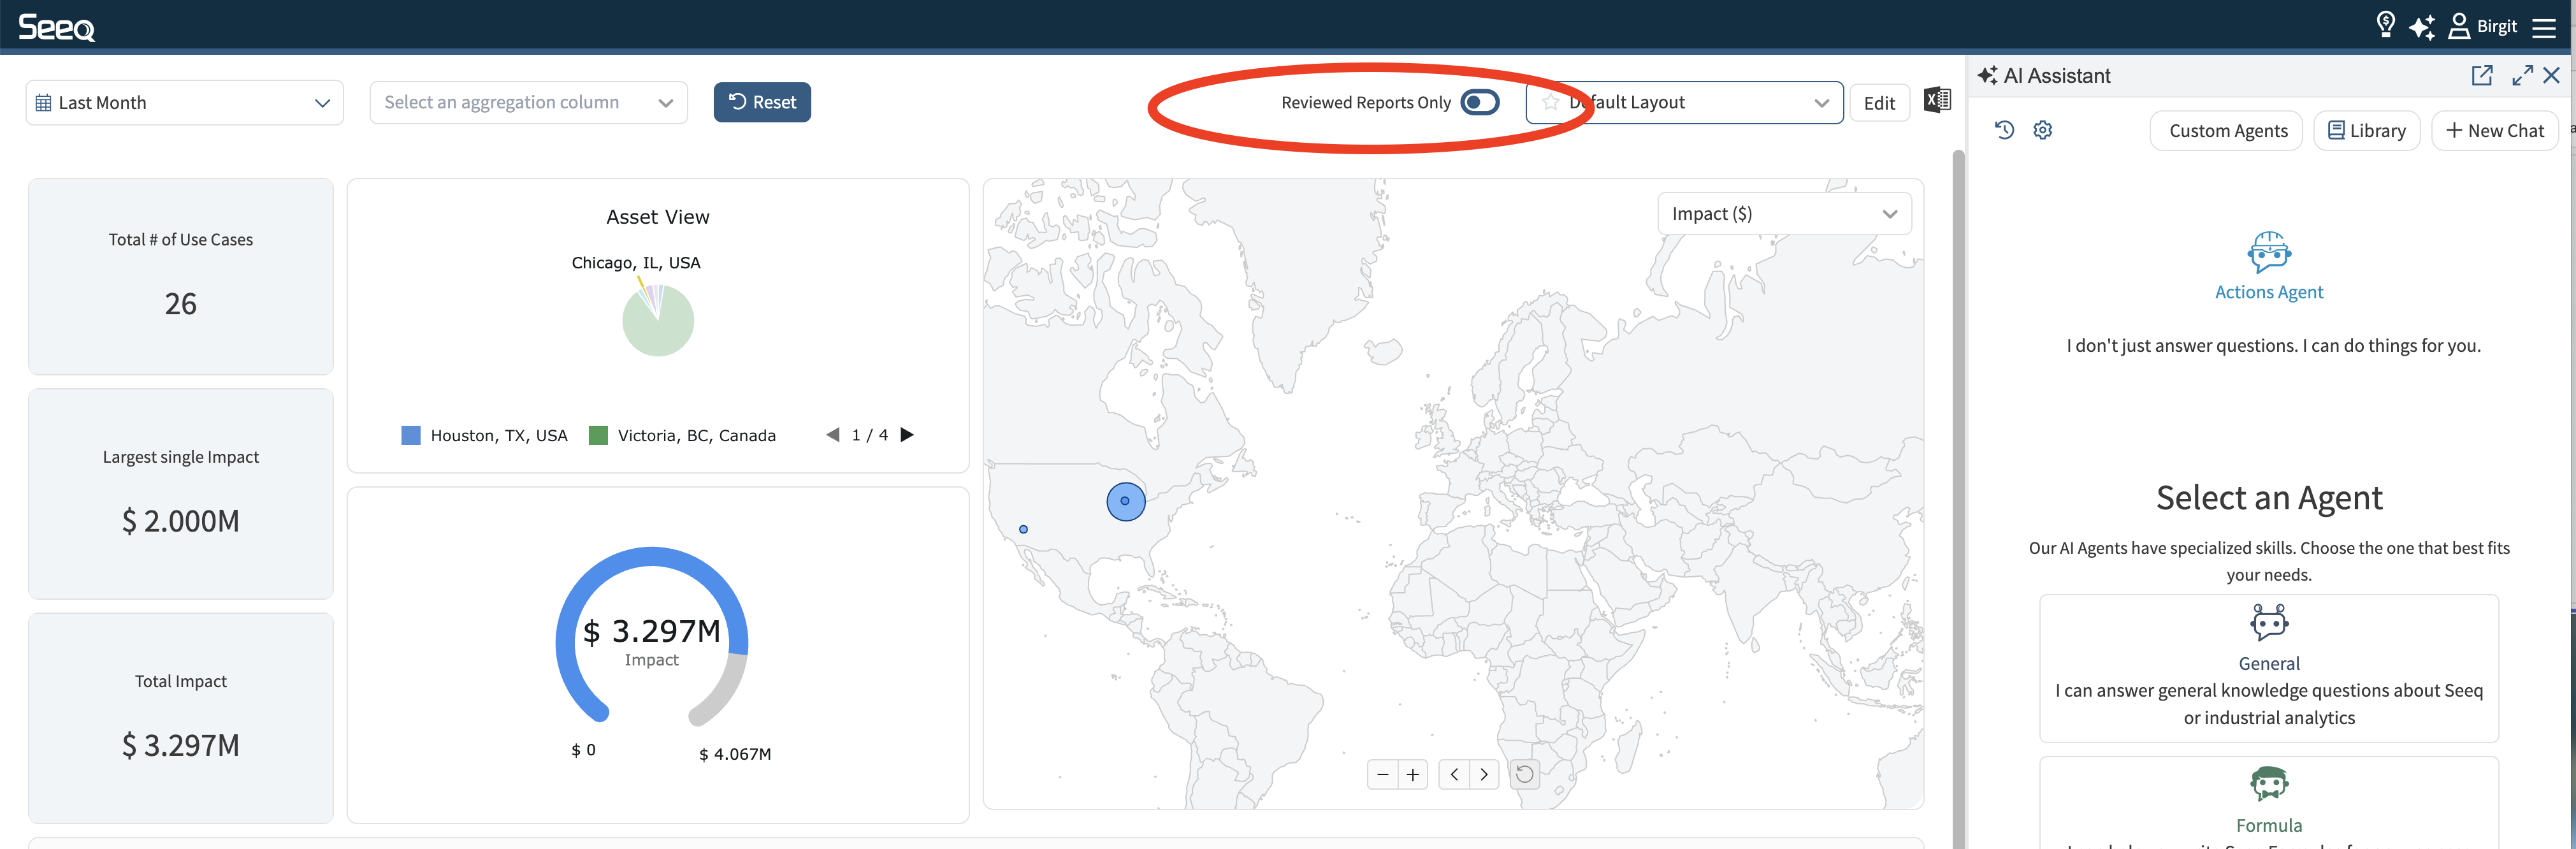
The default display has several summary cards and a dial of total value documented across use cases, along with a table with a summary of all the details. You will likely want to personalize this view.
Clicking on the rows in the Name column of the table will open a pop up with details of the Impact Report which include a description, current status, various categories, total impact, and a link to the originating worksheet, document, or room. Clicking the colored icon in each row will take you directly to the source in Seeq.
By default, the last year of Impact Reports will display, but you can modify the date range in the upper left by selecting from a pick list or entering specific start/end dates.
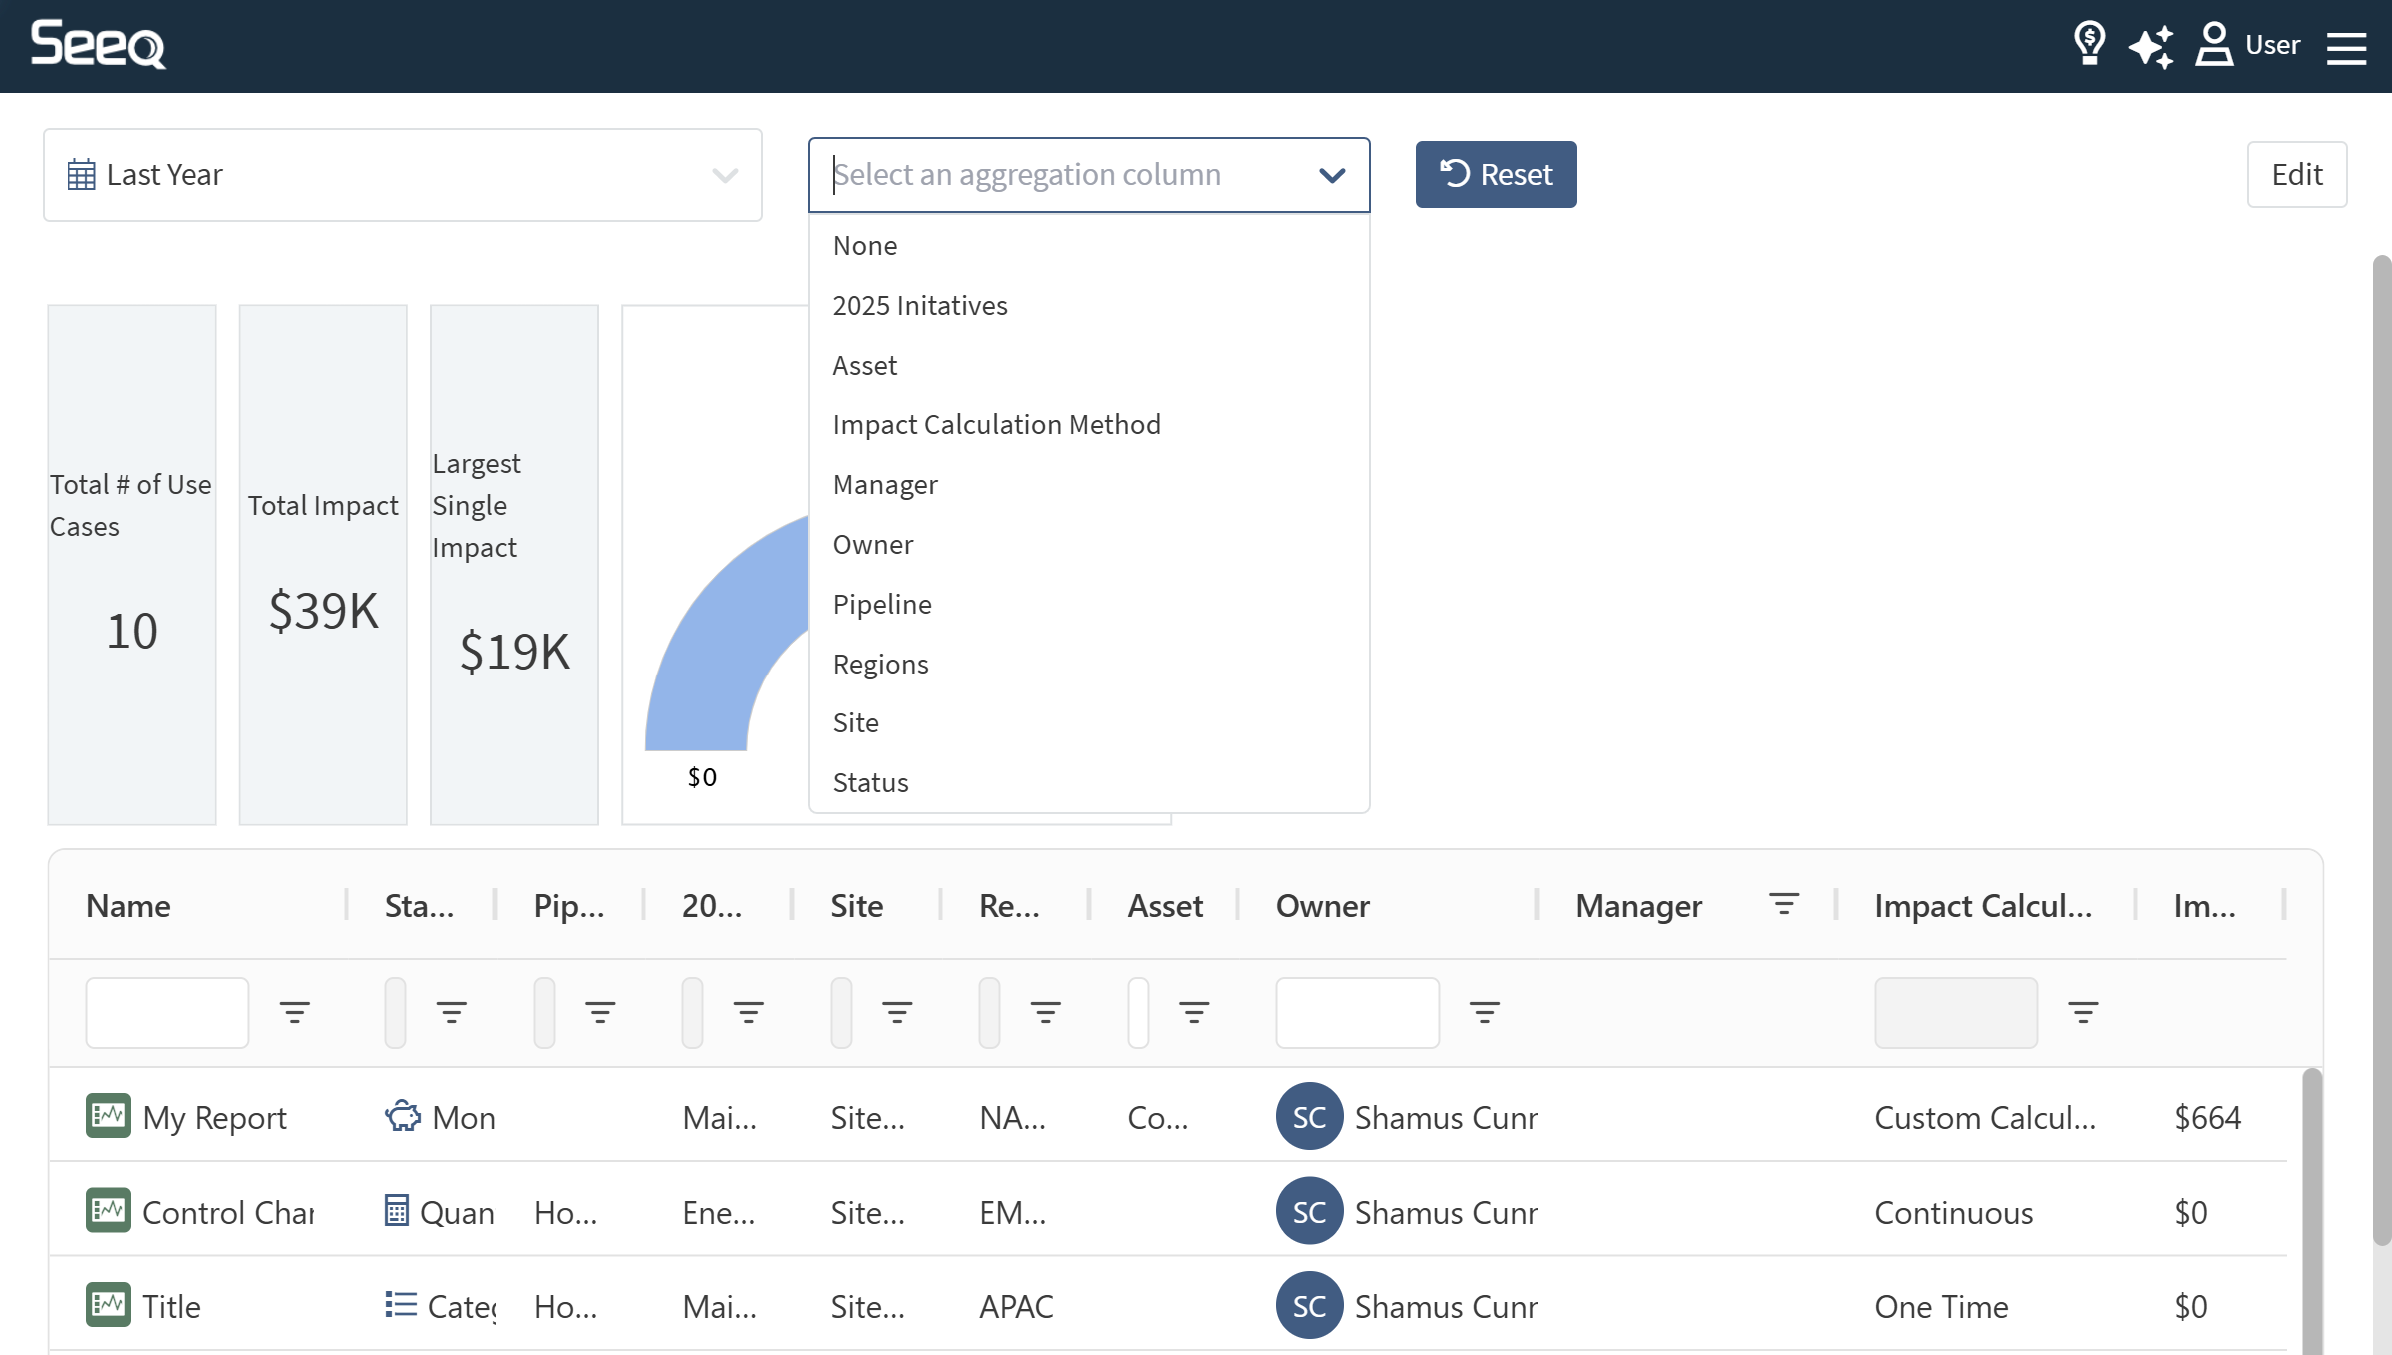
Use the second dropdown at the top of the screen to aggregate the table by various categories. These categories can be modified by an administrator to be relevant to your preferences for tracking impact.
Modifying your view of Impact Reports
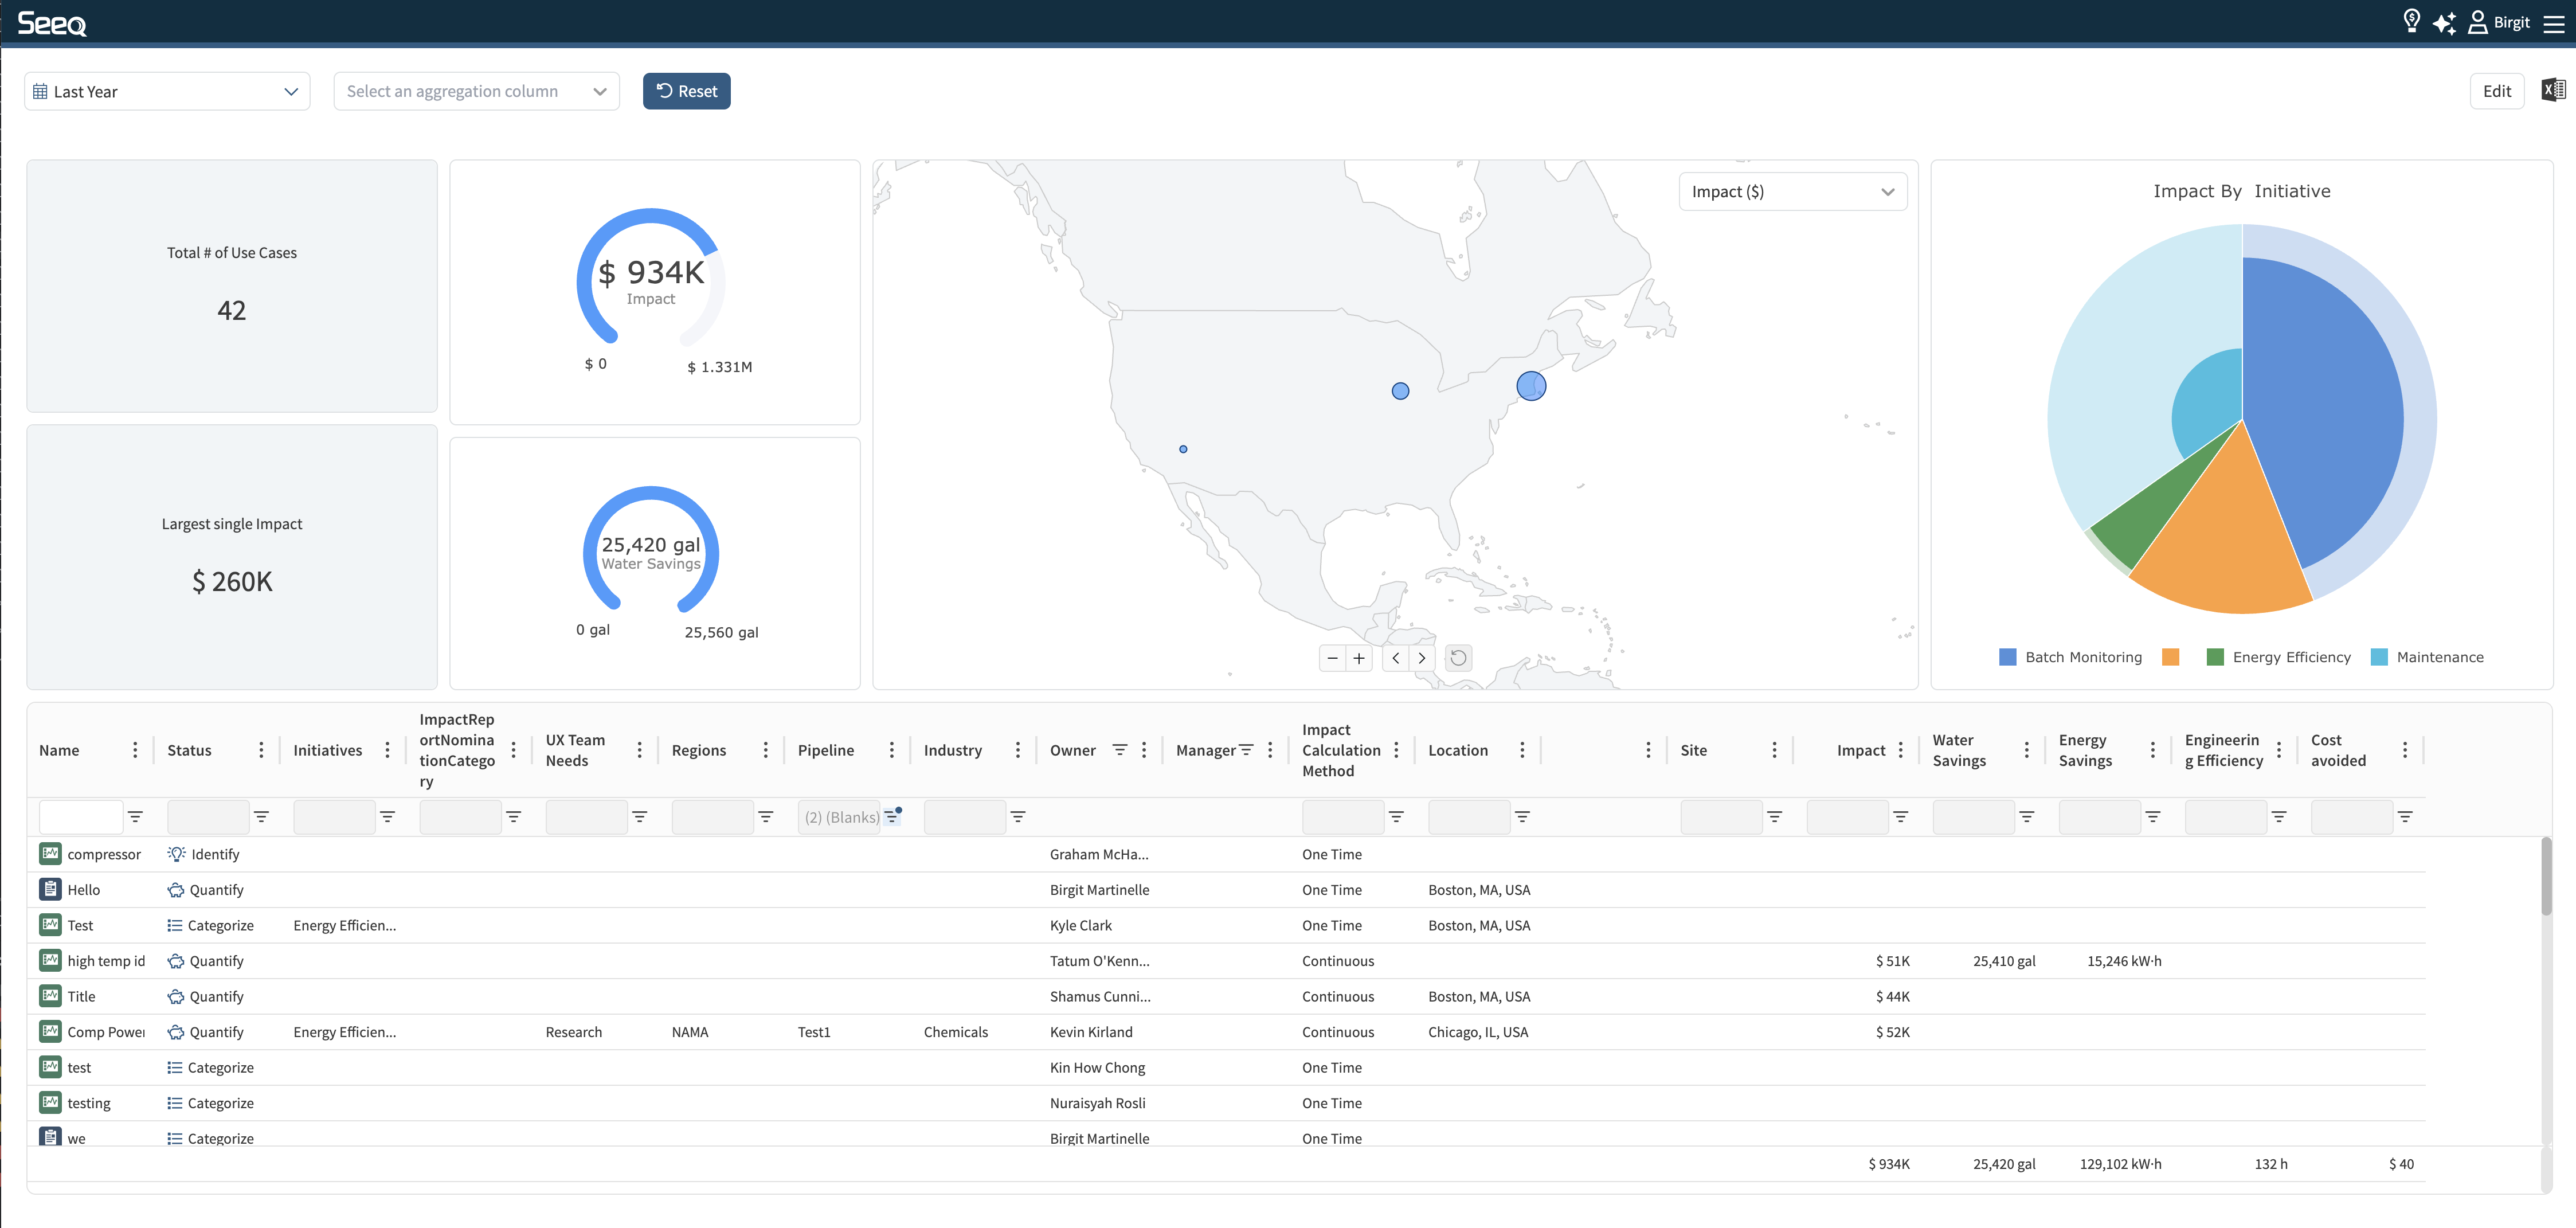
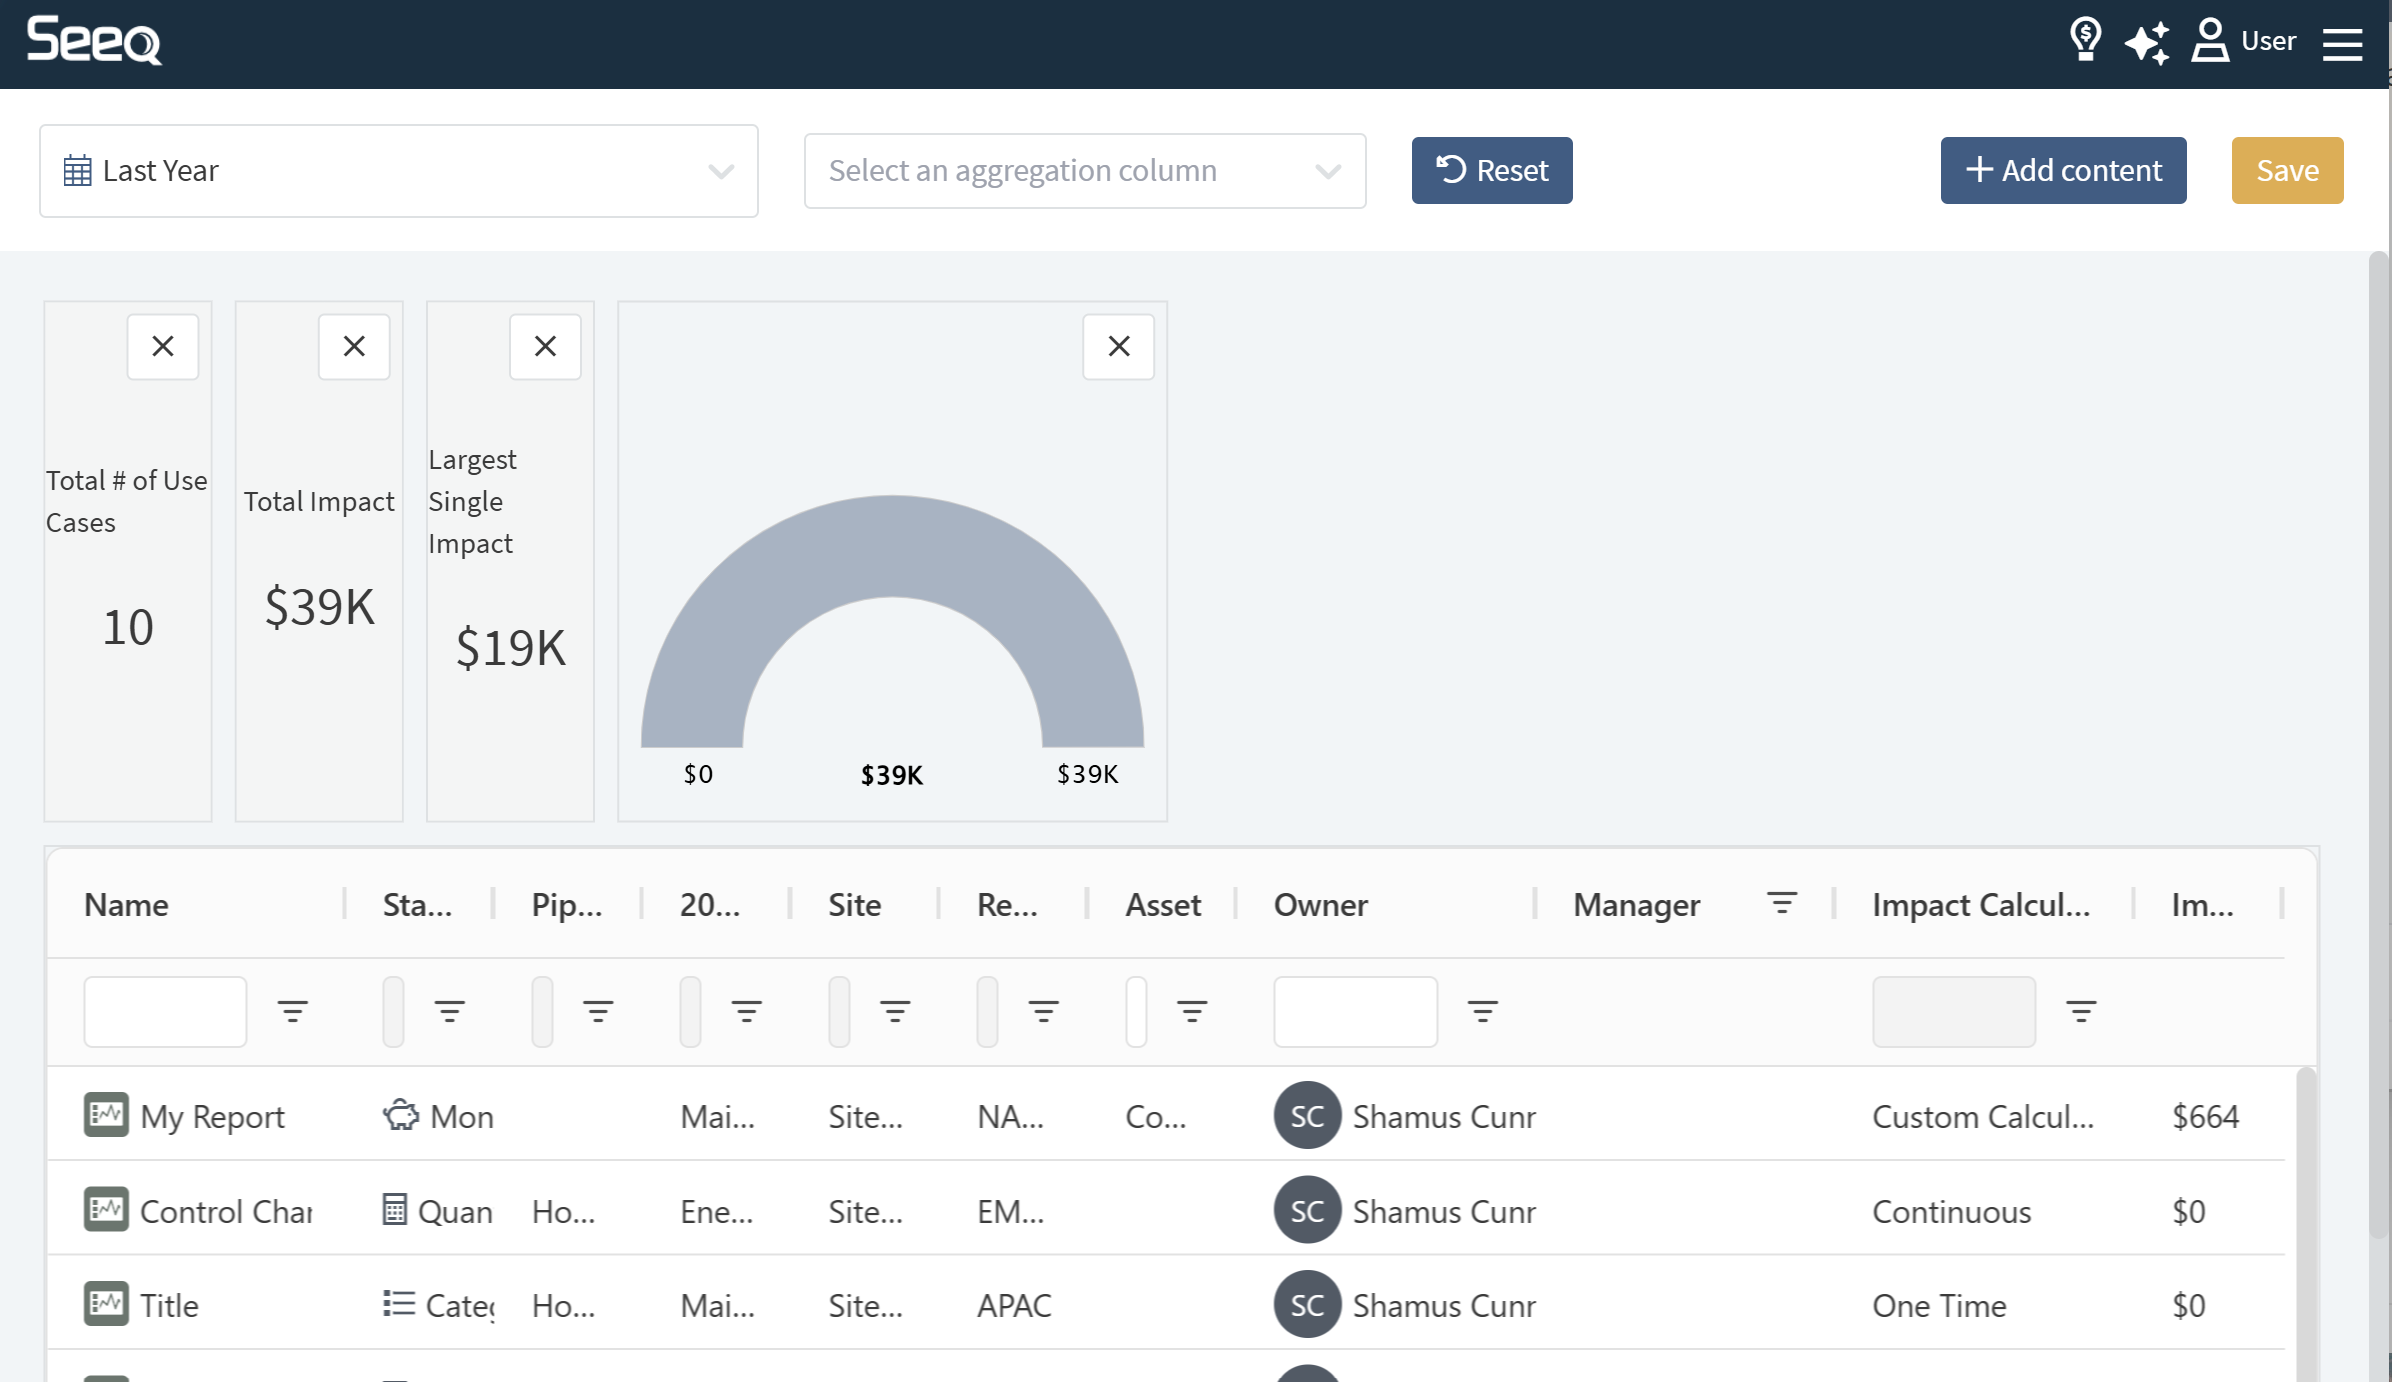
Each user can modify this view as desired, adding additional charts or removing unwanted content. Modifications made by one user will not be seen by any other users. To make modifications, click the Edit button in the upper right corner.
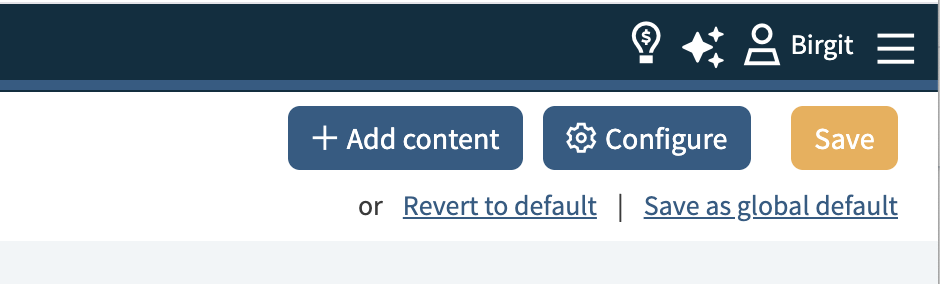
Remove content with the X in the upper right corner of each piece of content, modify columns of the table, or add new content with the “Add content” button in the upper right. Gauges, charts, additional boxes with values as well as Markdown Editor tiles can be added. When adding content, you will be presented with a form to configure each piece of content. This will allow you to select how you would like to aggregate and display the information. You can choose between counts of reports or total value documented.
Markdown Editor tiles enable users to provide text and images as part of the Impact Report dashboard.
New content will appear at the bottom of the page, but you can drag it around when in edit mode.
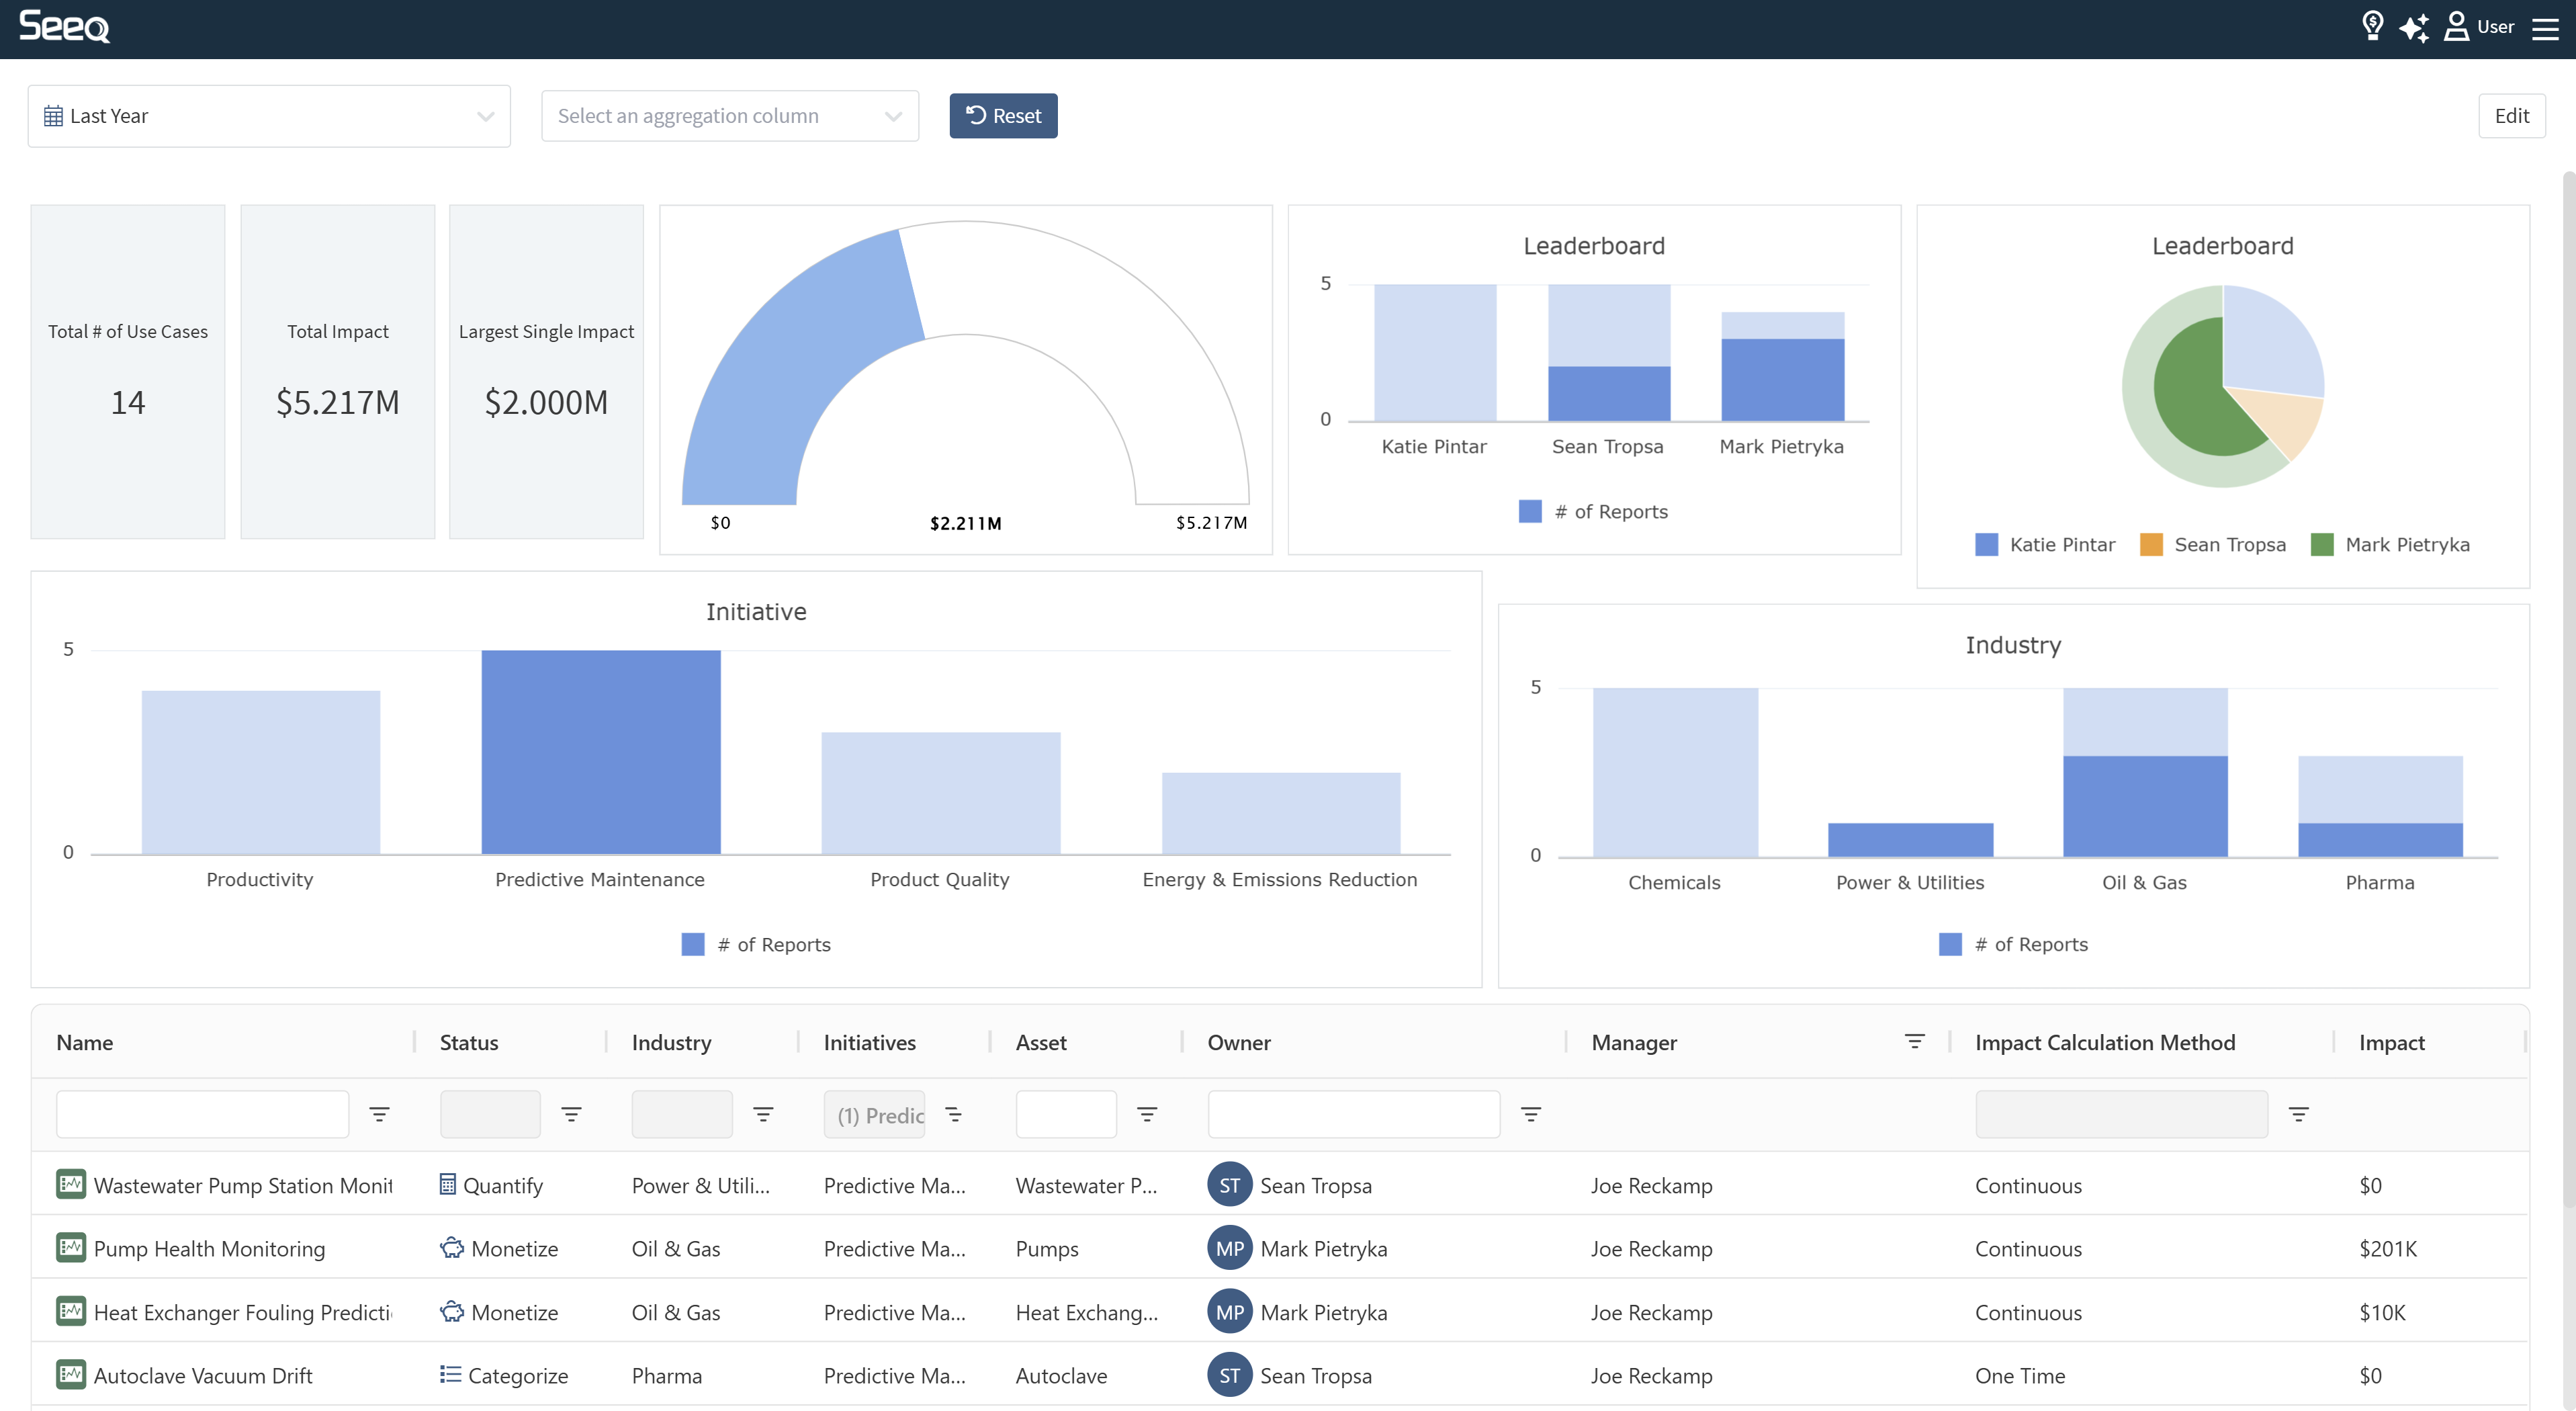
Click the Save button to exit the editing interface and see the updated display per your preference. You can tell you are still editing by the muted colors and presence of the “Add Content” button and “Save” button. As long as the “Save” button is in the upper right, your changes have not been saved and will be lost if you navigate away. In the image to the right, several boxes were removed and a bar chart and pie chart added to the default display.
Upon clicking “Save”, the colors are more vibrant and the “Save” button is no longer present, indicating you are viewing the impact reports.
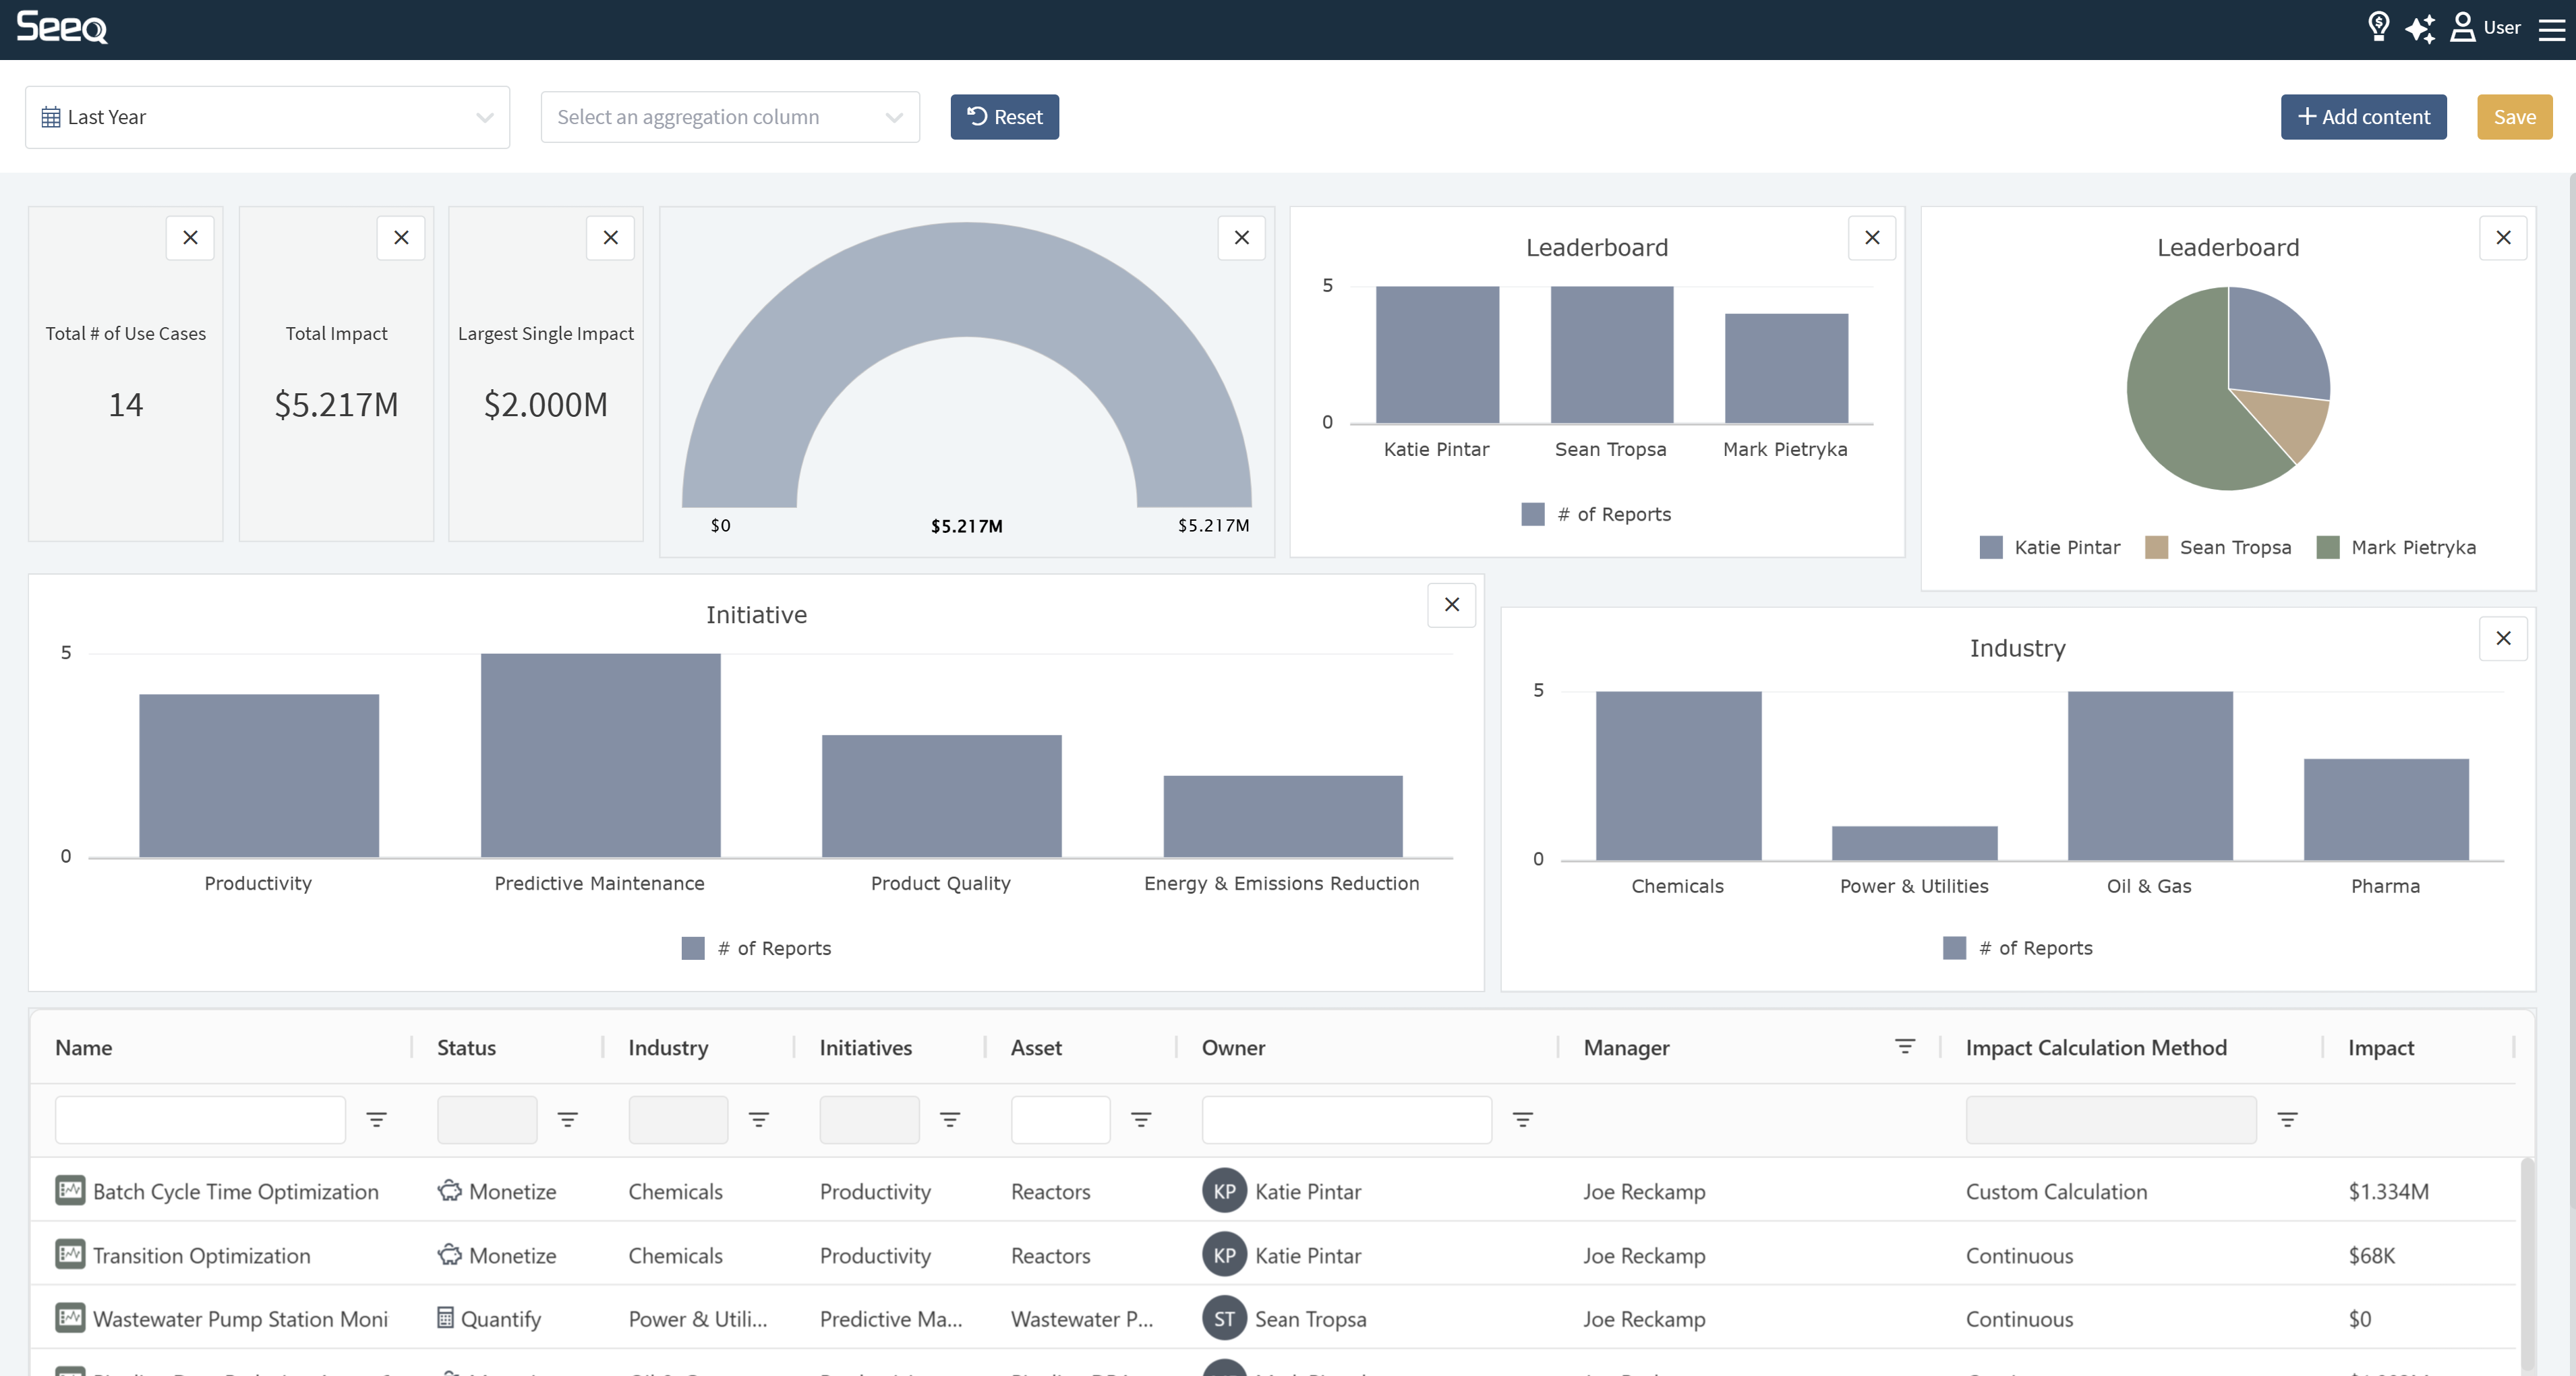
When other charts are present in the Impact Report View, they are interactive and making selections on the charts will filter the table accordingly to help you narrow in on a subset of the Impact Reports. Click the “Reset” button at the top of the screen to remove filters applied by selecting charts.
The columns displayed in the Impact Table can be configured by clicking on the 3-dot menu in the table header and selecting the “Choose columns” option. You can check and uncheck the desired columns to include or exclude them in your table. Column selection can be persisted when in View only mode and is automatically persisted when in Edit mode.
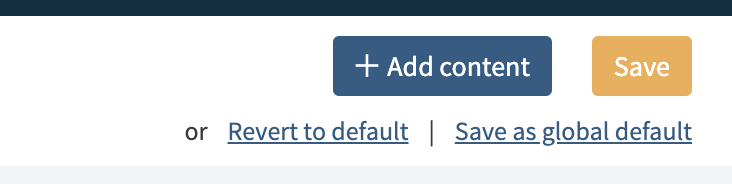
Admin Users can save a “Global Default” Layout that will be shown as the initial layout for users when they first view Impact Reports.
Alternatively Admin Users can also revert to the “out-of-the-box” default layout by clicking “Revert to default”.
Non-Admin Users can modify and further customize this Global Default to fit their own needs and create their own custom layout as described above.
Adding New Impact Reports
A new Impact Report can be added from a Workbook Analysis, Organizer Topic, or Vantage Room by clicking on the lightbulb in the upper right corner and selecting “Add new Impact Report”. The URL you navigate from will be automatically associated with the new Impact Report. If you start from the Home Screen or the view of all Impact Reports, the first step will be associating a relevant Seeq link.
There are four stages to Impact Reports: Identify, Categorize, Quantify, and Monetize. You do not need to get all the way through to save your Impact Report. You may not know all the details when you first enter your Impact Report, but you or others can help move it through the stages as appropriate.
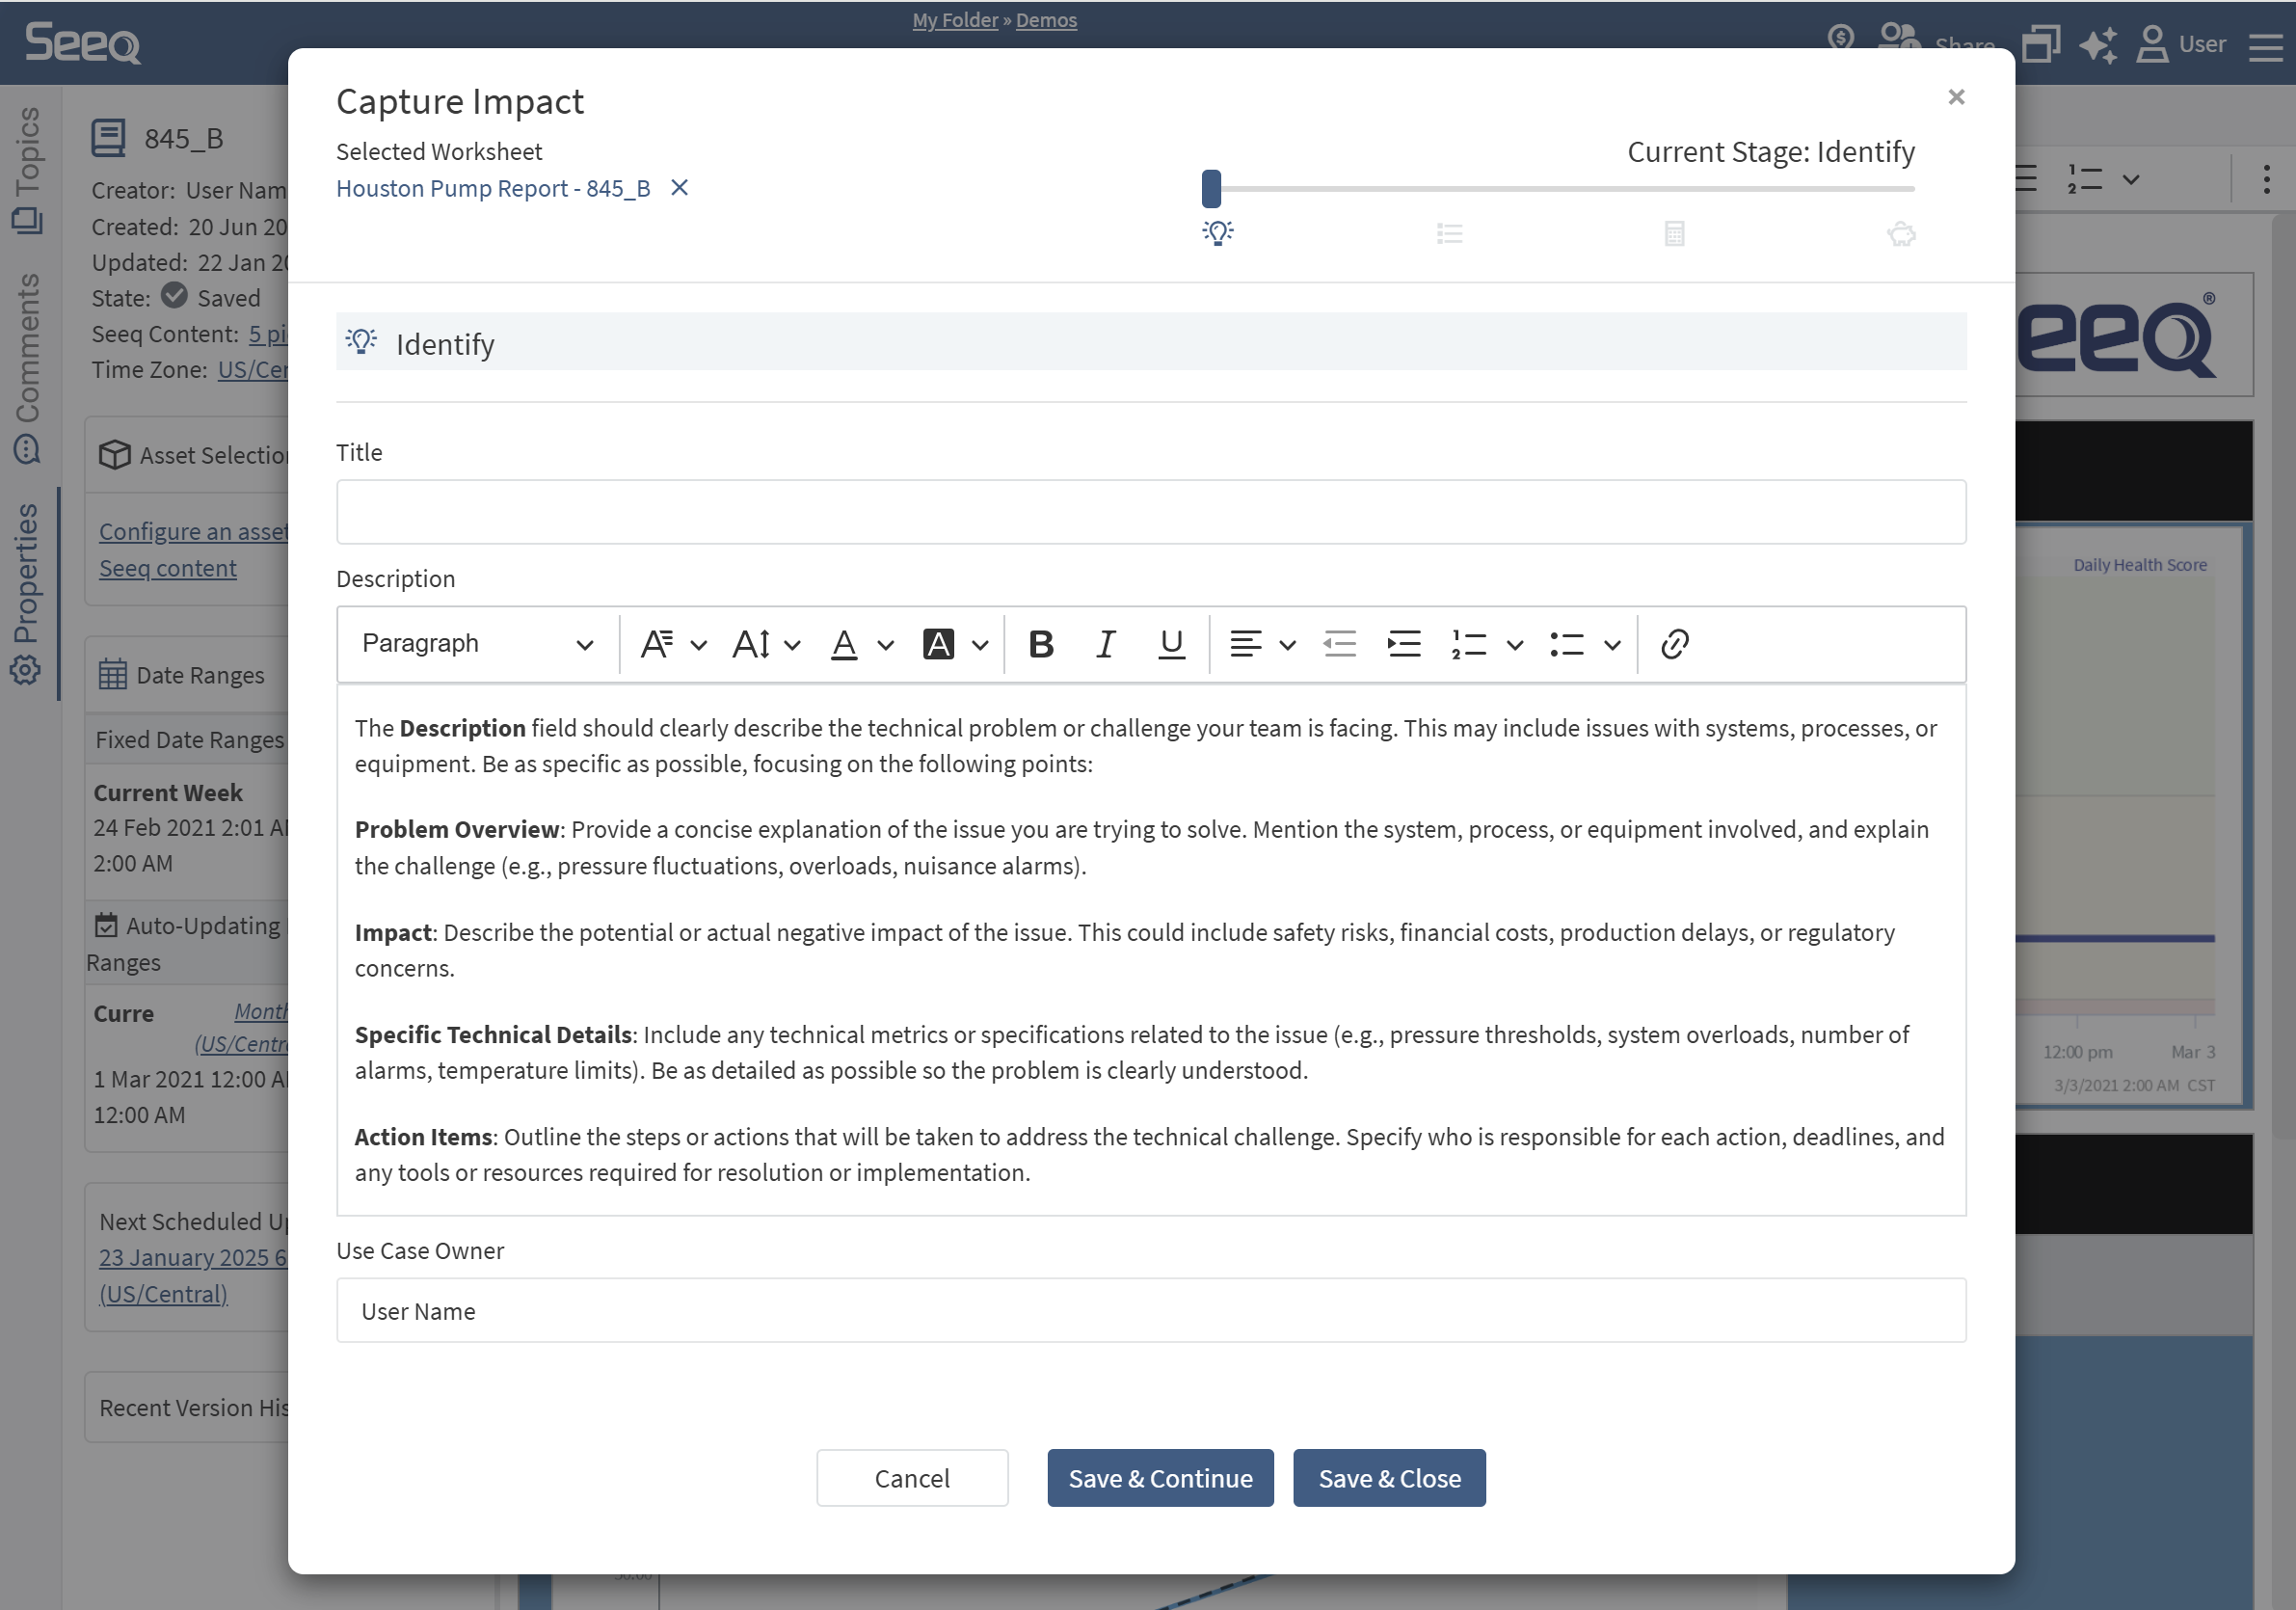
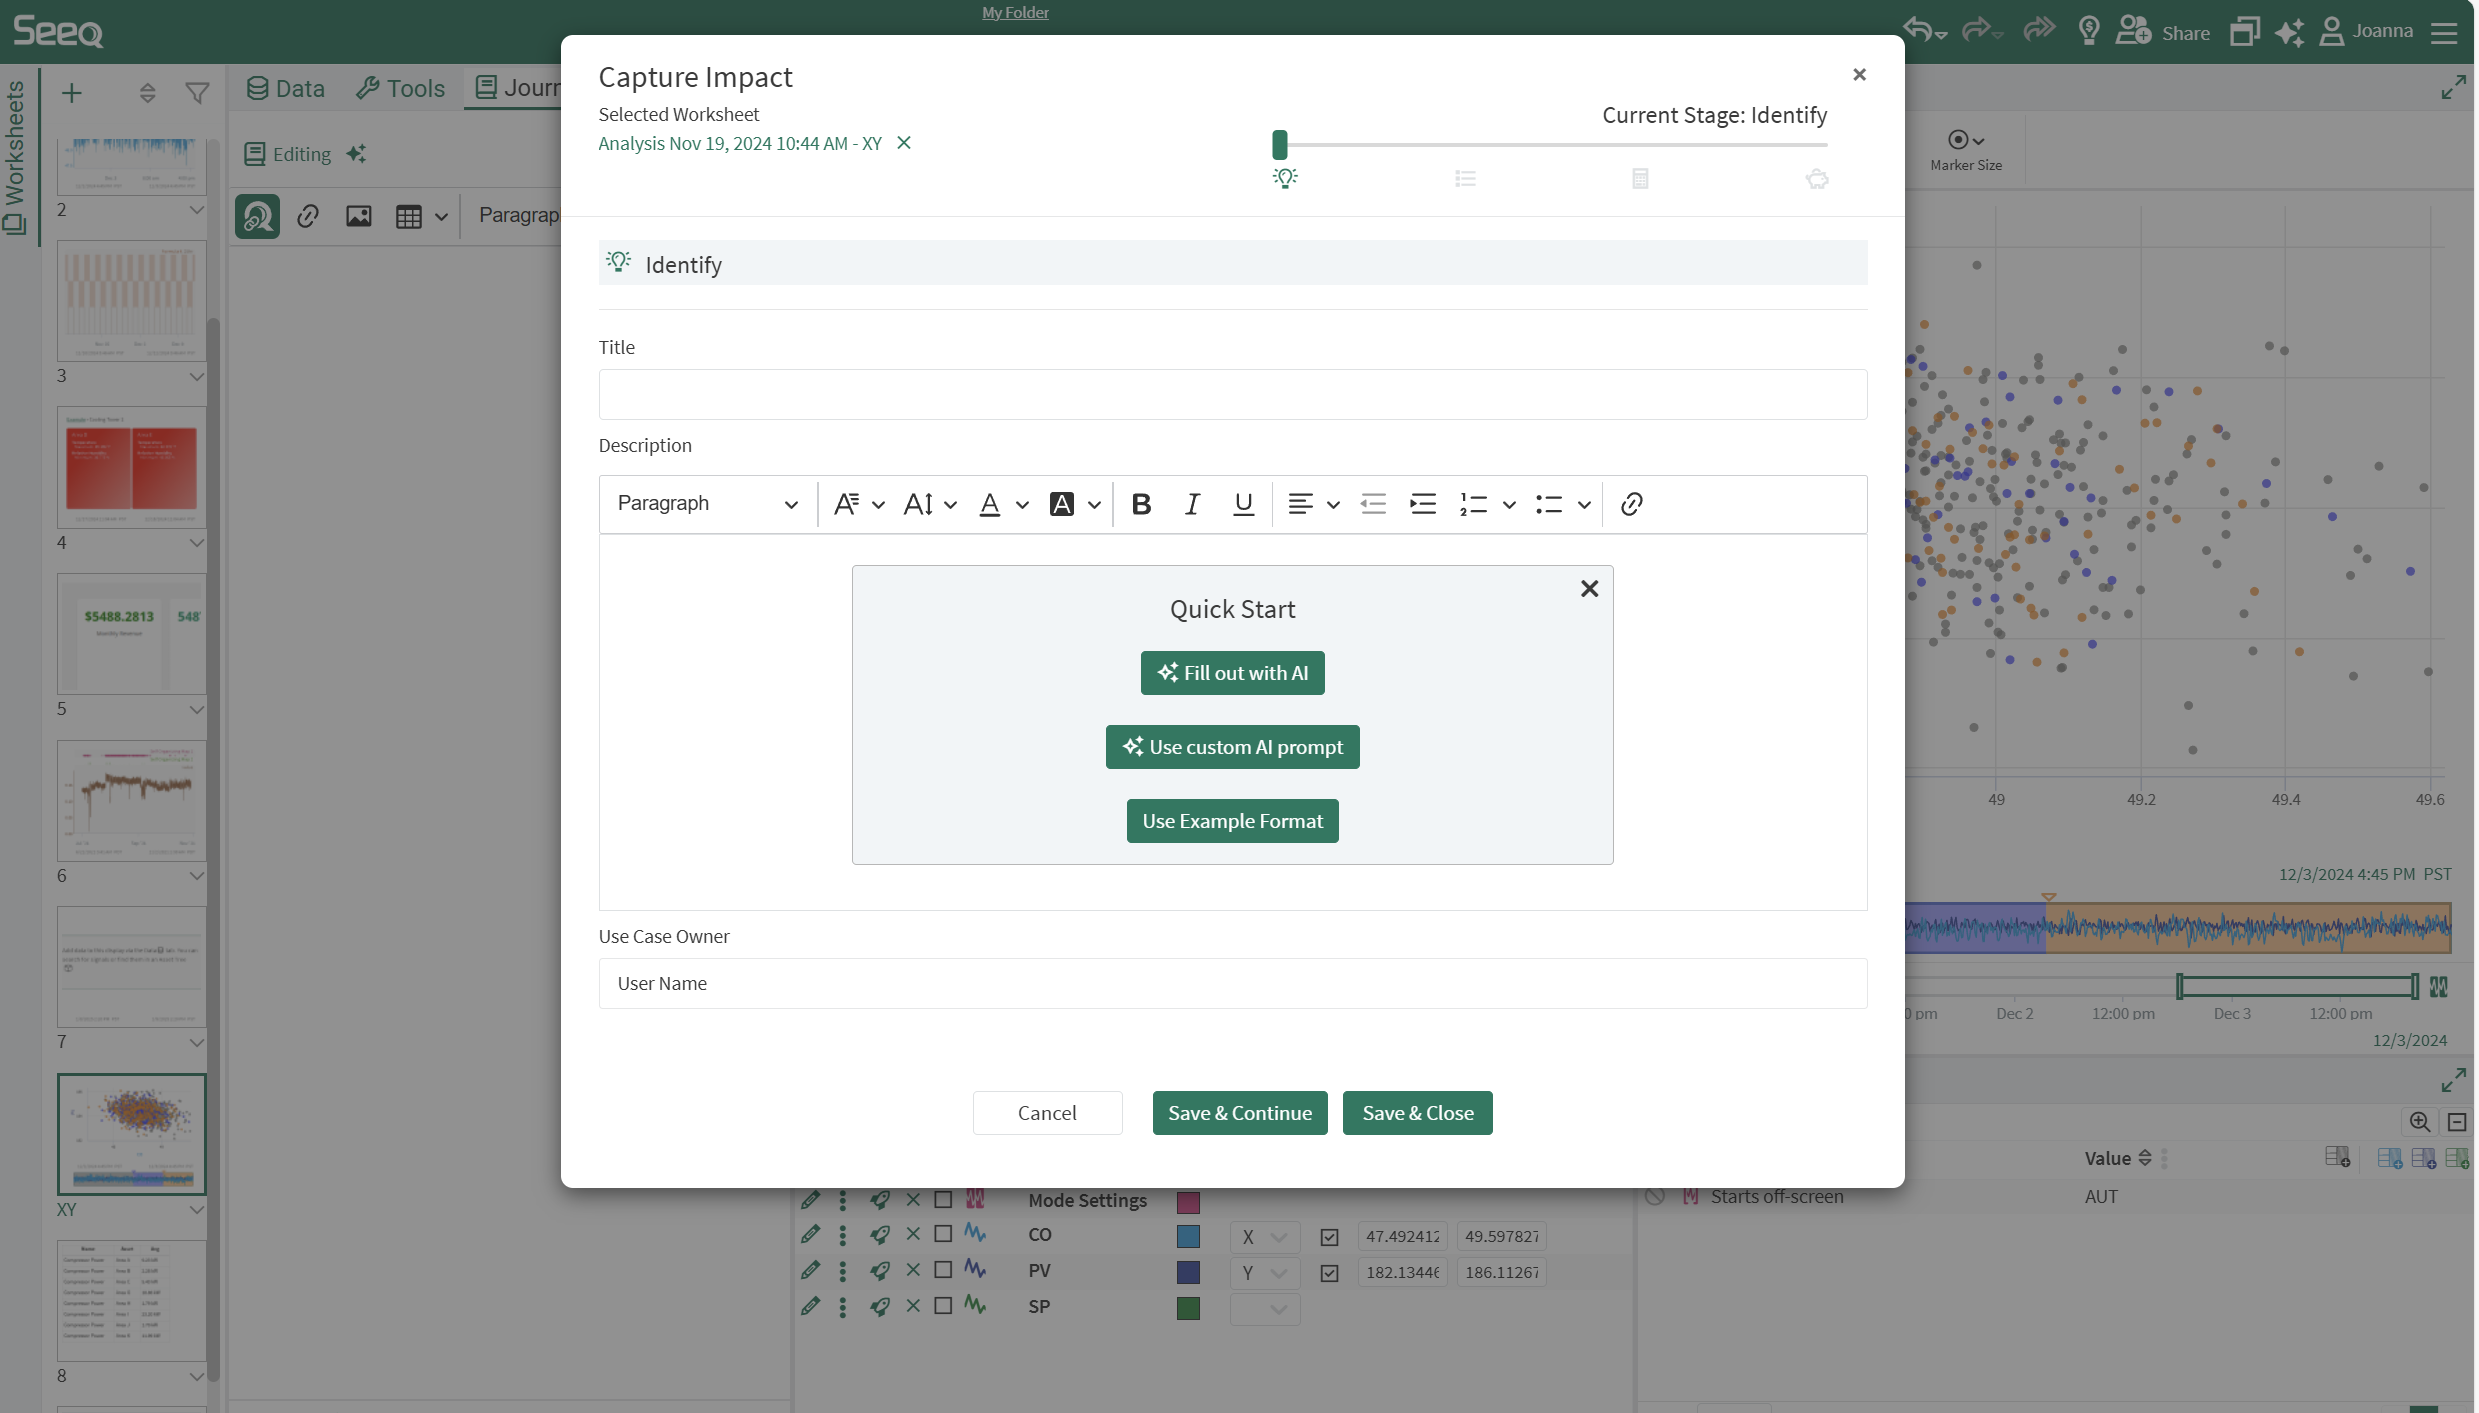
Identify
Provide a title, description, and alternatively another Owner. The user creating the Impact Report will be the default Owner, but this can be overwritten. If the AI Assistant is available to you, there will be Quick Links in the Description section. Get help from the AI Assistant to describe your analysis based on the calculations used!
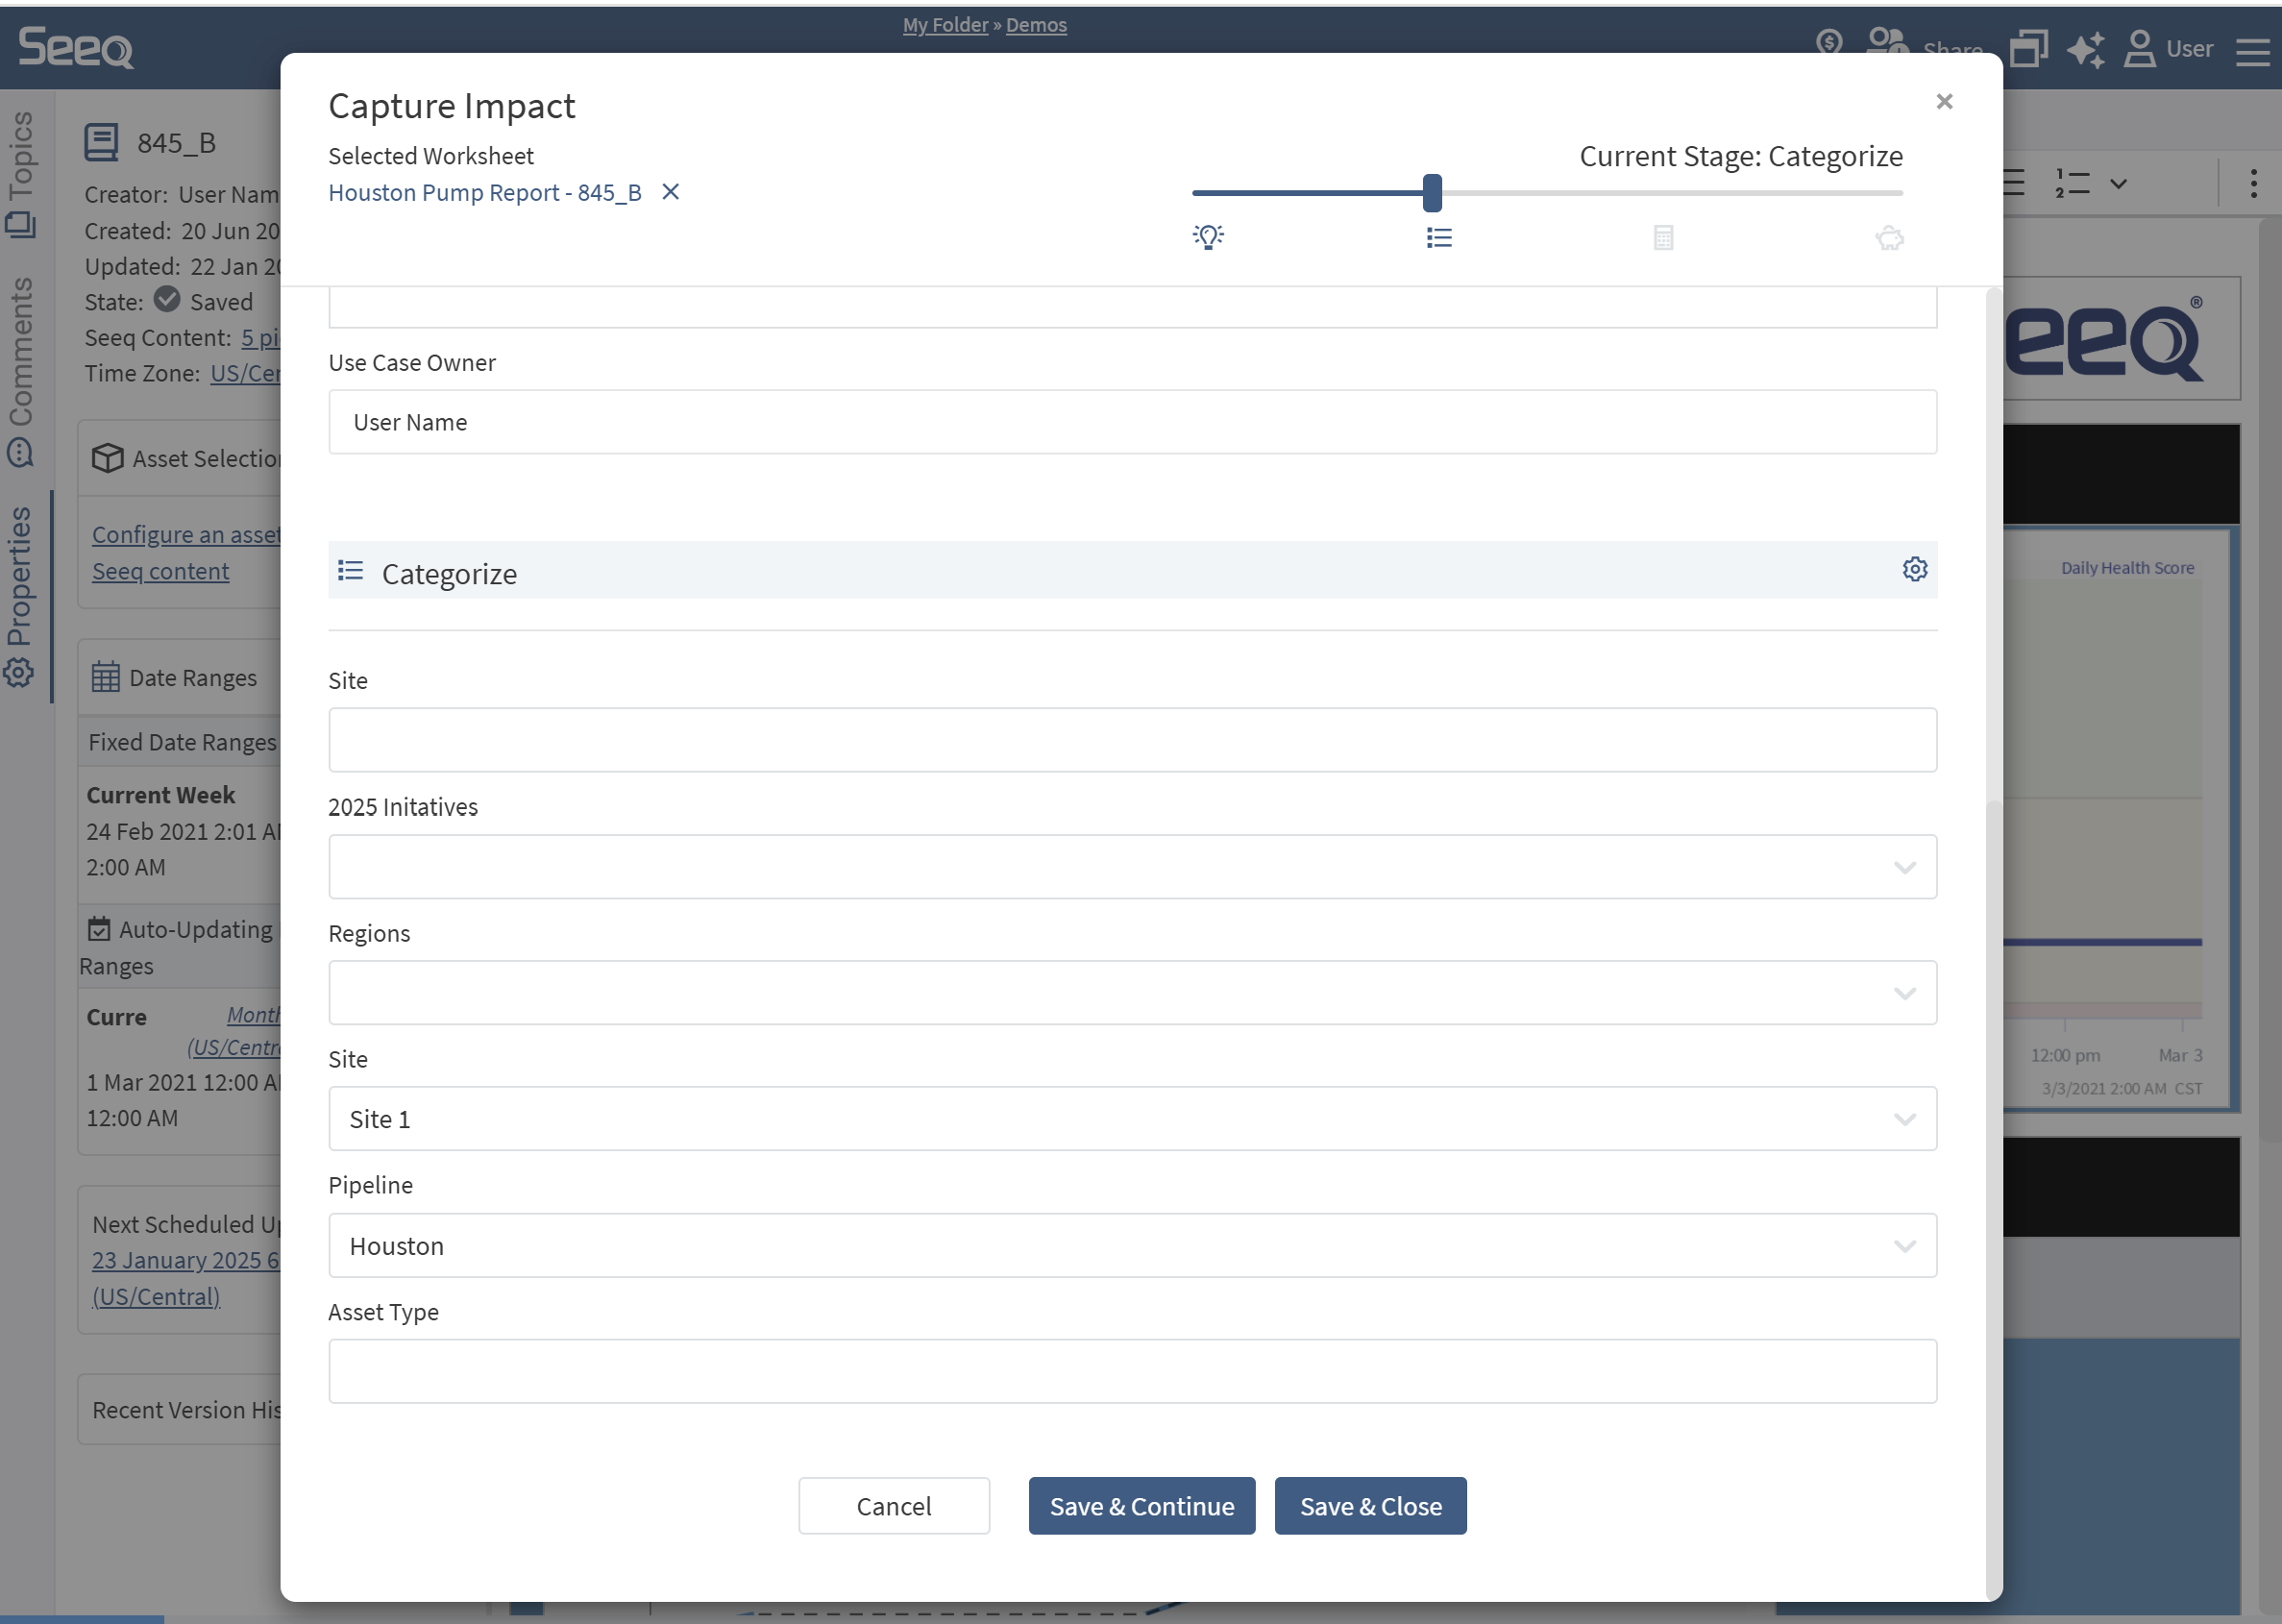
Categorize
Apply appropriate categories relevant to your company or use case. These could be things like Safety, Reliability, Quality, or different regions or asset types. Categories can be ad-hoc/free text entry or selected from a drop-down. An administrator can add appropriate categories to this section using the gear icon in the header of the Categorize section.
These categories can be used for aggregation and filtering in the view of all Impact Reports.
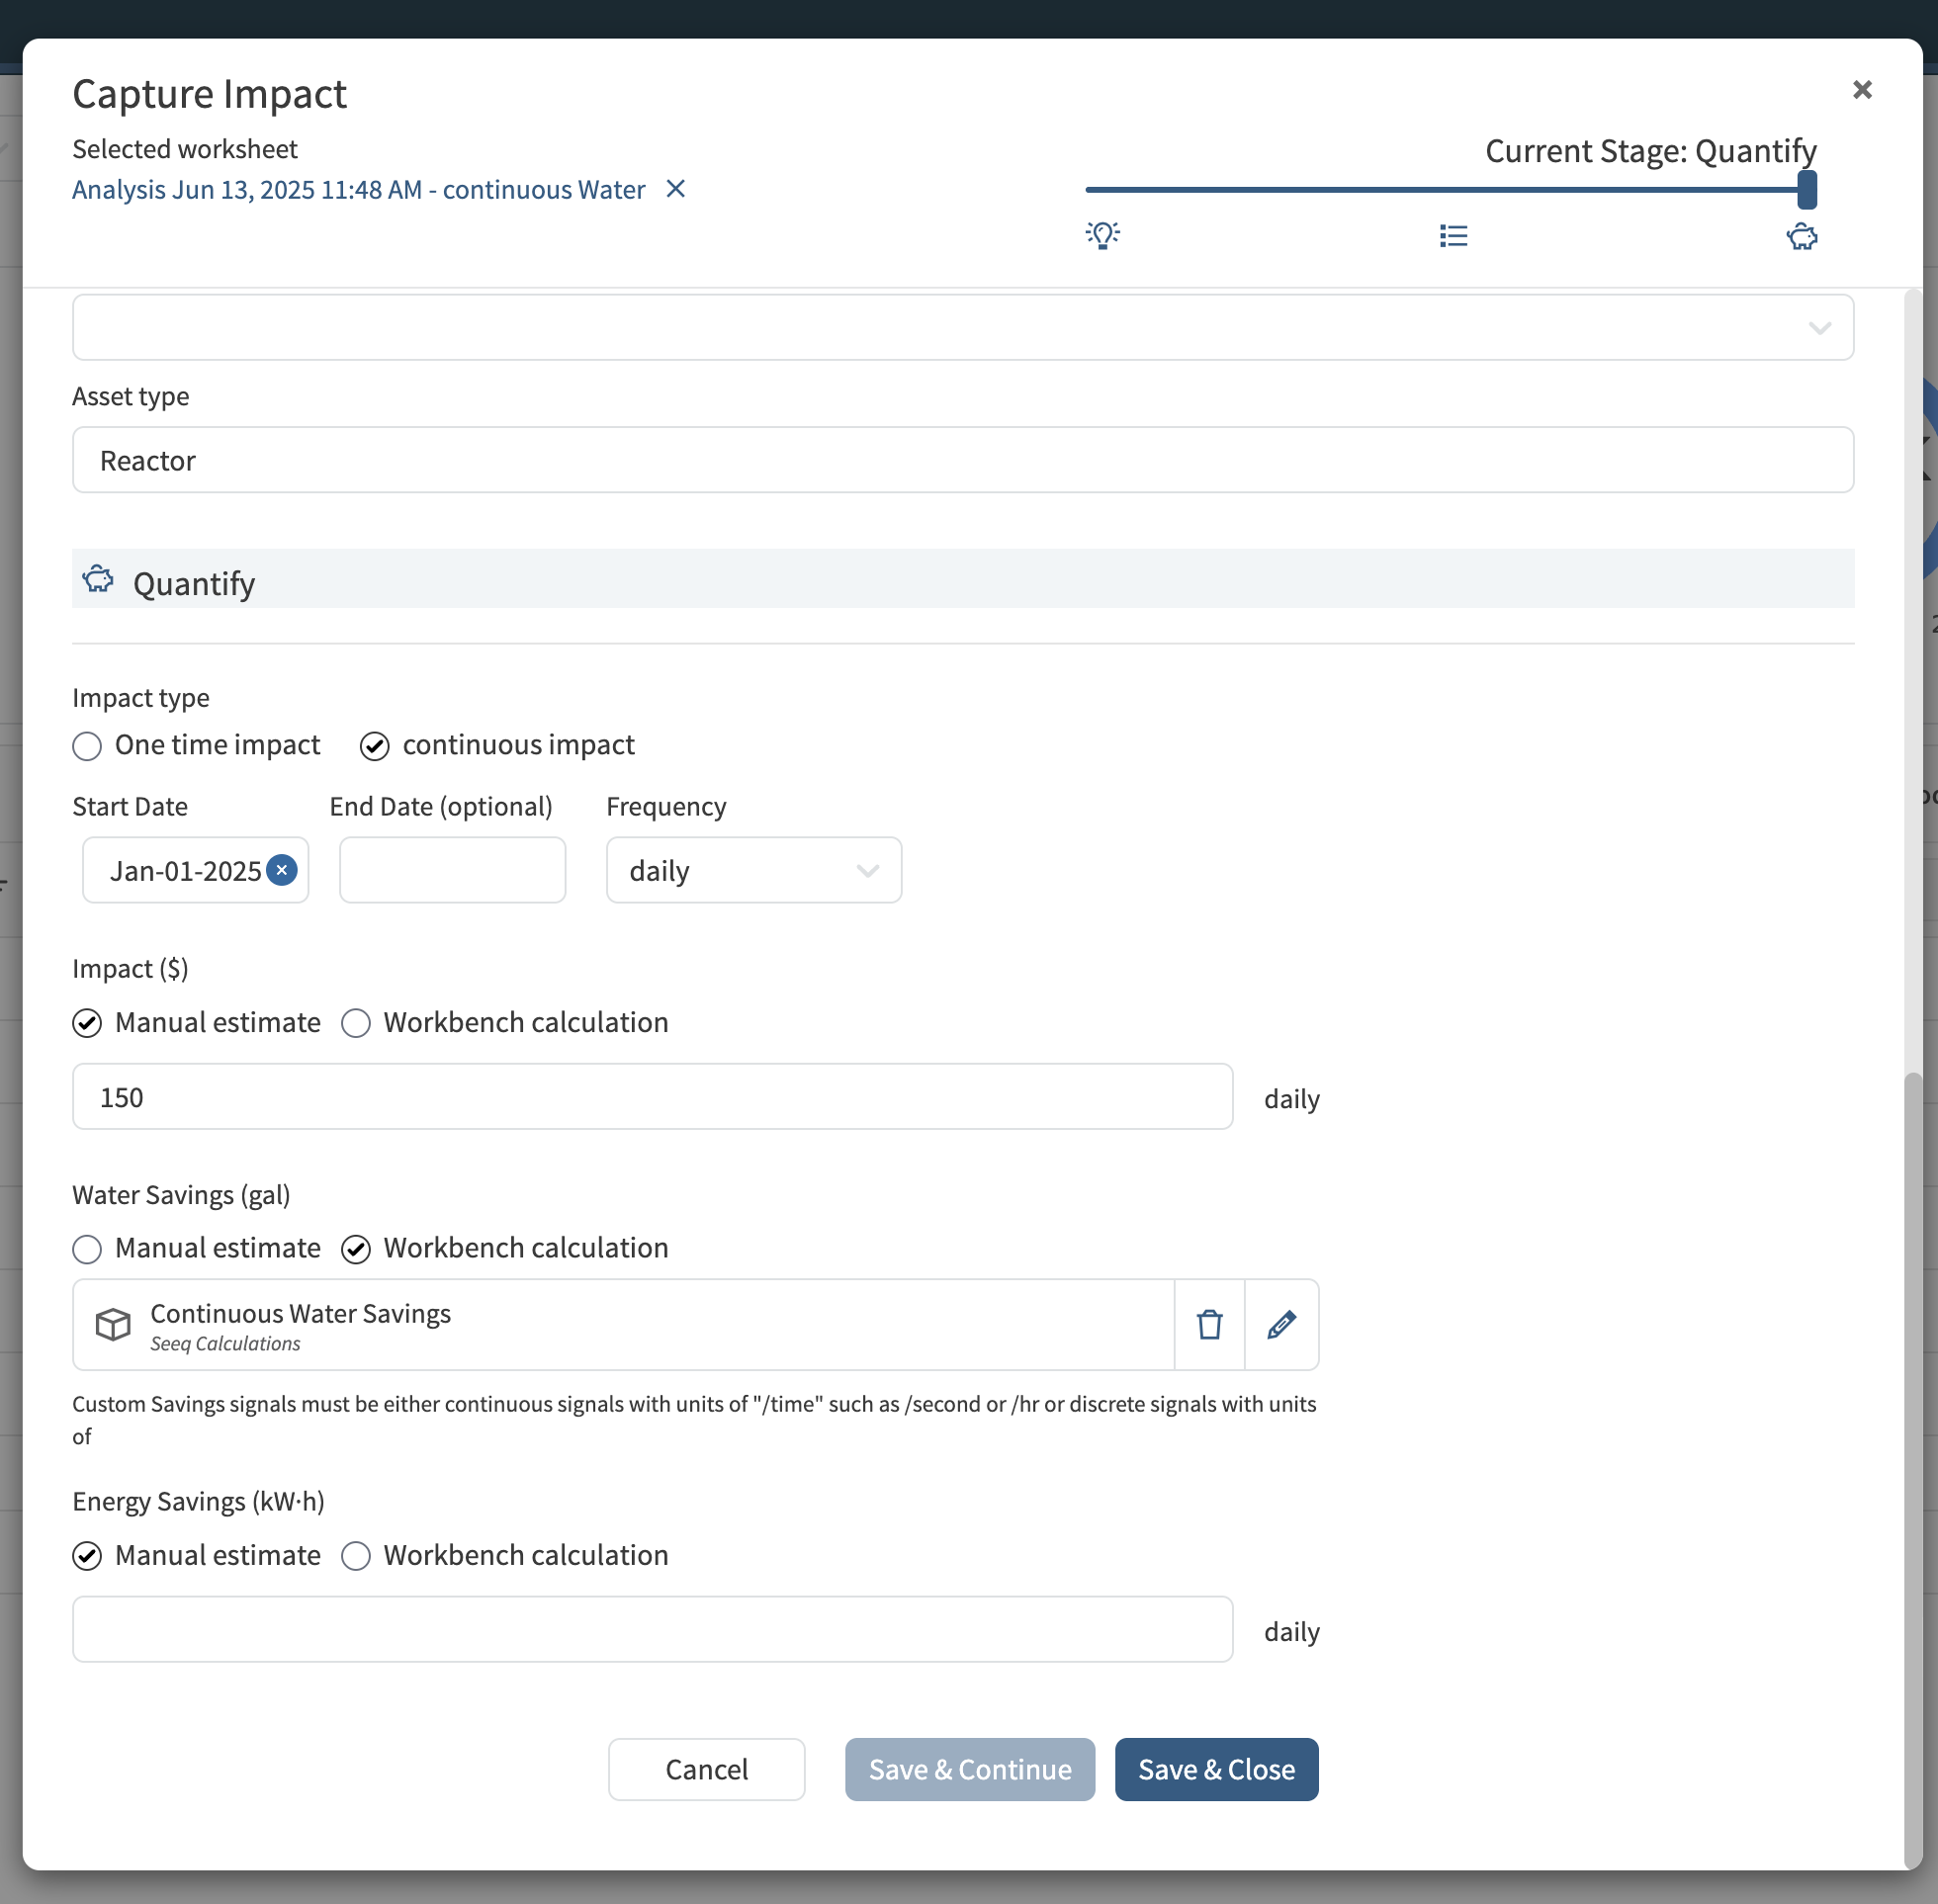
Quantify
Summarize the lessons learned in the use case and provide a rough order of magnitude impact with the dropdown and unit selector (e.g., 1,000s of gallons, 10,000s of BTUs, 100s of hours, etc.).
Use one time impact if this is a use case that results in single savings event. An example of a one time impact could be a downtime avoided by early mitigation of an identified issue.
Use continuous impact if a change was made that will result in ongoing impact into the future. Examples of continuous impact could be a change in chemical supplier or reduced target temperatures. There is an optional end date for continuous impact.
Use custom calculation if you want to calculate impact over time in a more advanced manner that takes into consideration ongoing operations. This option will let you link to a calculation in Seeq that is measuring the impact over time in the Monetize step. Some examples:
-
Energy savings may only be appropriate if the set temperature remains below a certain value.
-
Comparing waste to a baseline measurement before changes were introduced. You can use Seeq calculations to continue to measure waste on a monthly basis and compare against the baseline.
-
An improvement in yield associated with a product. The product’s value could fluctuate with the market and the value of that improved yield changes over time. If you bring the product value into Seeq this can be appropriately quantified over time.
Enter a start time and an optional end time pending the frequency of impact.
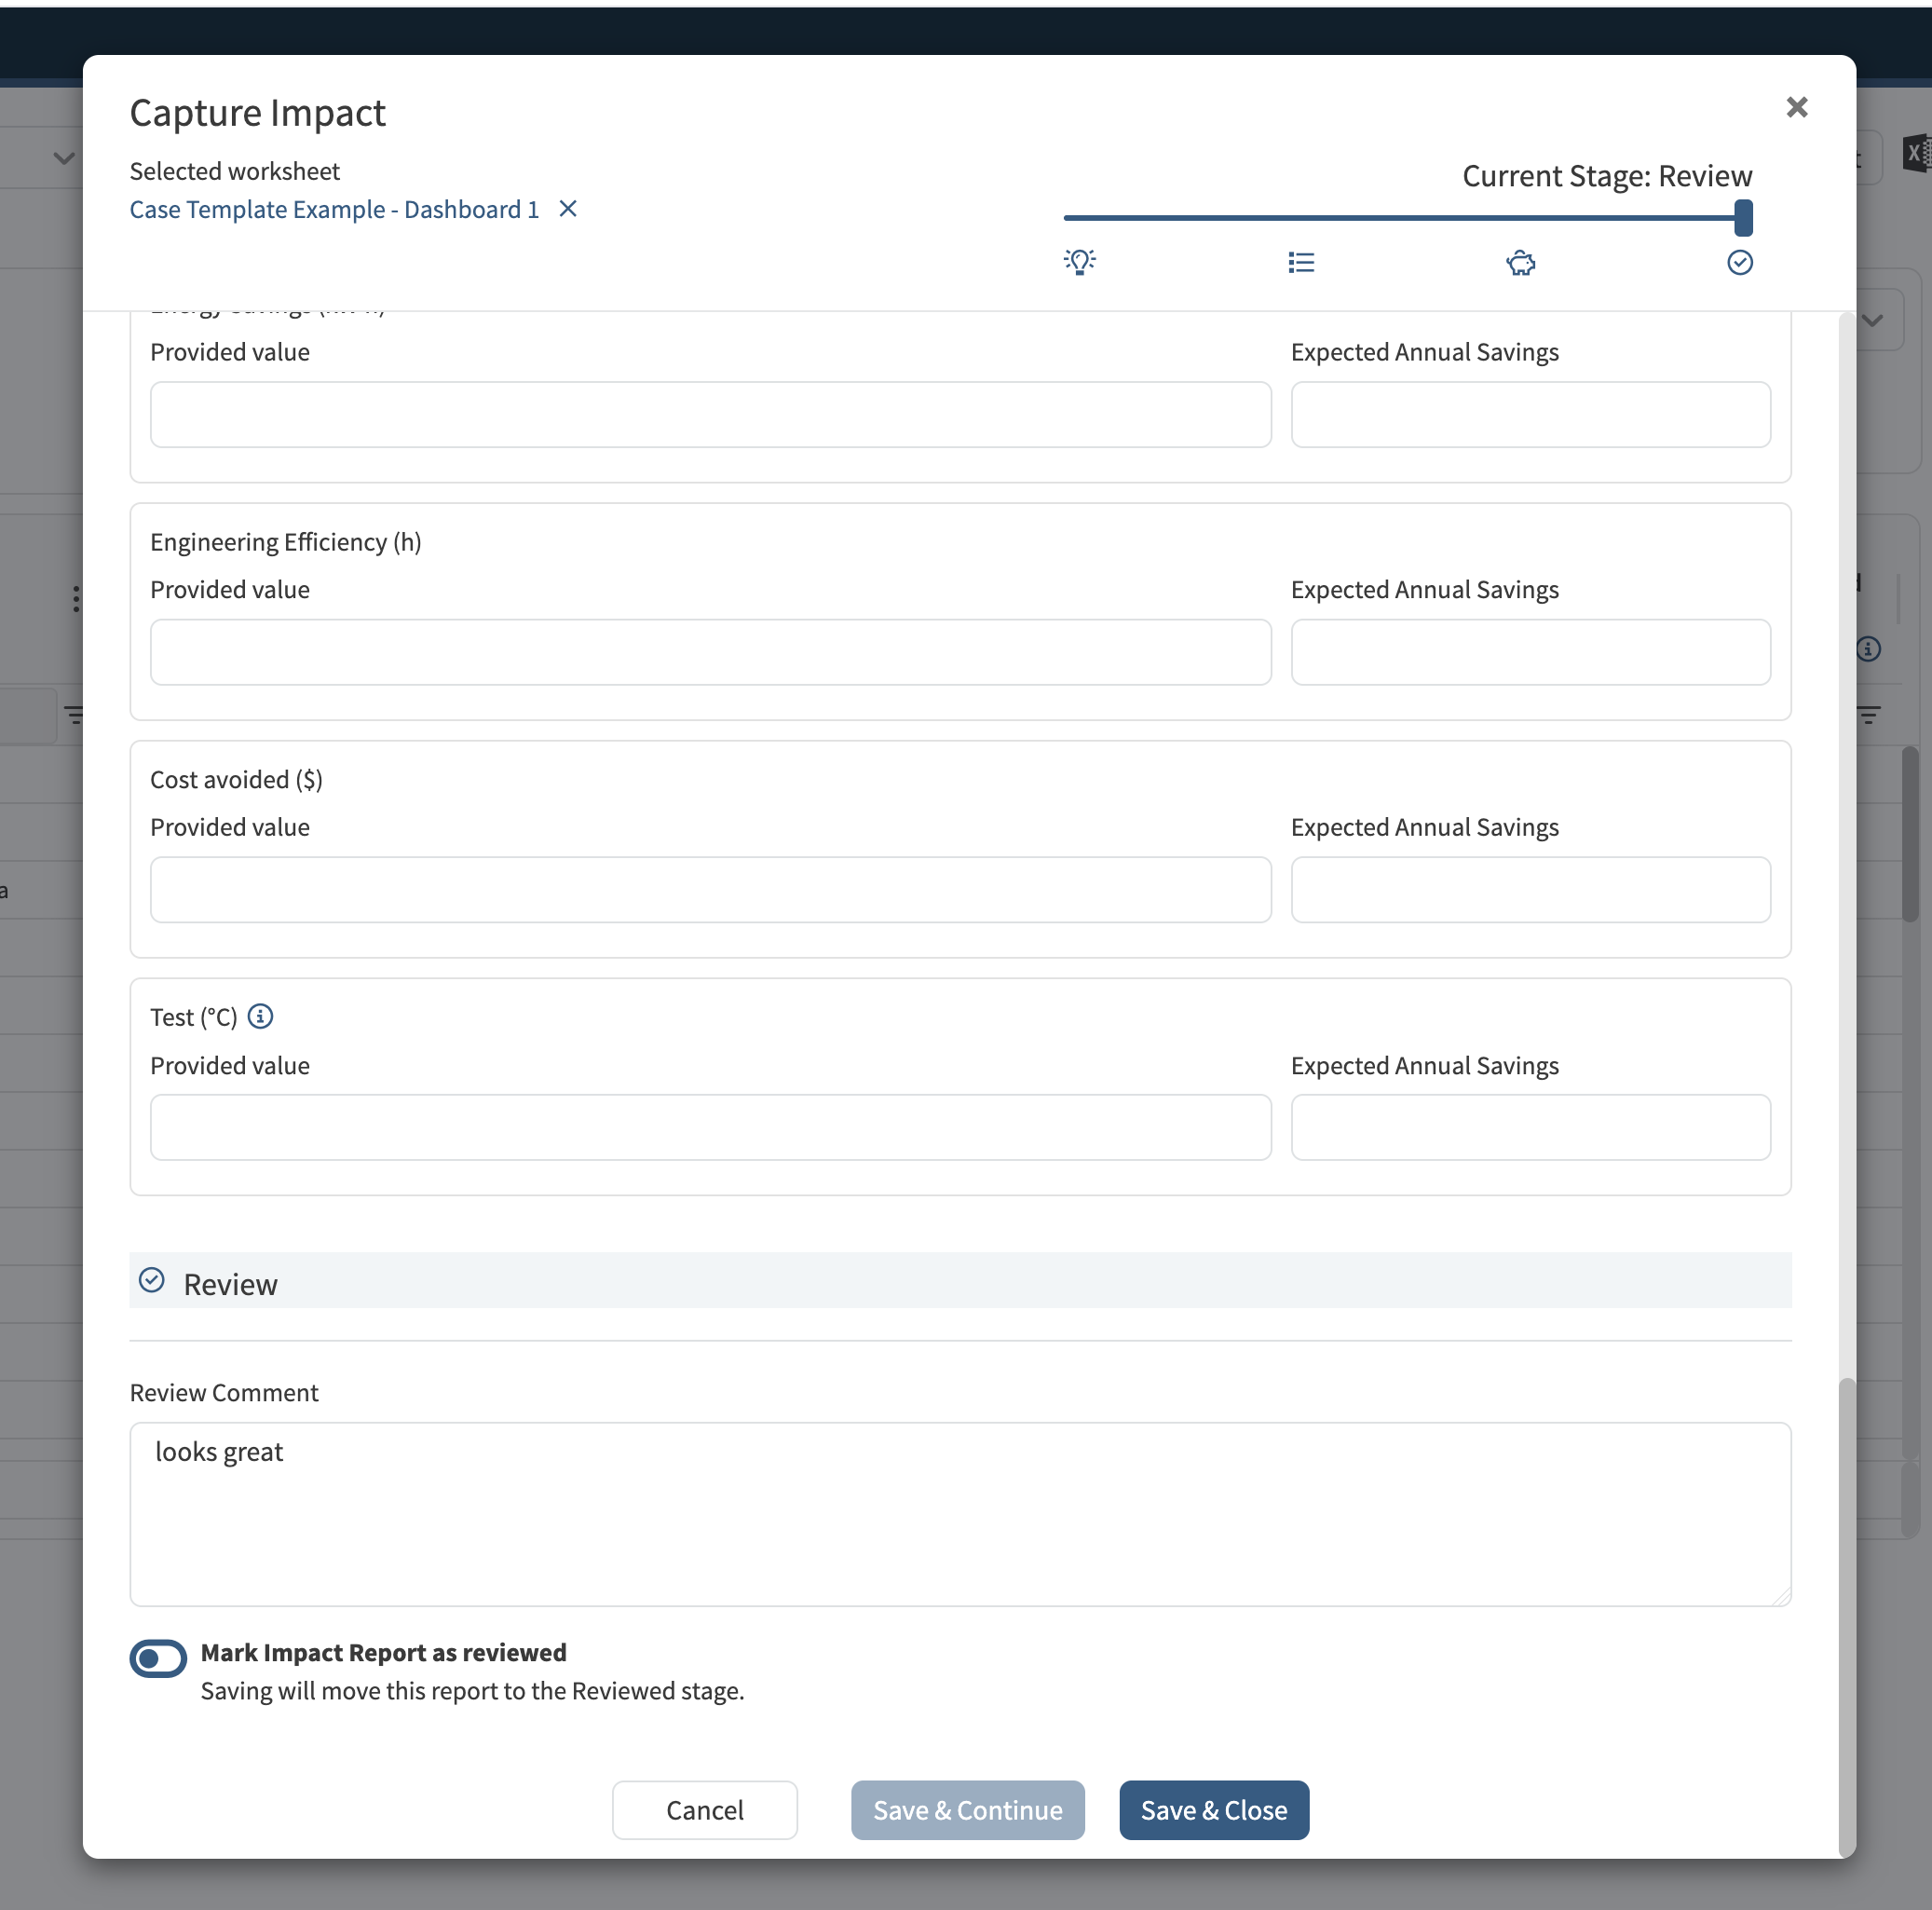
Review
The final review stage is available only to users with the Analytics Administrator capability.
This stage provides a final approval step in the Impact Report capture process. Users can add review comments during this step. When provided, these comments are displayed in the Details view for the Impact Report.
To view only reviewed Impact Reports on the Impact Reports Dashboard, use the toggle in the upper-right corner of the dashboard.
Nominate a Worksheet
This feature allows users to nominate a worksheet to be converted into an Impact Report. By nominating a worksheet, you flag it for the owner's attention, signaling that it could be valuable as an Impact Report.
Nominate
-
Users can click on "Nominate this page" from the menu.
Notify the Owner
-
The owner of the worksheet will be notified of any nominations.
-
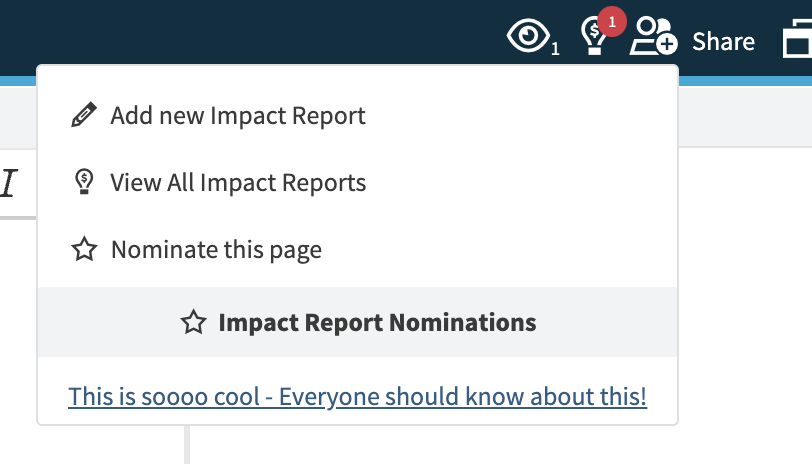
A badge will appear on the Impact Report icon, indicating that nominations have been received.

Viewing and Managing Nominations
-
Only the worksheet owner can see the list of nominations.
-
The menu will display all nominated worksheets along with their respective links.
Creating an Impact Report
-
The owner can click on a nominated worksheet link.
-
This will open the worksheet in a new tab, with the Add Impact Report Modal pre-opened for easy report creation.
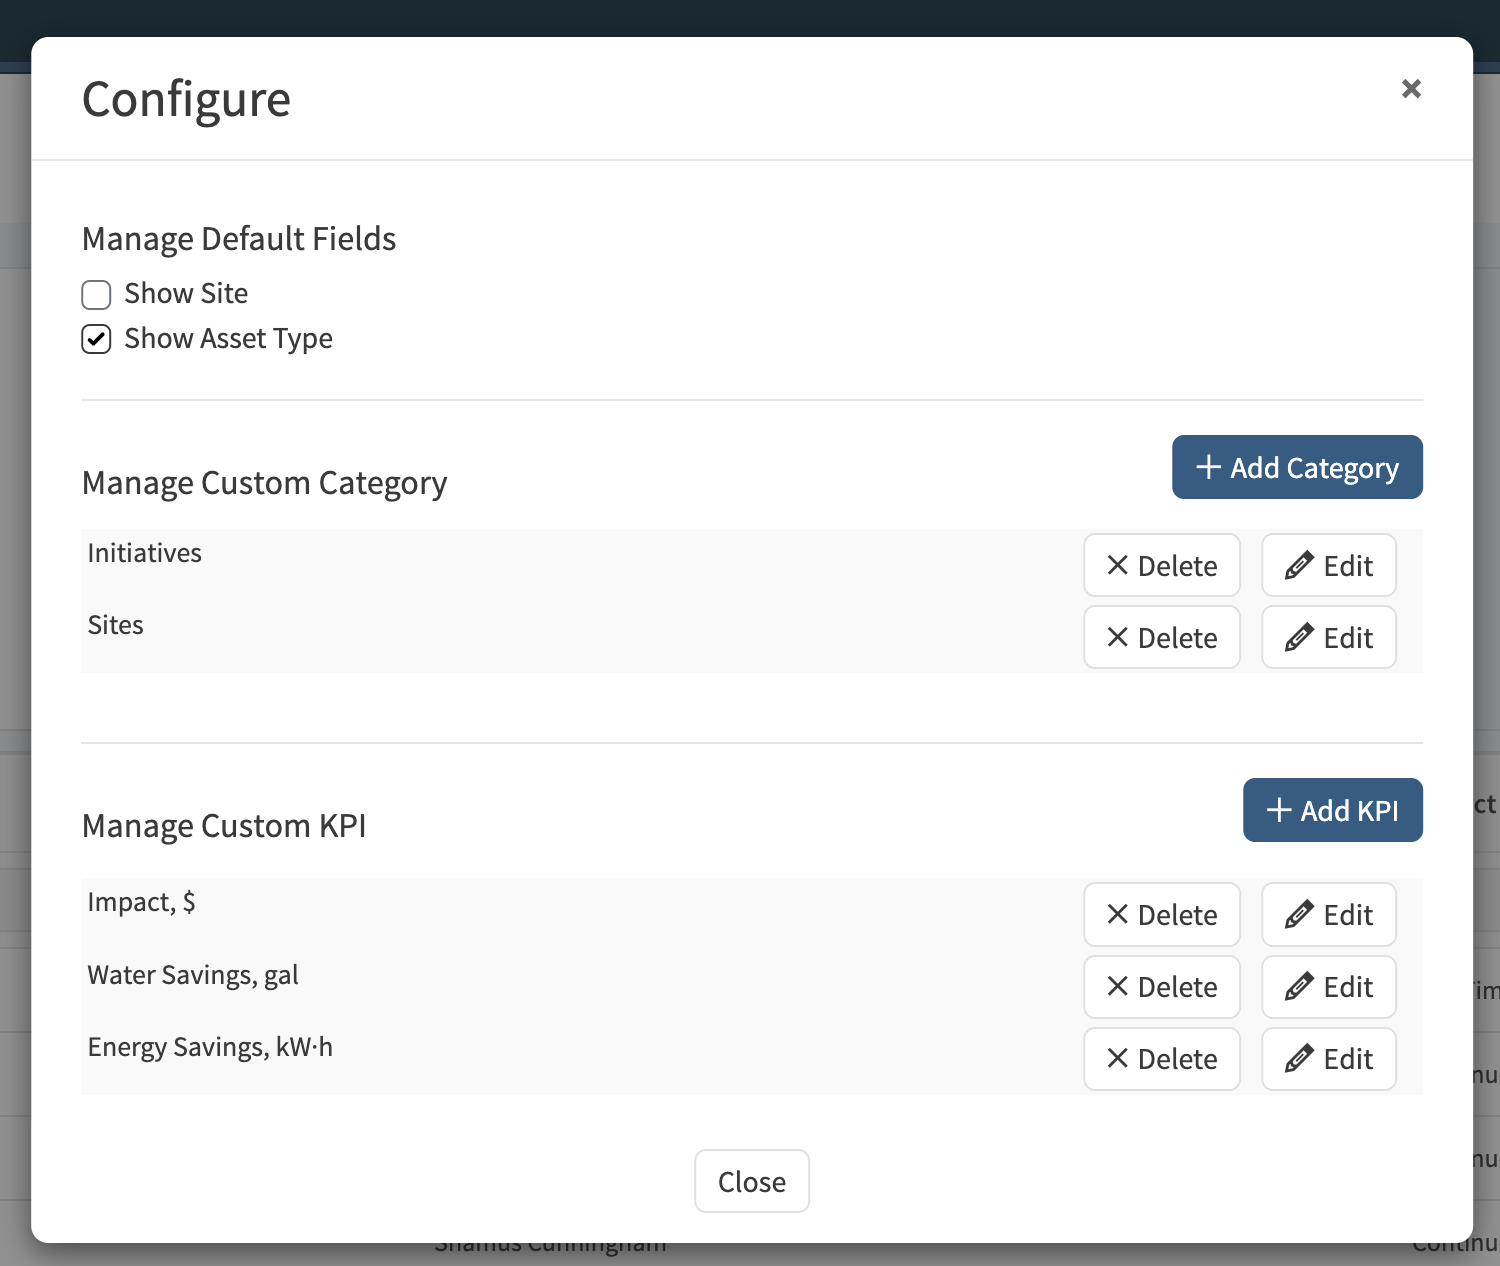
Editing Categories and custom KPIs
Server admins can add new categories, create new pick list options and edit existing options to a category. Server admins can also configure custom KPIs and manage the Impact currency.
Use categories to organize and categorize your Impact Reports; examples for categories include things like Initiatives, Sites, Teams, …
Categories are not only useful for grouping and providing additional context in the table itself but are also required for creating informative charts and visuals.
Custom KPIs allow you to capture more than just monetary Impact. How many tons of raw materials have you saved? How many hours of downtime were prevented? How much water were you able to preserve?
To showcase a broader spectrum of savings configure custom KPIs.
-
To edit/add a new category click the Settings icon in the Categorize header.
-
To hide the default categorization fields (Site and Asset Type) simply uncheck the corresponding checkbox.
-
To add a new Category click the Add Category button.
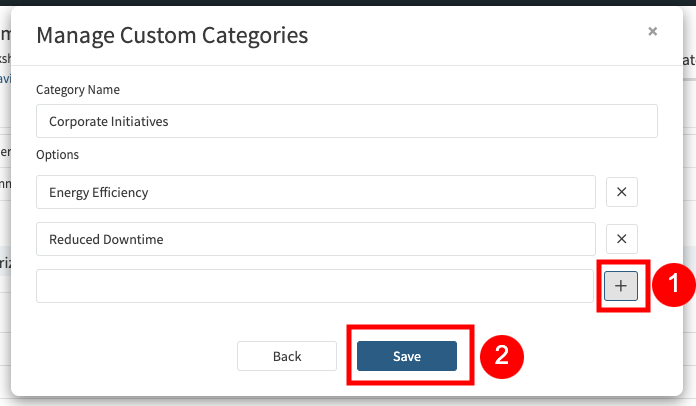
-
When creating a new category you can give it a Category Name and then click the + button to define each of the pick list options.
Option to Disable
Impact Reports can be disabled by an Analytics Admin from the Configuration tab on the Administration page. Find the Features/ImpactReports/Enabled configuration that defaults to true and change it to false. When disabled, no users can create or view Impact Reports.
Example Impact Report Pages