Analyze Data
Use Analyze Data to load data (time-series and event data) and perform analysis as part of a workflow.
When to use
You want computed results (KPIs, comparisons, anomaly summaries) before responding.
You want to prepare intermediate results that a report-writing node can use.
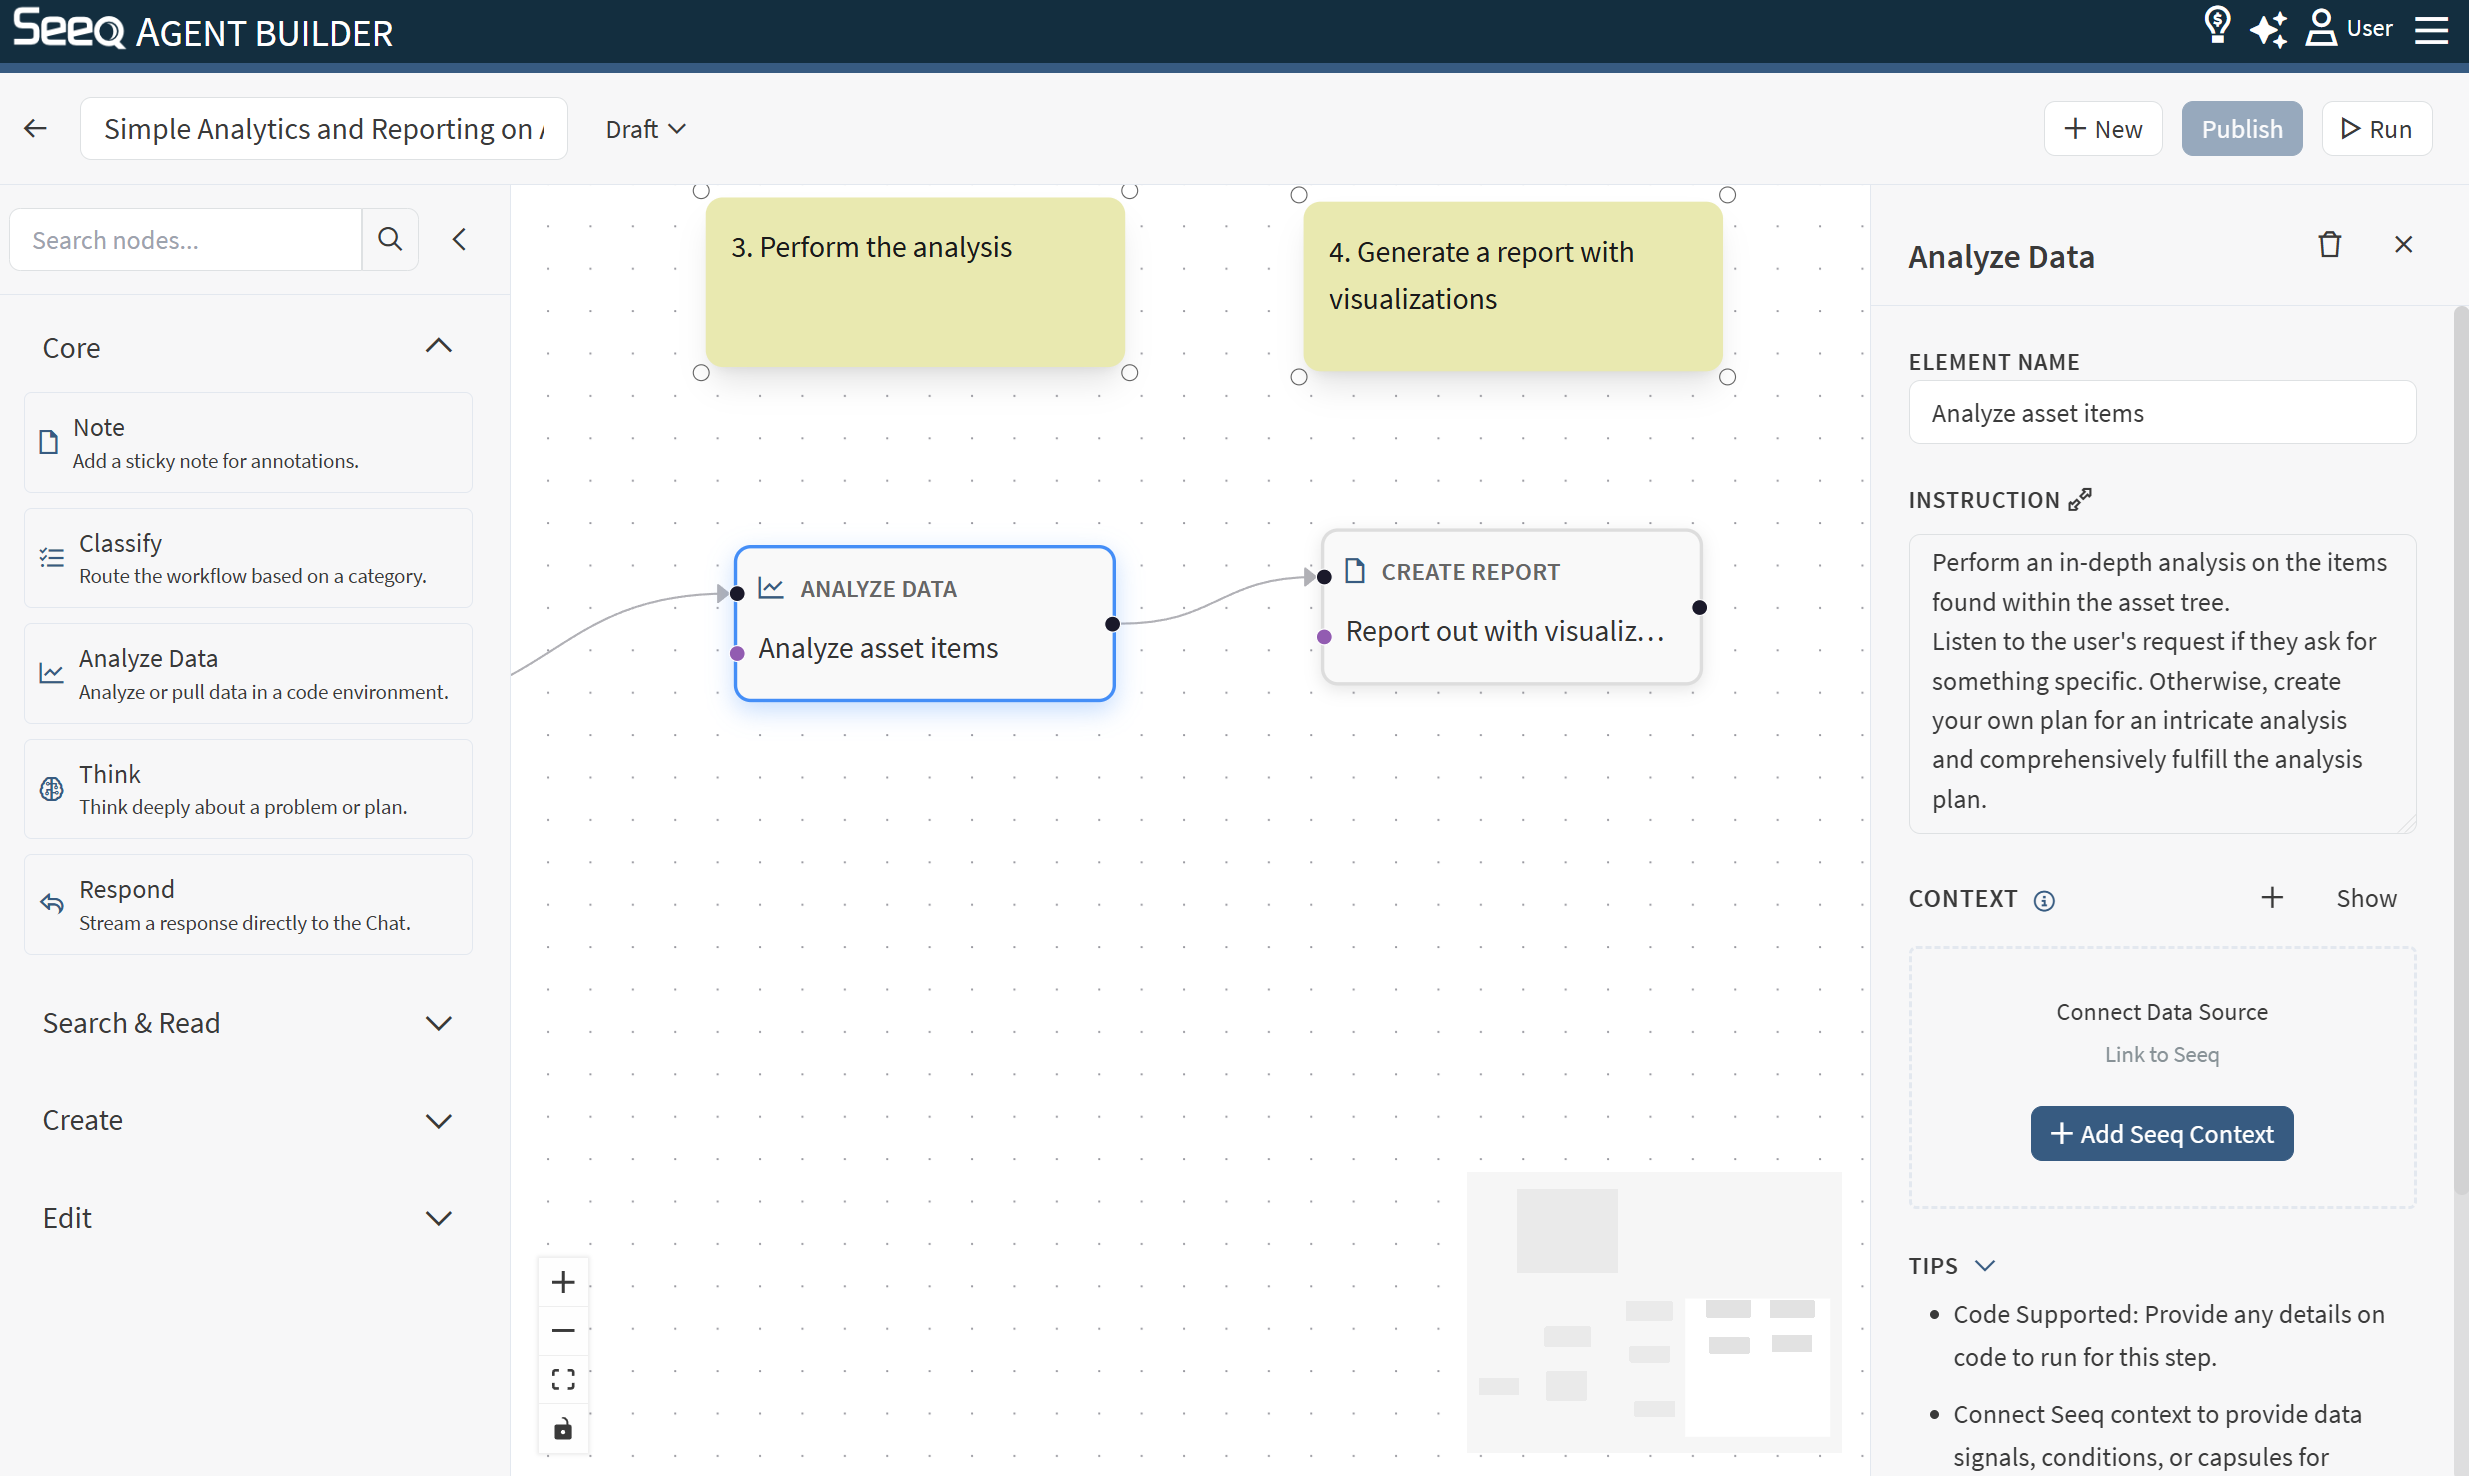
Configuration
Instruction: Describe the analysis question clearly, including:
What to measure
Time range(s) or comparison periods
Desired outputs (numbers, tables, bullet findings)
Context behavior
This node supports Seeq context and typically uses the selected workbook/worksheet scope to find relevant items and context.
See: Seeq contexts.
Output
The output is usually a concise summary of results. Downstream nodes can use it as input for reporting or decision-making.
Example instructions
“Compare average throughput in March vs April and summarize the key drivers.”
“Identify the top 5 downtime events this week and compute total downtime hours.”