Troubleshooting Performance
Overview
Poor performance can be the result of a myriad of disparate problems, and more than one cause can interact compounding the problem. The following diagram can be used as a high-level overview for thinking through the problem.
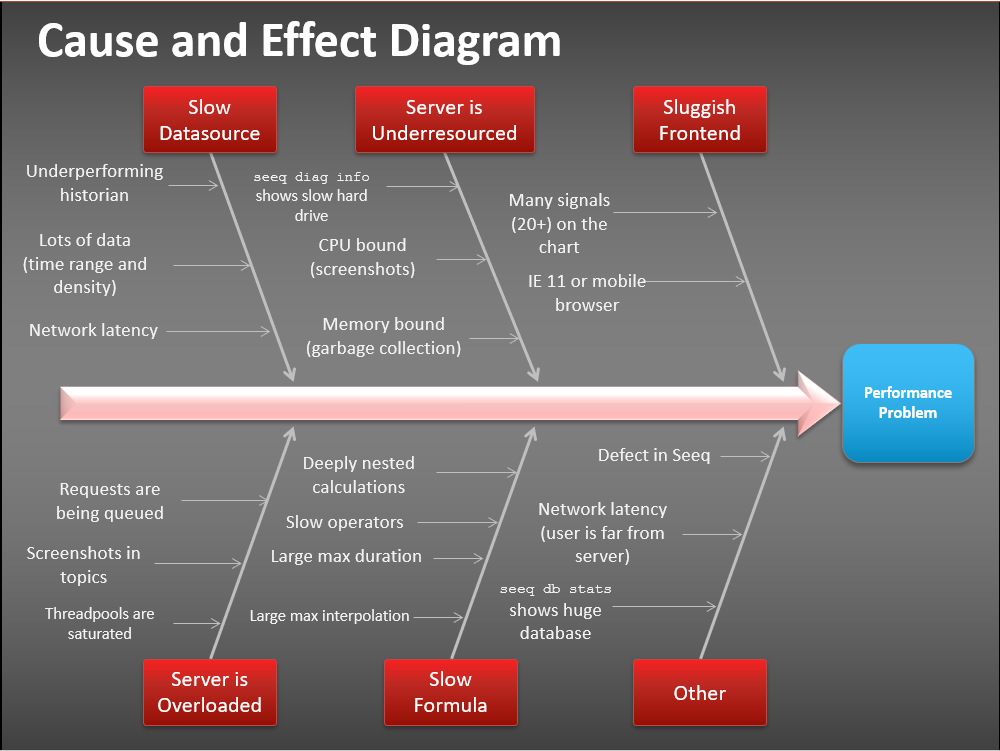
The diagram shows that there are many possible causes to performance, but many performance problems fall into the following three buckets:
Datasources that are underperforming can result in performance problems loading trend data and the content for reports. Improving performance for a datasource often depends on the particular historian, such as adding an index to a SQL database, but it may mean adding more compute resources to it as well.
The Seeq server becomes a bottleneck. Usually it is memory that is a constraining factor because the more samples that need to be processed the more that can be done if they are in memory. However, if many reports are being generated the headless browser processes that generate the Content images will use both CPU and memory.
As seen in the diagram server overload can often be from screenshots in topics. For a topic the number of content images in it and the amount of signals/conditions/formulas on each of those pieces of content are the key factors that make a report more resource-intensive to produce.
Administration Page
Requests Tab
The requests tab lists all API requests that are currently being processed. Sorting by Duration can be a quick way to find requests that have been running for a long time. Seeq administrators can navigate to the Administration page by using the hamburger menu icon in the top right and then clicking the Requests tab. One or more requests can be canceled from this tab by selecting them and clicking the Cancel Selected Request(s) link. This list of requests includes the following fields:
Username - The user that initiated the request. Requests by the system user are for creating screenshots for Topics. Requests by the api_agent_key are from one of the remote agents.
Method - The HTTP method of the request.
URI - Indicates the API endpoint that is being run.
Duration - How long the request has been running, in seconds. If a request has been running more than 5 minutes, it may warrant further investigation.
Threads - How many CPU threads are being used to process the request. Higher numbers means the request is being parallelized.
Progress - An estimate of how much of the request has been completed.
 button - Clicking on the button in the request row will show additional details, such as the name of the formula and the date range being computed.
The timers and meters field can be especially useful in diagnosing a long-running request. The timers shows how much time the request has spent in various buckets, such as fetching data from a datasource or the cache. The metrics shows can give some context to the timing numbers by showing how many samples have been fetched thus far. A few examples:
A request that has spent 60 seconds in the Datasource bucket but only fetched 200,000 samples that may indicate a poor performing datasource.
A request with a majority of time spent in GC (Garbage Collection) could indicate memory is a constraint.
A request with a large amount of time in Processing could indicate a compute-intensive formula.
Request ID Format
All requests have a unique ID associated with them that looks like this: "R^rfaHyFfbTkeDKUZl3LUnXg". In most instances, this is the entire request ID. Whenever there is a screenshot of a worksheet on a document, the request ID will be prefixed. There are two possible prefixes:
ScreenshotCapture^ - This indicate a request that was made to generate the information within a screenshot. A screenshot may make multiple requests and this prefix will be shared among all of those requests. An example request ID with this prefix would be ScreenshotCapture^02lk3CVbo2G2slVdXzKzcA*R^LE0gt5QKpla0cmKz6HFs0
ScreenshotCapture^(randomId)*Invocation^ - This indicates a request made by a screenshot which was set to auto-update. The screenshot capture section refers to the individual screenshot, and the invocation refers to an instance of that screenshot. For example, if the screenshot was set to update every 5 minutes, every 5 minutes a new set of requests would be made with the same ScreenshotCapture ID, but different Invocation IDs. An example request ID with this prefix would be ScreenshotCapture^ZTdiMDY2MDY2NWIxNDhkODdiNTFlZDdkYWJhODFmMjg=*Invocation^8ncoCowwSLyAISzFY2JQIA*R^r3ronTNkYPTVWa96rk6YOw
Jobs Tab
The jobs tab lists all screenshot jobs that are currently scheduled. Screenshot jobs that take a long time to complete and are scheduled to run frequently can cause performance issues. Seeq administrators can navigate to the Administration page by using the hamburger menu icon in the top right and then clicking the Jobs tab. One or more jobs can be stopped from this tab and clicking the Stop Selected Job(s) link. The list of jobs includes the following fields:
Id - A unique identifier for the job
Last Duration - How long it took to complete the screenshot. A value of NaN indicates that the first screenshot has not yet been taken. If a large number of jobs stay in the NaN state it can indicate that the screenshot system is overwhelmed.
Previous Run Time - The time at which the job previously ran.
Next Run Time - The time the job is next scheduled to run.
- button- Clicking on the button in the job's row will show additional details:
channelId - This is the communication channel that is listening for the screenshot results. Clicking on the channel link and expanding the
button for the channel allows you to see which users have the Topic open.period - This tells how frequently the screenshot will be taken.
Reports Tab
The reports admin can help answer questions about how the load that reports add to the system. It can be used to answer such as “which reports are taking longest to finish?”, “which reports have large numbers of content images?”, and “are there reports that are running too frequently?”.
Report Schedules shows when a scheduled report will run and how often. It can be used to spread the running of reports throughout the day so that they don’t all run at once.
Total Run Time shows how long it took to generate all the content in the report. Sorting by this field can show the most resource-intensive reports.
Time Since Viewed shows when the report was last viewed. If a report is being generated but not used it may be a candidate for being disabled.
Subscriptions Tab
Seeq uses a communication model called pub-sub (publish and subscribe) for pushing out live updates to users that are logged into the system. For example, if two users are working on the same worksheet all changes will be published to the inactive user via a dedicated channel. The subscriptions tab lists all the communication channels and which users are subscribed to them. This tab can be useful for seeing things such as which users are logged into the system, which users or working on a workbook, or who is looking at a certain Live Doc. For example:
broadcast channel. All users are automatically subscribed to this channel. By clicking on the
icon next to this channel you can see all users with logged into Seeq.live-screenshot channels. Every live doc gets a unique live-screenshot channel. As mentioned in the help for the "Jobs Tab" you can click on the channelId for a screenshot job and it will take you to this tab where you will be able to see which users are looking at the Live Doc.
Seeq Workbench
Rocket Icon
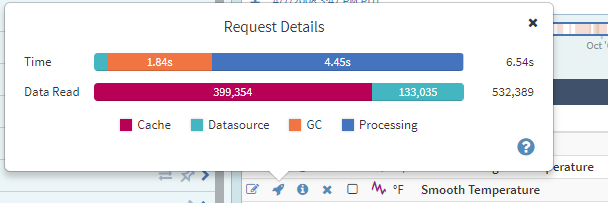
There is a "rocket" icon to the left of any signal or condition in the Details pane of Seeq Workbench. When clicked, this icon will produce the Request Details pop-up, which shows you the amount of data being read from any applicable datasources and the amount of time spent in various stages of computation:
Datasource - The amount of time and quantity of data being read from a connected datasource like OSIsoft PI or Honeywell PHD. This measurement can potentially be improved by more aggressive "caching." (See below.)
Processing - The amount of time spent in Seeq Server's calculation engine processing the data, applying any specified calculations, and downsampling for display in the browser. This measurement is typically improved by adding RAM and CPU to your Seeq Server.
Cache - The amount of time and quantity of data being read from Seeq's memory or disk-based "caching" mechanism. (See below.)
GC - The amount of time spent recovering used memory from one computation to the next. ("GC" stands for garbage collection.)
Seeq's cache is a temporary store of data (retrieved from connected datasources) on Seeq Server that is either in RAM (in-memory) or on an attached storage device (disk-based). Reading from the cache is almost always significantly faster than querying the datasource.
Thread Pool Usage Pop-Up
A pop-up that includes all of Seeq’s thread pools and their current state is available for administrators in the bottom right-hand corner of Seeq Workbench.
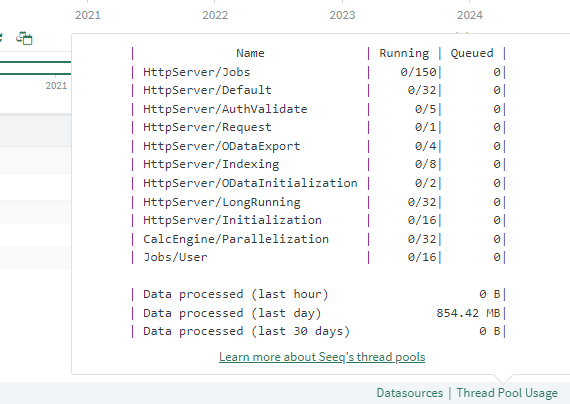
Seeq balances work, such as fetching data, processing data, creating Seeq Content images for Topics, etc. into "pools" of worker threads. Each pool is sized differently and is scaled relative to its needs. When all worker threads for a pool are in use then any additional requests for that pool get queued. The pools are:
HttpServer/Jobs: Used to invoke jobs that generate the Seeq Content images in Topics any time they get generated, such as when changing the Date Range of a Topic. If this is backed up content in reports will take longer to load.
HttpServer/Default: Serves most HTTP requests. If this gets backed up Seeq will feel sluggish because requests that should return quickly and getting queued. While it is expected that some pools, such as Jobs and LongRunning, will fill up during times of heavy usage it is expected that this one always remains low.
HttpServer/AuthValidate: Deals with requests to the endpoint responsible for validating auth and CSRF tokens.
HttpServer/Request: Holds the tasks that are related to observing and cancelling HTTP requests. These requests are fast and are critical to ensure that abandoned requests are cancelled.
HttpServer/ODataExport: Processes OData data set requests. Request registering and metadata documents are handled by the HttpServer/ODataInitialization thread pool.
HttpServer/Indexing: Handles all metadata sync related requests, such as writing signals or conditions or archiving stale items.
HttpServer/ODataInitialization: Registers OData requests and handles OData metadata documents. Actual OData processing is done by the HttpServer/ODataExport thread pool.
HttpServer/LongRunning: Used for API requests that are expected to take a long time to finish, i.e. fetching data for signals or running formulas that generate signals, conditions, and scalars. If this is backed up trend data and topic content will take longer to load.
Jobs/User: Serves requests that fire off jobs related to user needs, such as updating a live screenshot in an Organizer Topic. These are the threads that actually fetch the image content, whereas threads in HttpServer/Jobs invoke the threads in this pool.
Log Files
Log files can have a lot of noise, but they can also be useful. The following files are helpful for performance troubleshooting:
appserver-requests.log - Every five seconds this logs any requests that are taking longer than 5 seconds. Additionally, it logs the full formula hierarchy for long-running requests. This can be very useful for seeing if a formula is deeply nested, has a large max interpolation, etc.
jvm-link.log and net-link.log - All datasource requests will be logged in one of these. It can show how long an individual request for samples took and how many samples were returned during that time.