Troubleshooting a Datasource Connection
Overview
Understanding the health of a datasource connection is critical to ensuring the smooth operation of Seeq. This guide will explain the various steps that can be taken to troubleshoot a datasource connection. Most Seeq connectors will execute a monitoring query every five seconds to determine the health of the connection. Seeq uses this monitor's result to determine the connection's health.
Identifying an Issue
The fastest way to identify an issue with a connection is to navigate to the Datasources tab within the administration page.
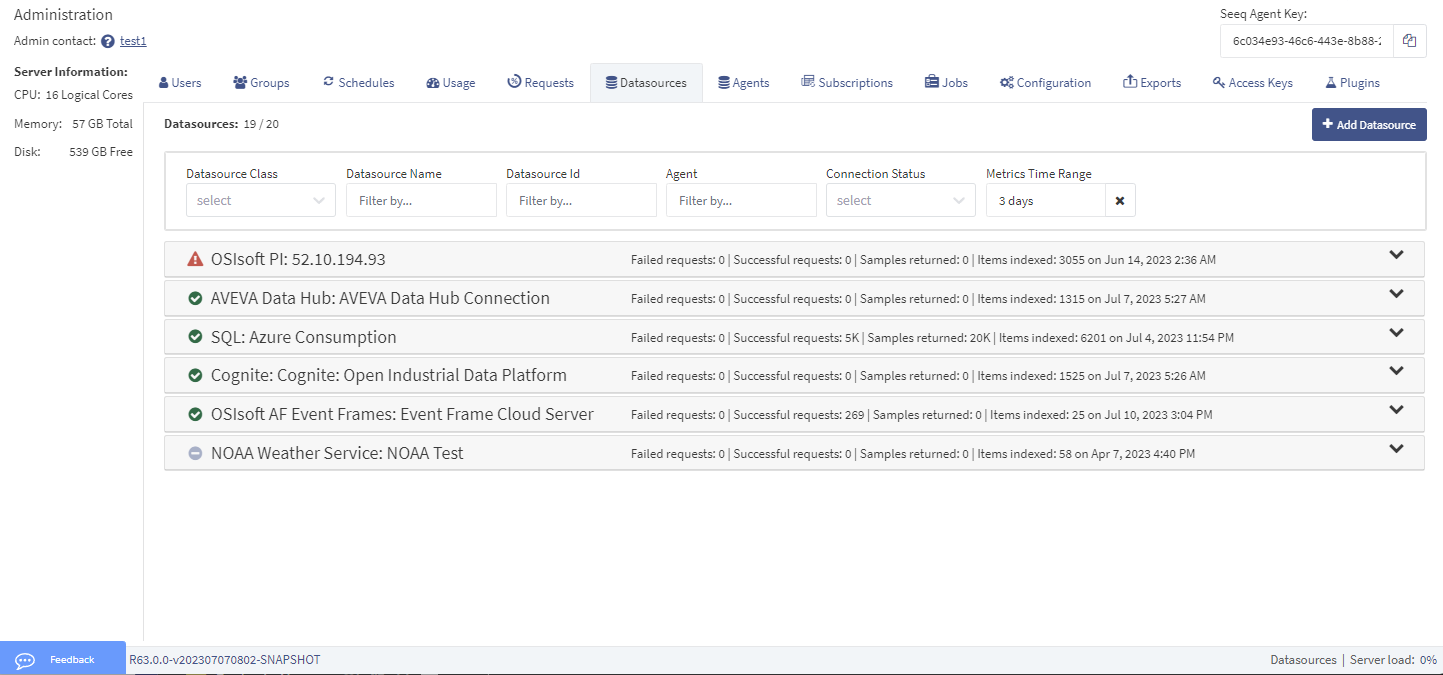
Each datasource will have an icon that provides the current state.
 | The connection is operating normally and monitor checks are returning a healthy status. |
 | The connection is currently connecting. |
 | The connection has been disabled. In this state, no users will be able to access data from this datasource, and the connector will not attempt to connect to the datasource. |
 | The connection is pending. This will occur when a datasource is added from the administration panel and Seeq is waiting for a response from the agent. This will resolve within 30 seconds after the connection is added. |
 | Something is wrong with the connection. |
Troubleshooting a Connection to a Datasource
Expanding the card with the issue will show information regarding the connection.
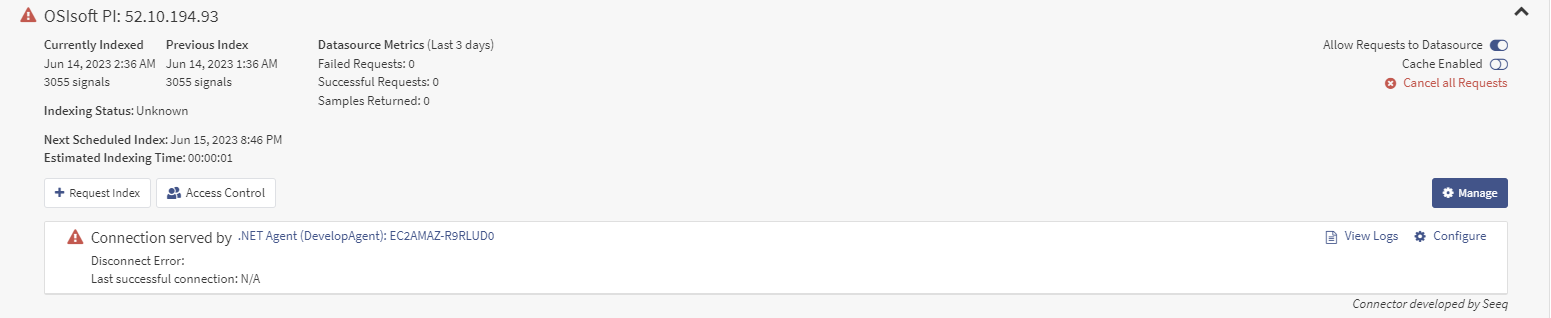
The Disconnect Error will often provide the last error before the disconnection. This could be a connectivity issue, an authorization issue, or a configuration issue. The Last successful connection time can be used to identify a possible configuration change that could have taken place to result in a connection issue.
Addressing Invalid Connection Configuration
In some cases, the issue with the connection might be caused by an invalid datasource configuration. This will be reflected in the Disconnect Error as shown below.

When this occurs, you can click Configure to try to identify the misconfiguration. If you cannot identify the misconfiguration from here, you can move to the next section to view the logs to identify the configuration item causing the error.
If the datasource was added in error or added to the wrong remote agent, clicking Remove Connection will remove it.
Viewing Logs
Since all source historians and databases have varying interfaces and error messages, the most useful source of troubleshooting information is the Seeq connectors' log. Clicking View Logs will open a new tab displaying the agent log, filtered only to show messages from the datasource connection.
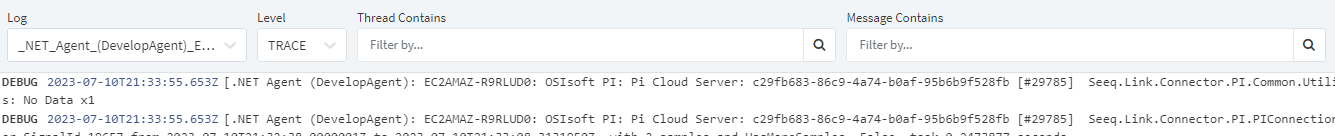
Switching the Level to Error in the filter menu will allow you to focus in on the most recent error messages. This should allow us to see the most recent connection error.

In the example here, it seems like there is an authorization issue on the datasource that can be addressed.