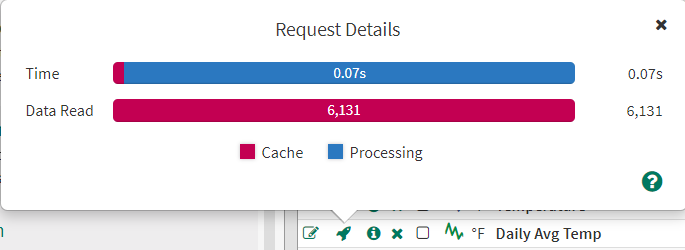
Request Details
This panel provides timing and count information about how the request is processed within the Seeq system, and is intended to give insight into potential bottlenecks or areas for optimization.
Timing
All times are listed in wall-clock time, which is the amount of time that would have elapsed according to looking at a clock on the wall. Seeq's calculation engine may choose to parallelize a complex or lengthy calculation, but all timings from such parallelization are mapped back into wall-clock time so they are easier to digest.

Datasource - Time spent waiting for data from the datasource, such as PI, PHD, Ignition, etc. Requests that spend a large amount of time waiting for the datasource could indicate a large amount of source data is needed to satisfy the request or that the datasource is operating at a lower than expected throughput. Note: This timer measures the time between when the Seeq server makes a data request and when it receives the response, thus this timer encompasses the amount of time spent in the agents and connectors as well as all network communication delays.
Cache - Time spent reading from and writing to Seeq's built-in cache. This is expected to be insignificant most of the time, but larger values may indicate a very large amount of data read from or written to the cache, or it could indicate a hard disk that is operating below expectations.
Processing - Time spent in the calculation engine. Note, even signals that are read directly from the datasource without any apparent computational needs are still fed through the calculation engine so the data can be downsampled for display.
Seeq Database - Time spent fetching necessary data from the Seeq internal database. This could be worksheets, worksteps, formulas, parameters, metadata, permissions etc. The amount of time spent in the Seeq database should be insignificant, but if it isn't, it could indicate an issue with either the formula being run (too many dependencies for example), or a lack of server resources.
GC - Time spent in garbage collection, a process by which unused memory is reclaimed by the system for re-use. Requests that spend a large amount of time in garbage collection indicate that the system was heavily burdened when the request was processing. Note, the source of the burden may not be the request that is being examined but rather another request that was active at the same time or the cumulative effect of multiple concurrent requests. If many requests show non-trivial (>10%) GC time, it might signal a Seeq server that needs more memory or perhaps a server that requires more capacity in a few respects.
Request Queue - Time spent waiting for the request to start initial processing. This is normally insignificant (<5ms), but a large amount of time in this queue indicates the server is at or over capacity.
Calc Engine Queue - Time spent waiting for the request to process in the calculation engine. This is normally insignificant (<5ms), but a large amount of time in this queue indicates the server is at or over capacity.
Counts
Cache In-Memory Samples/Capsules Read - Number of samples/capsules read from the in-memory cache that keeps data read from datasources in memory for up to 5 minutes.
Cache Samples/Capsules Read - Number of samples/capsules read from Seeq's on-disk cache. All calculated signal and condition data is cached on-disk by default, and on-disk caching can be enabled for datasource data if Seeq determines it to be beneficial.
Datasource Capsules Read - Number of capsules read from a datasource to fulfill the request.
Datasource Samples Read - Number of samples read from a datasource to fulfill the request.
