Reference Profile
The Reference Profile tool enables users to characterize a signal's behavior. This tool creates a profile by aggregating signal trends within a condition over a user-defined training window. This tool is commonly used to create control limits for Statistical Process Control (SPC) and to create signal boundaries.
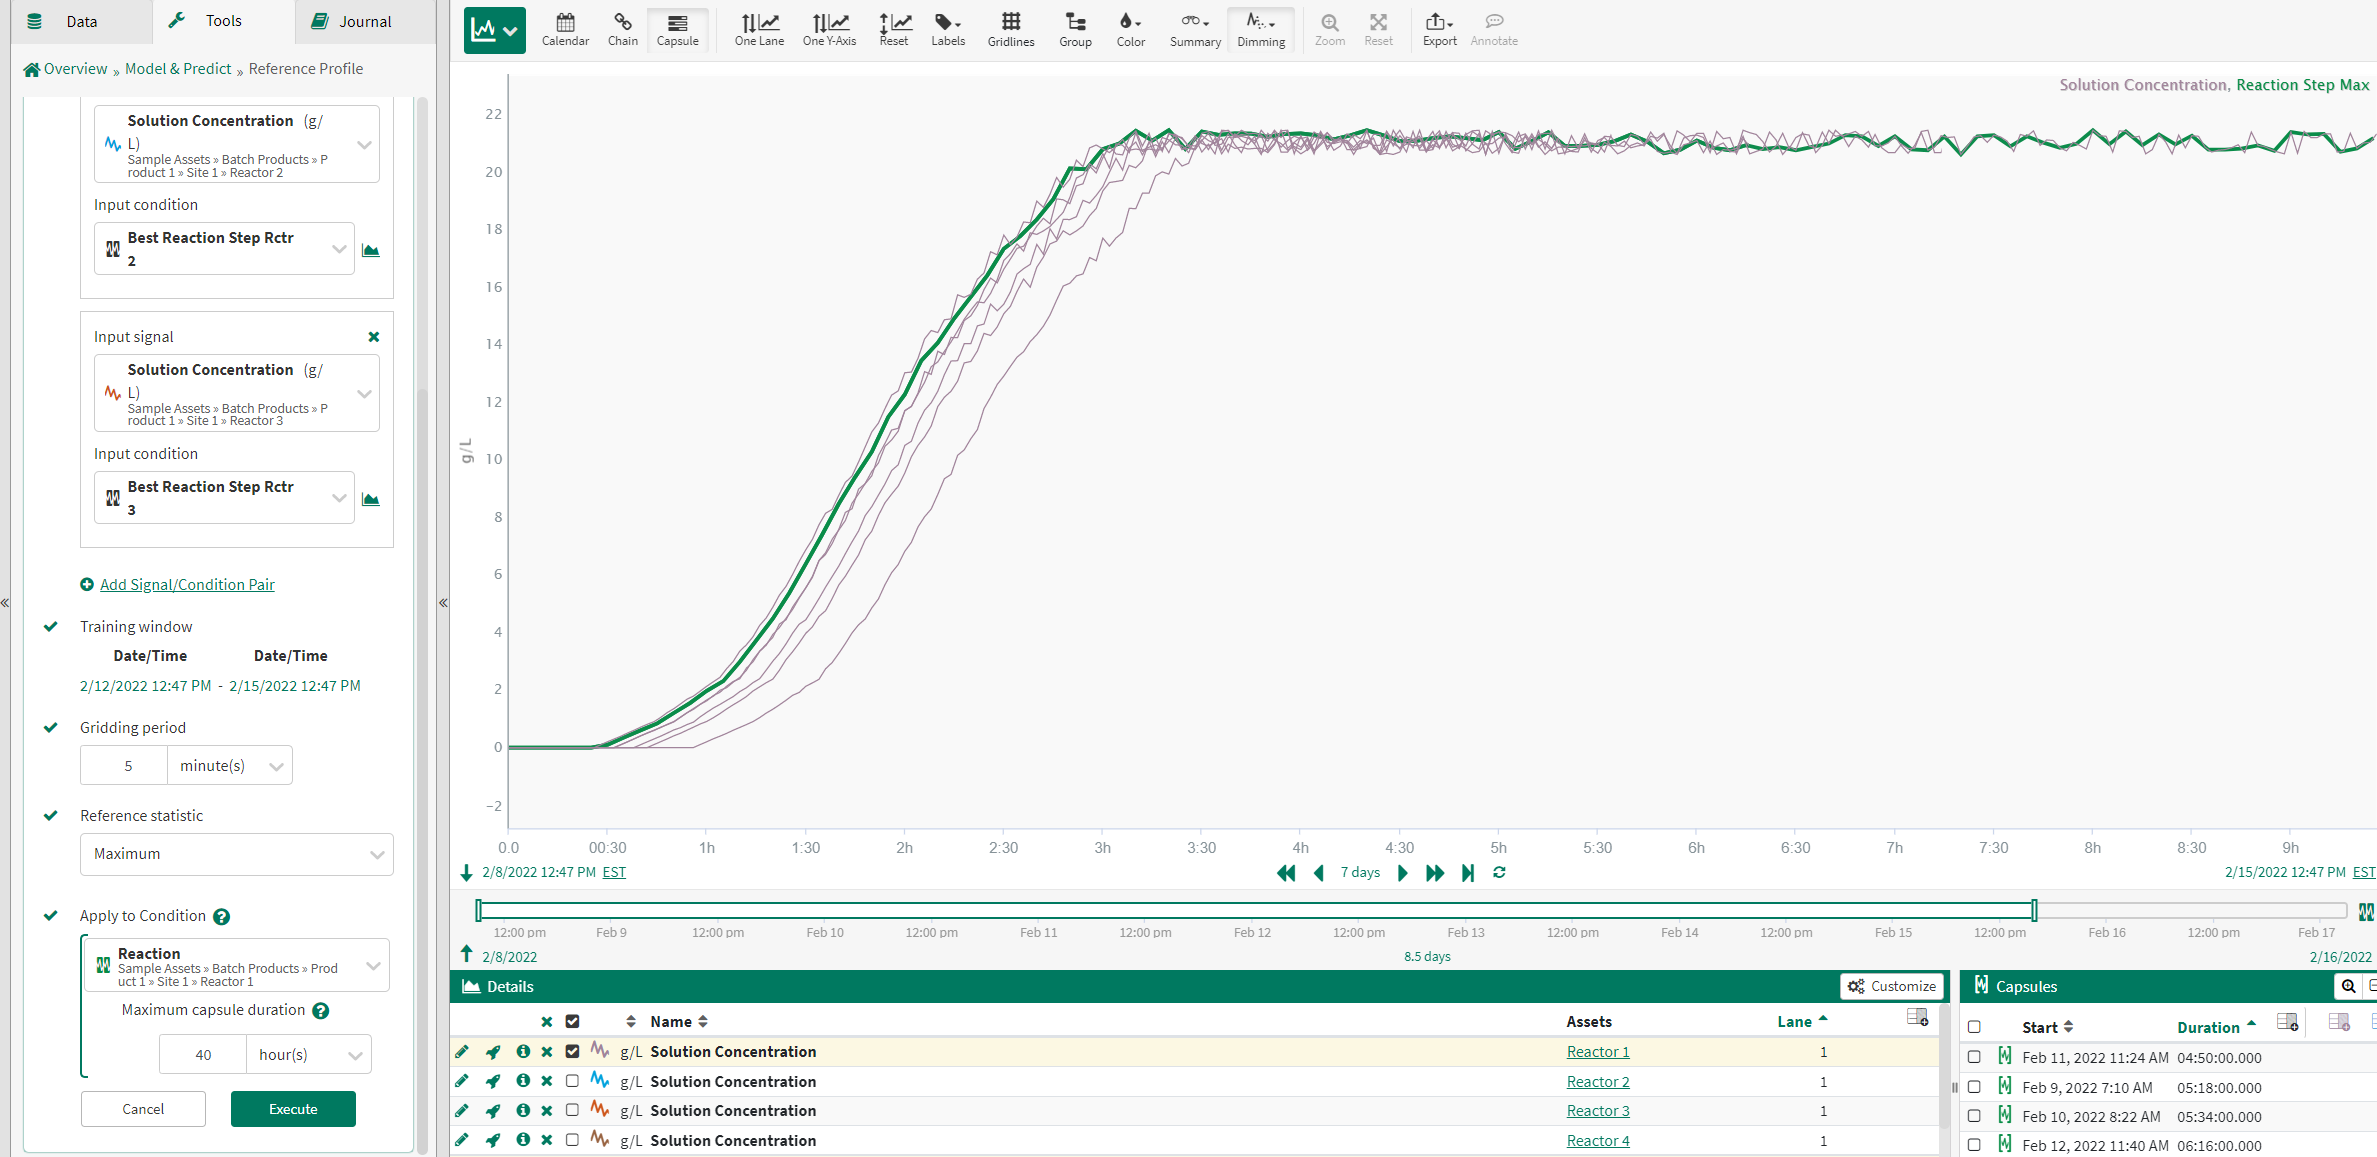
Using the Reference Profile Tool
Add signal/ condition pairs: Enables the use of signal/ condition pairs across multiple assets to build the reference profile.
Input signal: From the dropdown menu, select a signal from the details pane, pinned items or recently accessed sections from any asset.
Input condition: From the dropdown menu, select a condition from the details pane, pinned items or recently accessed sections. The Reference Profile is calculated based upon the behavior of the input signal during this input condition. The input condition’s asset should match that of the input signal for each signal/condition pair.
Training window: Specify the time period over which the Reference Profile is calculated. Only capsules in the Input Condition that fall within this training window are used to calculate the Reference Profile.
Gridding period: Enter the sampling frequency for the Reference Profile. For example, if a gridding period of 5 minutes is specified, the Reference Profile has a sample every 5 minutes.
Reference statistic: From the dropdown menu, select the statistic to use in creating the Reference Profile. User-defined multipliers can be applied for all statistics (except average, minimum and maximum) for the purpose of defining upper and lower operating boundaries. For more information on the Reference Statistic, see the Reference Statistic section below.
Apply to Condition: Select the condition to apply the reference profile to. This condition is typically the original condition the input condition used in the signal/condition pairs was selected from. I.e. all of the capsules in the Reaction condition vs the specified “Best” reaction step capsules.
Reference Statistic
The Reference Statistic input identifies the statistic that is used to calculate the Reference Profile. The Average, Minimum and Maximum Reference Profiles do not require a multiplier. All other reference profiles are calculated as follows:
RefProf = AvgRefProf + Multiplier*(RefStatistic)
RefProf = calculated Reference Profile using the selected Reference Statistic
AvgRefProf = the Average Reference Profile (discussed below)
Multiplier = the Reference Statistic multiplier specified by the user in the Reference Profile tool
RefStatistic = the Reference Statistic specified by the user int eh Reference Profile tool
The Multiplier may be positive or negative. If '0' is used for the Multiplier, the Average Reference Profile is calculated.
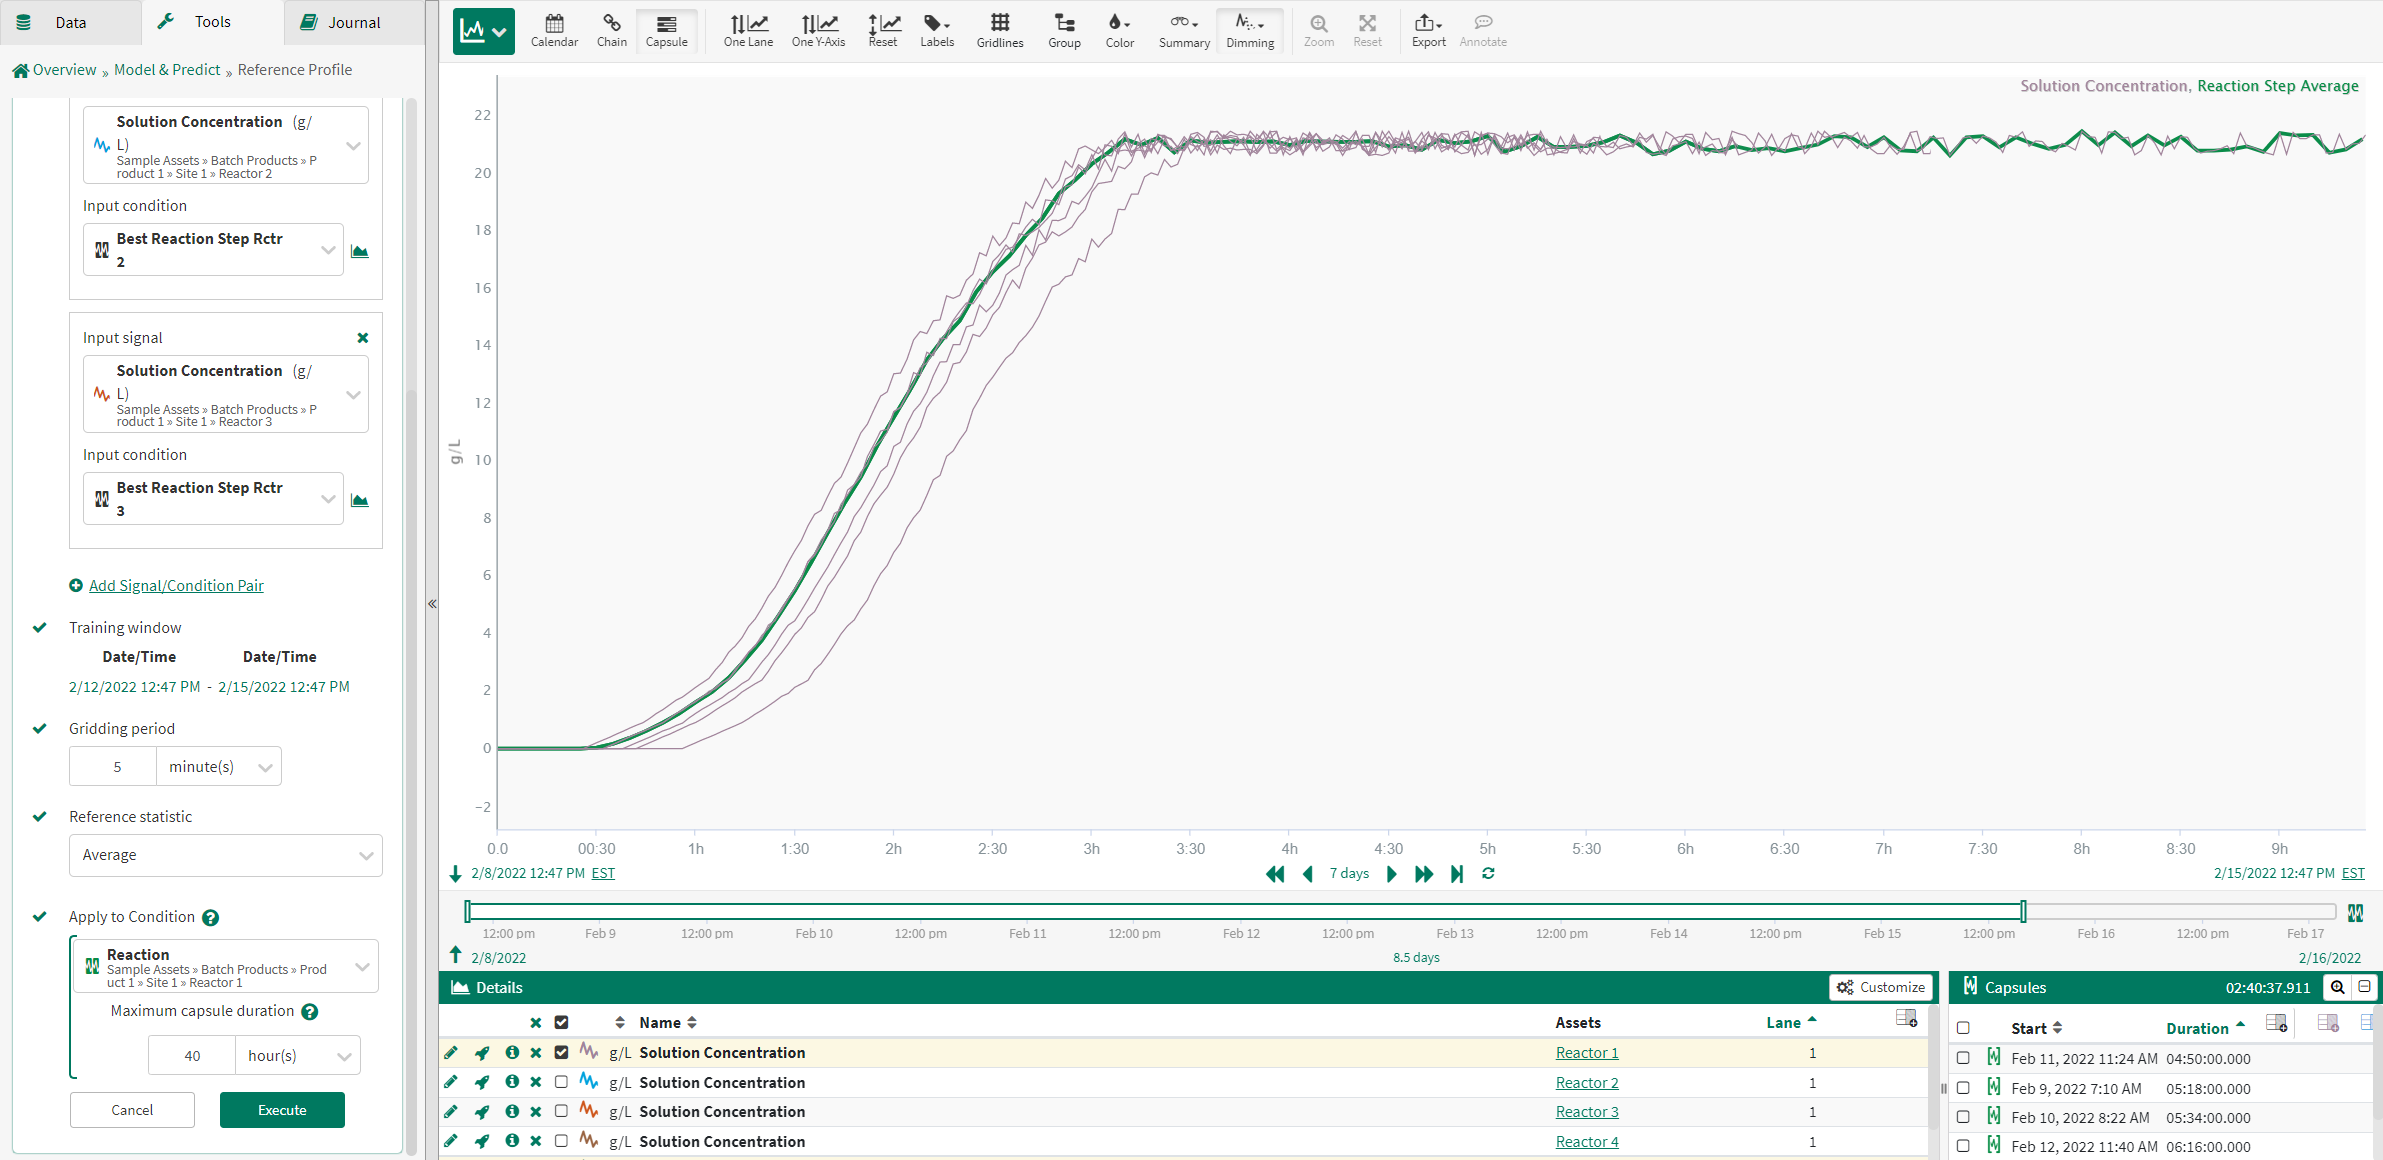
Average
Selecting Average for the Reference Statistic calculates the Reference Profile as the average of the input signal during each capsule of the Input Condition(s) over the training window. All other Reference Statistics are based upon this Average Reference Profile.
The example to the right shows an Average Reference Profile created based upon a signal's performance during several “Best” capsules used in the signal/condition inputs.
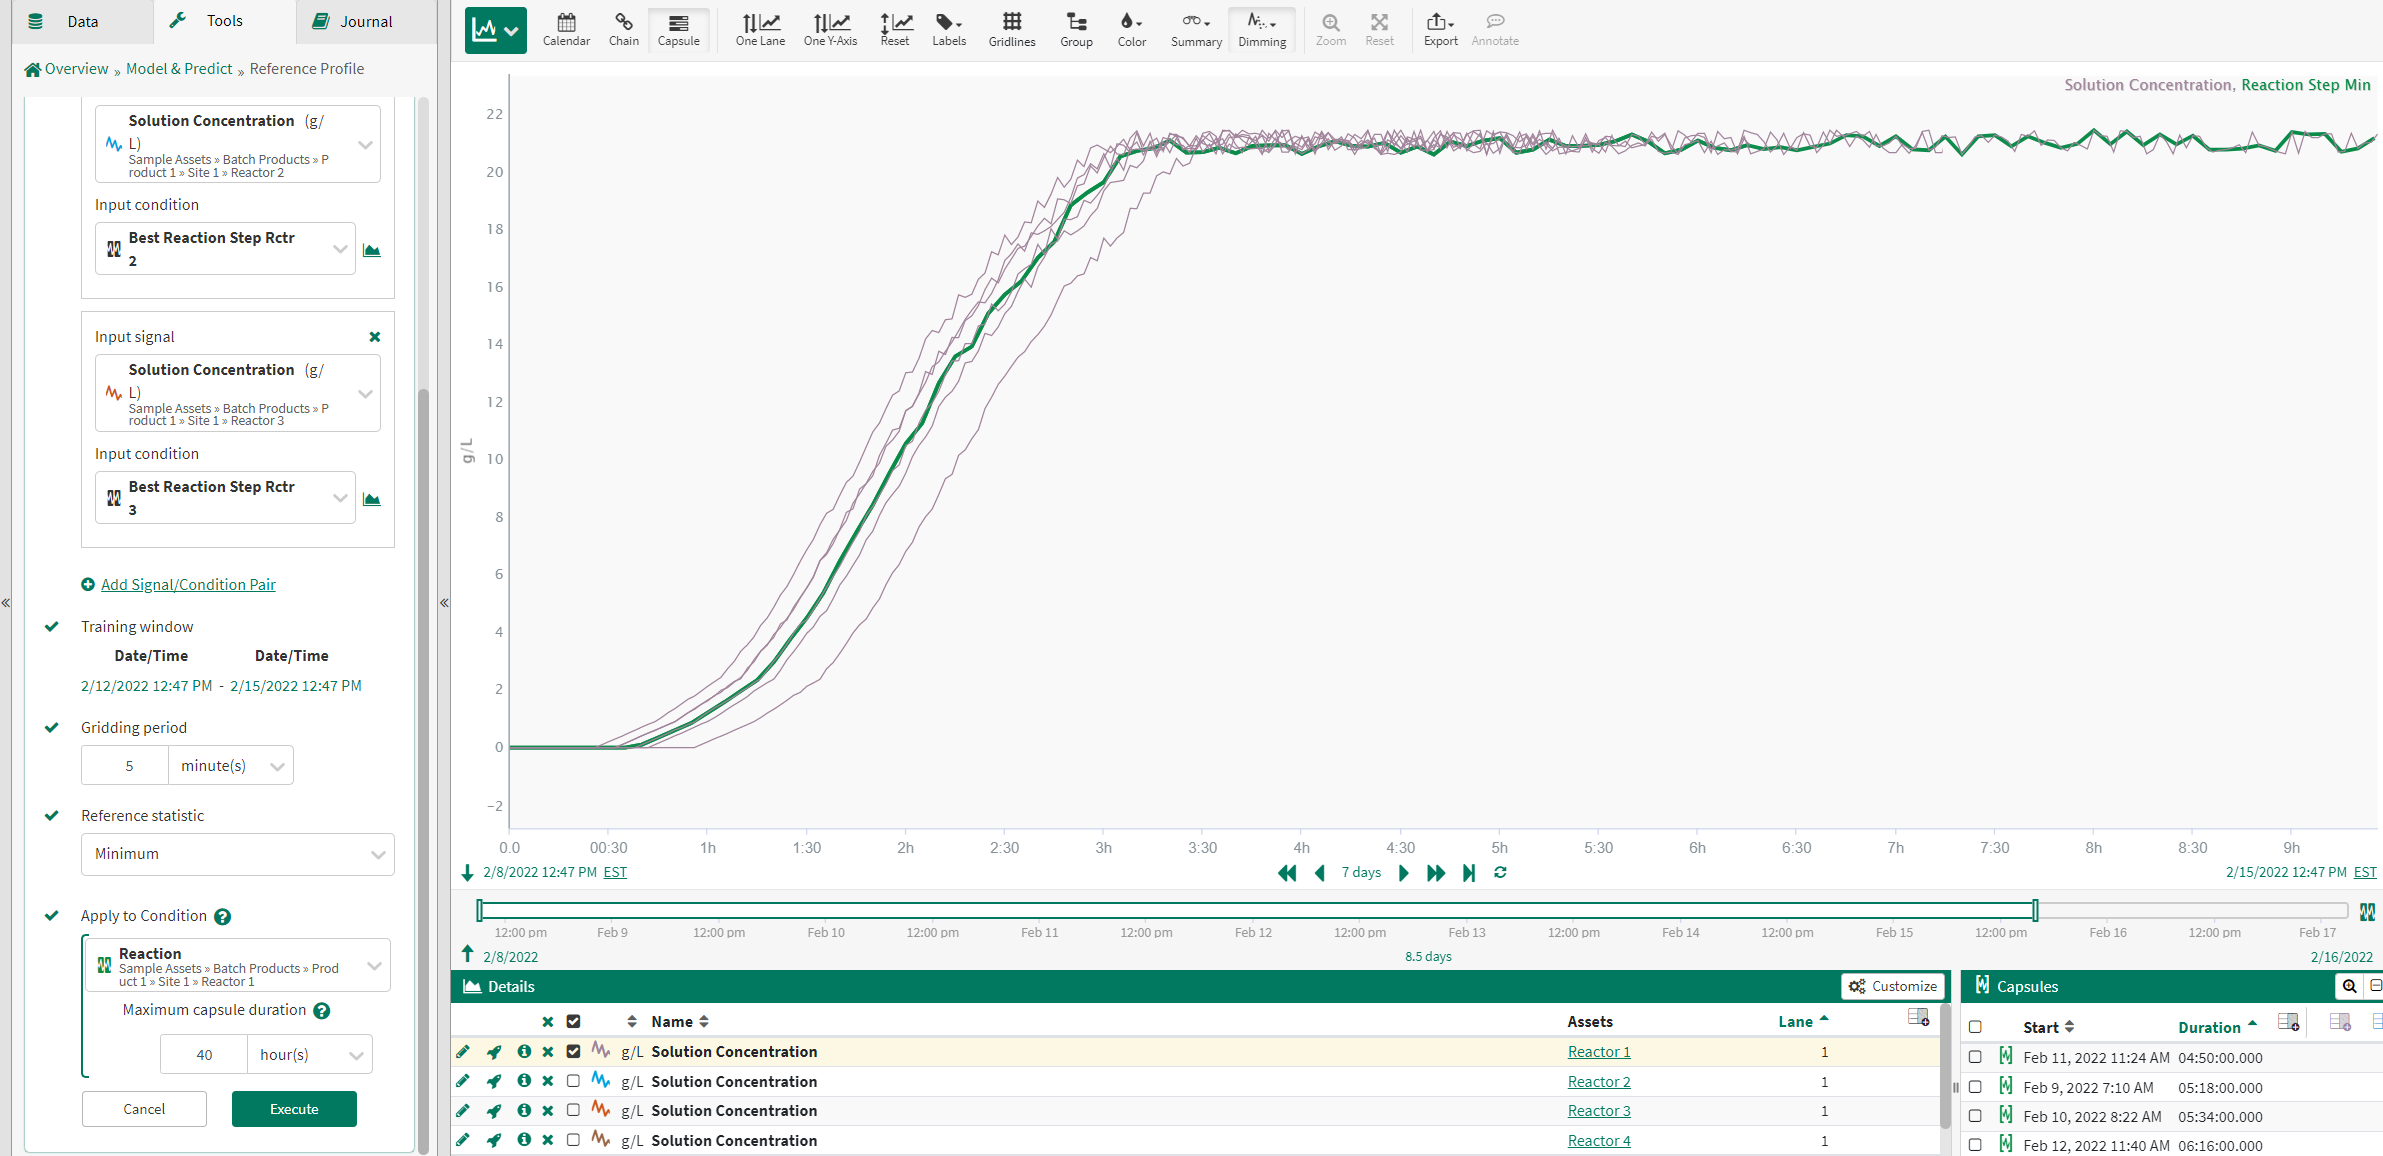
Minimum
Selecting Minimum for the Reference Statistic calculates the Reference Profile as the minimum of the input signal during each capsule of the Input Condition over the training window.
The example to the right shows an Minimum Reference Profile created based upon a signal's performance during several “Best” capsules used in the signal/condition inputs.
Maximum
Selecting Maximum for the Reference Statistic calculates the Reference Profile as the maximum of the input signal during each capsule of the Input Condition over the training window.
The example to the right shows an Maximum Reference Profile created based upon a signal's performance during several “Best” capsules used in the signal/condition inputs.
Average, Maximum and Standard Deviation
Selecting Average, Maximum or Standard Deviation for the Reference Statistic calculates the Reference Profile as:
RefProf = AvgRefProf + Multiplier*Dev
RefProf = calculated Reference Profile using the Average Deviation Reference Statistic
AvgRefProf = the Average Reference Profile (discussed above)
Multiplier = the Reference Statistic multiplier specified in the Reference Profile tool
Dev = the Average, Maximum or Standard Deviation of the input signal.
The example to the right displays two Average Deviation Reference Profiles, one with a +3 multiplier and one with a -3 multiplier, compared to the Average Reference Profile.

Example
In this example use case, a process has an expected behavior during a phase transition. The Reference Profile tool is used to characterize this expected behavior and set upper and lower limits for the input signal during these phase transitions. With the limits set, excursions outside of these limits are easily identified.
1. Identify Profile of Interest
The phase transitions are easily identified using Value Search on the mode tag.
The image to the right shows the Value Search used to identify the 'Production mode' condition.
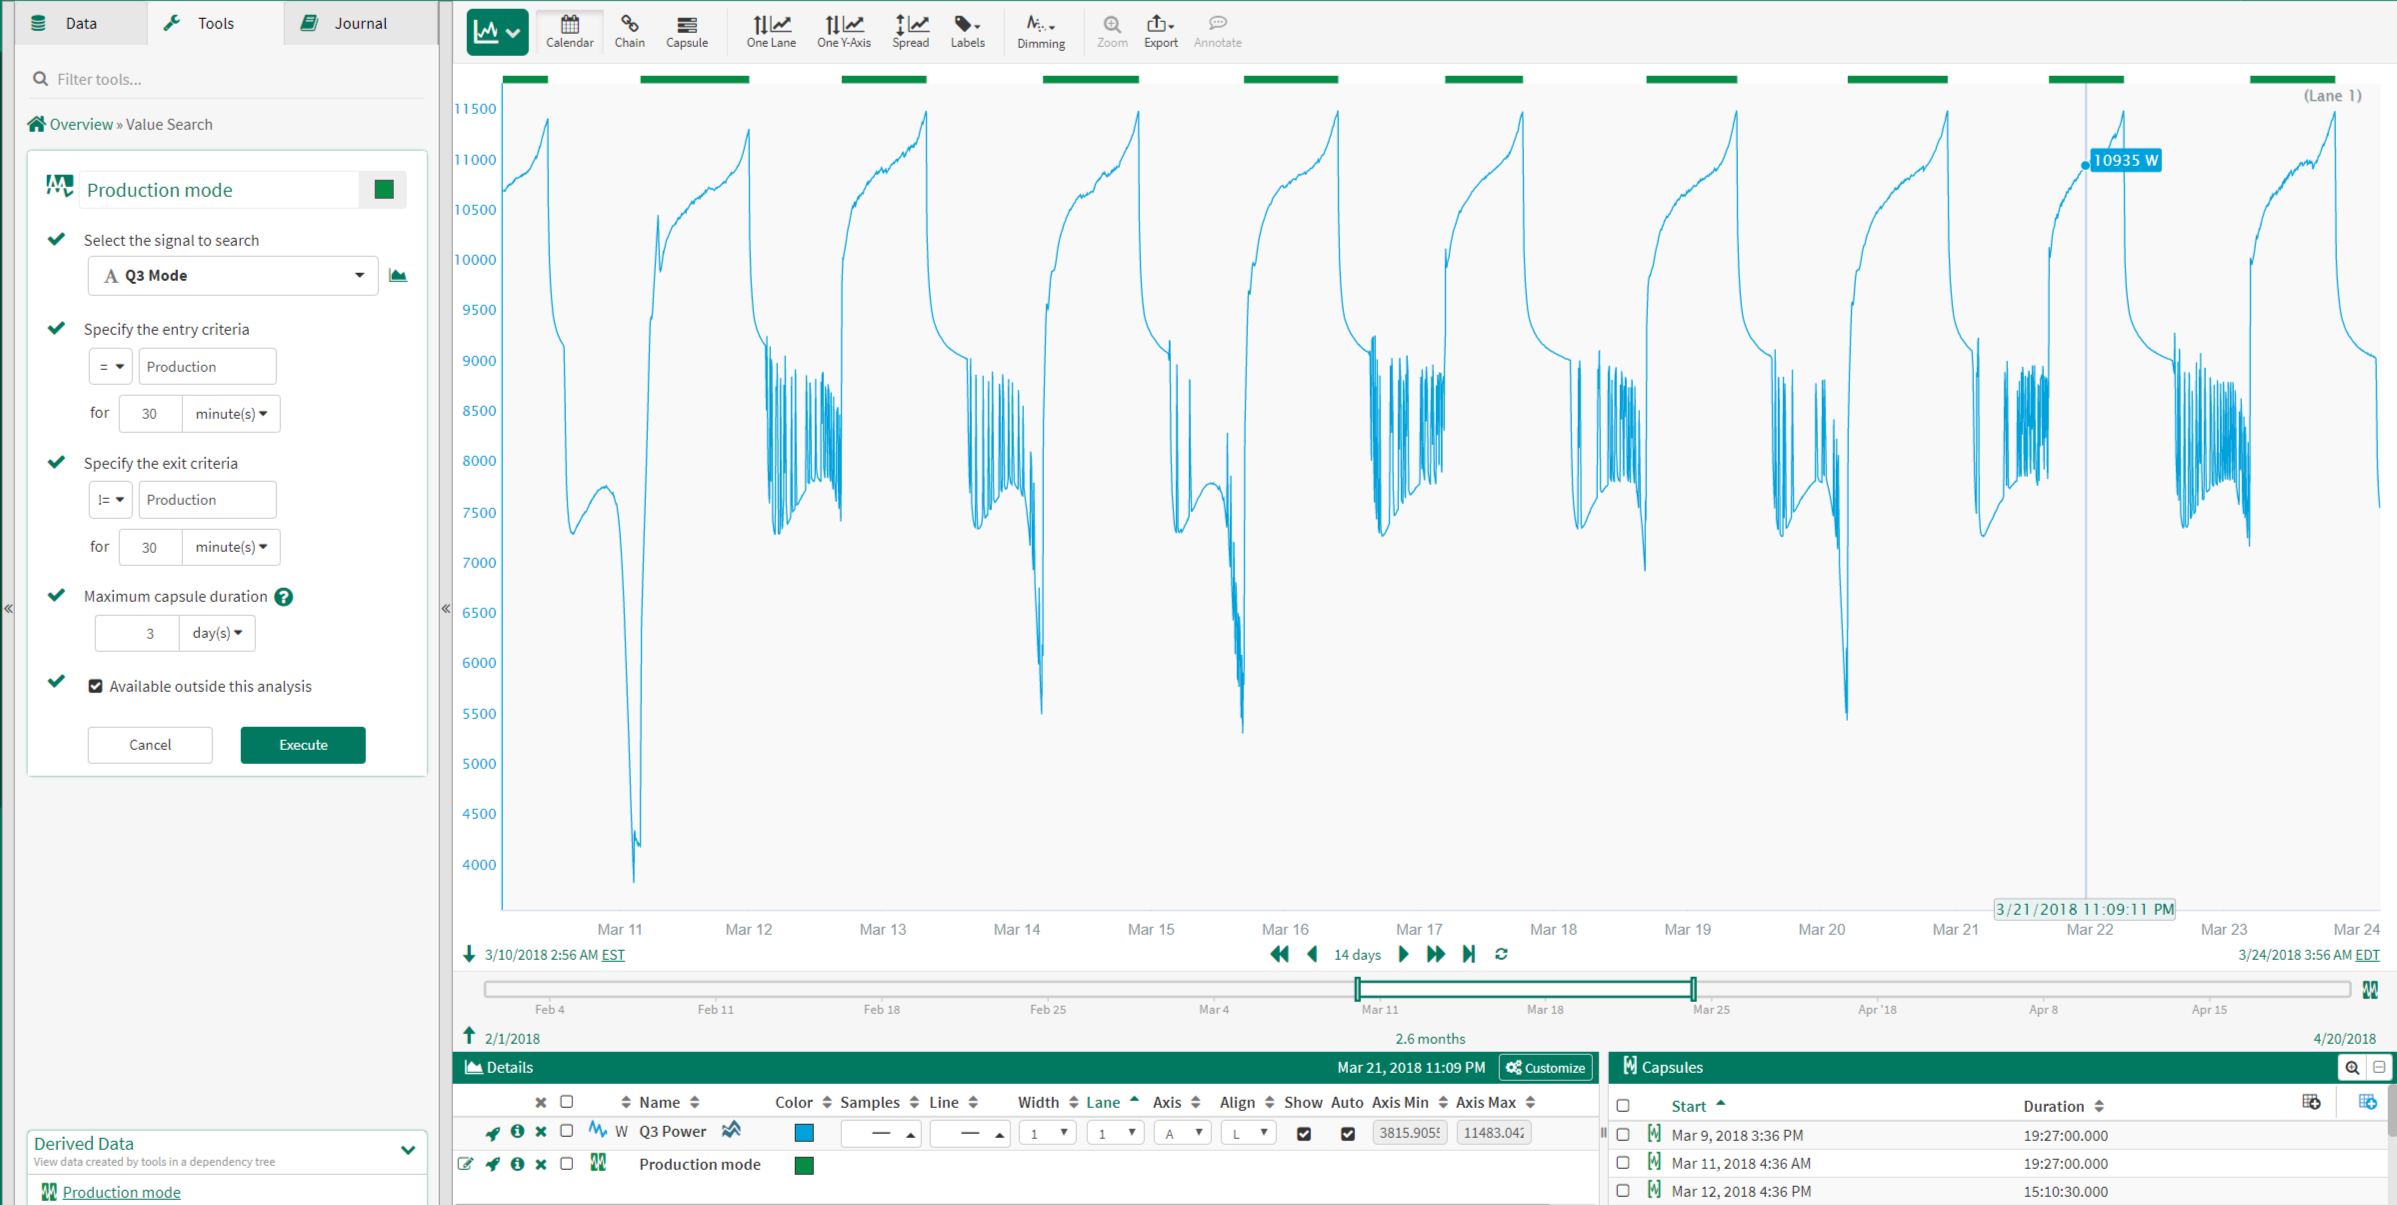
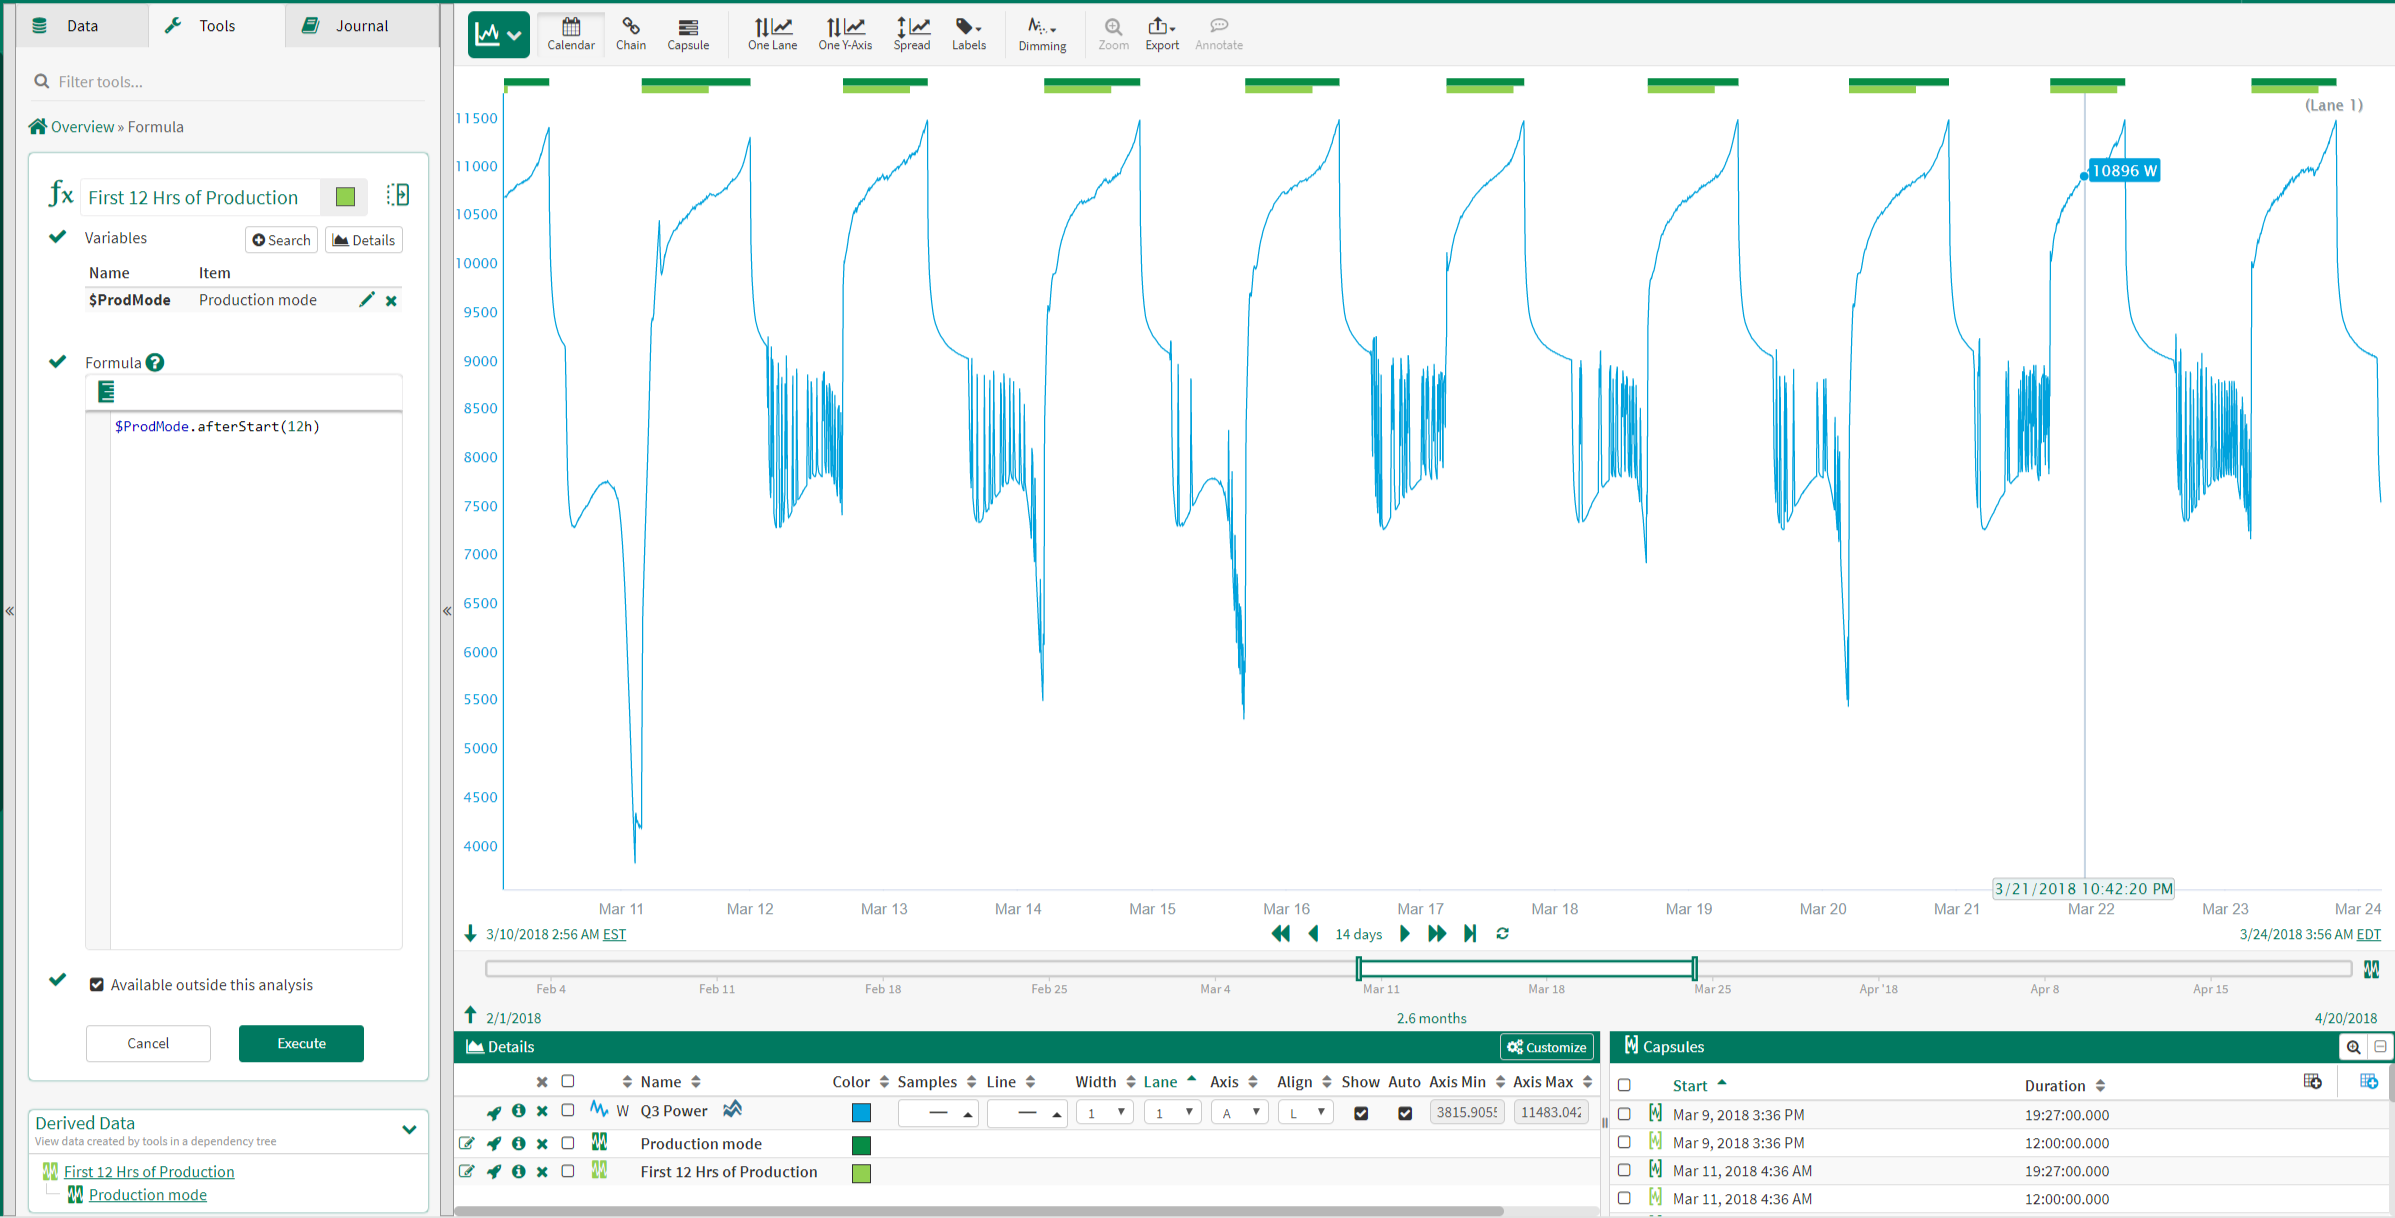
Since the durations of the 'Production mode' capsules vary, Formula is used to identify just the first 12 hours of production. This ensures that the Reference Profile is created using capsules of equal duration.
The image to the right shows the Formula used to identify the 'First 12 Hrs of Production' condition.
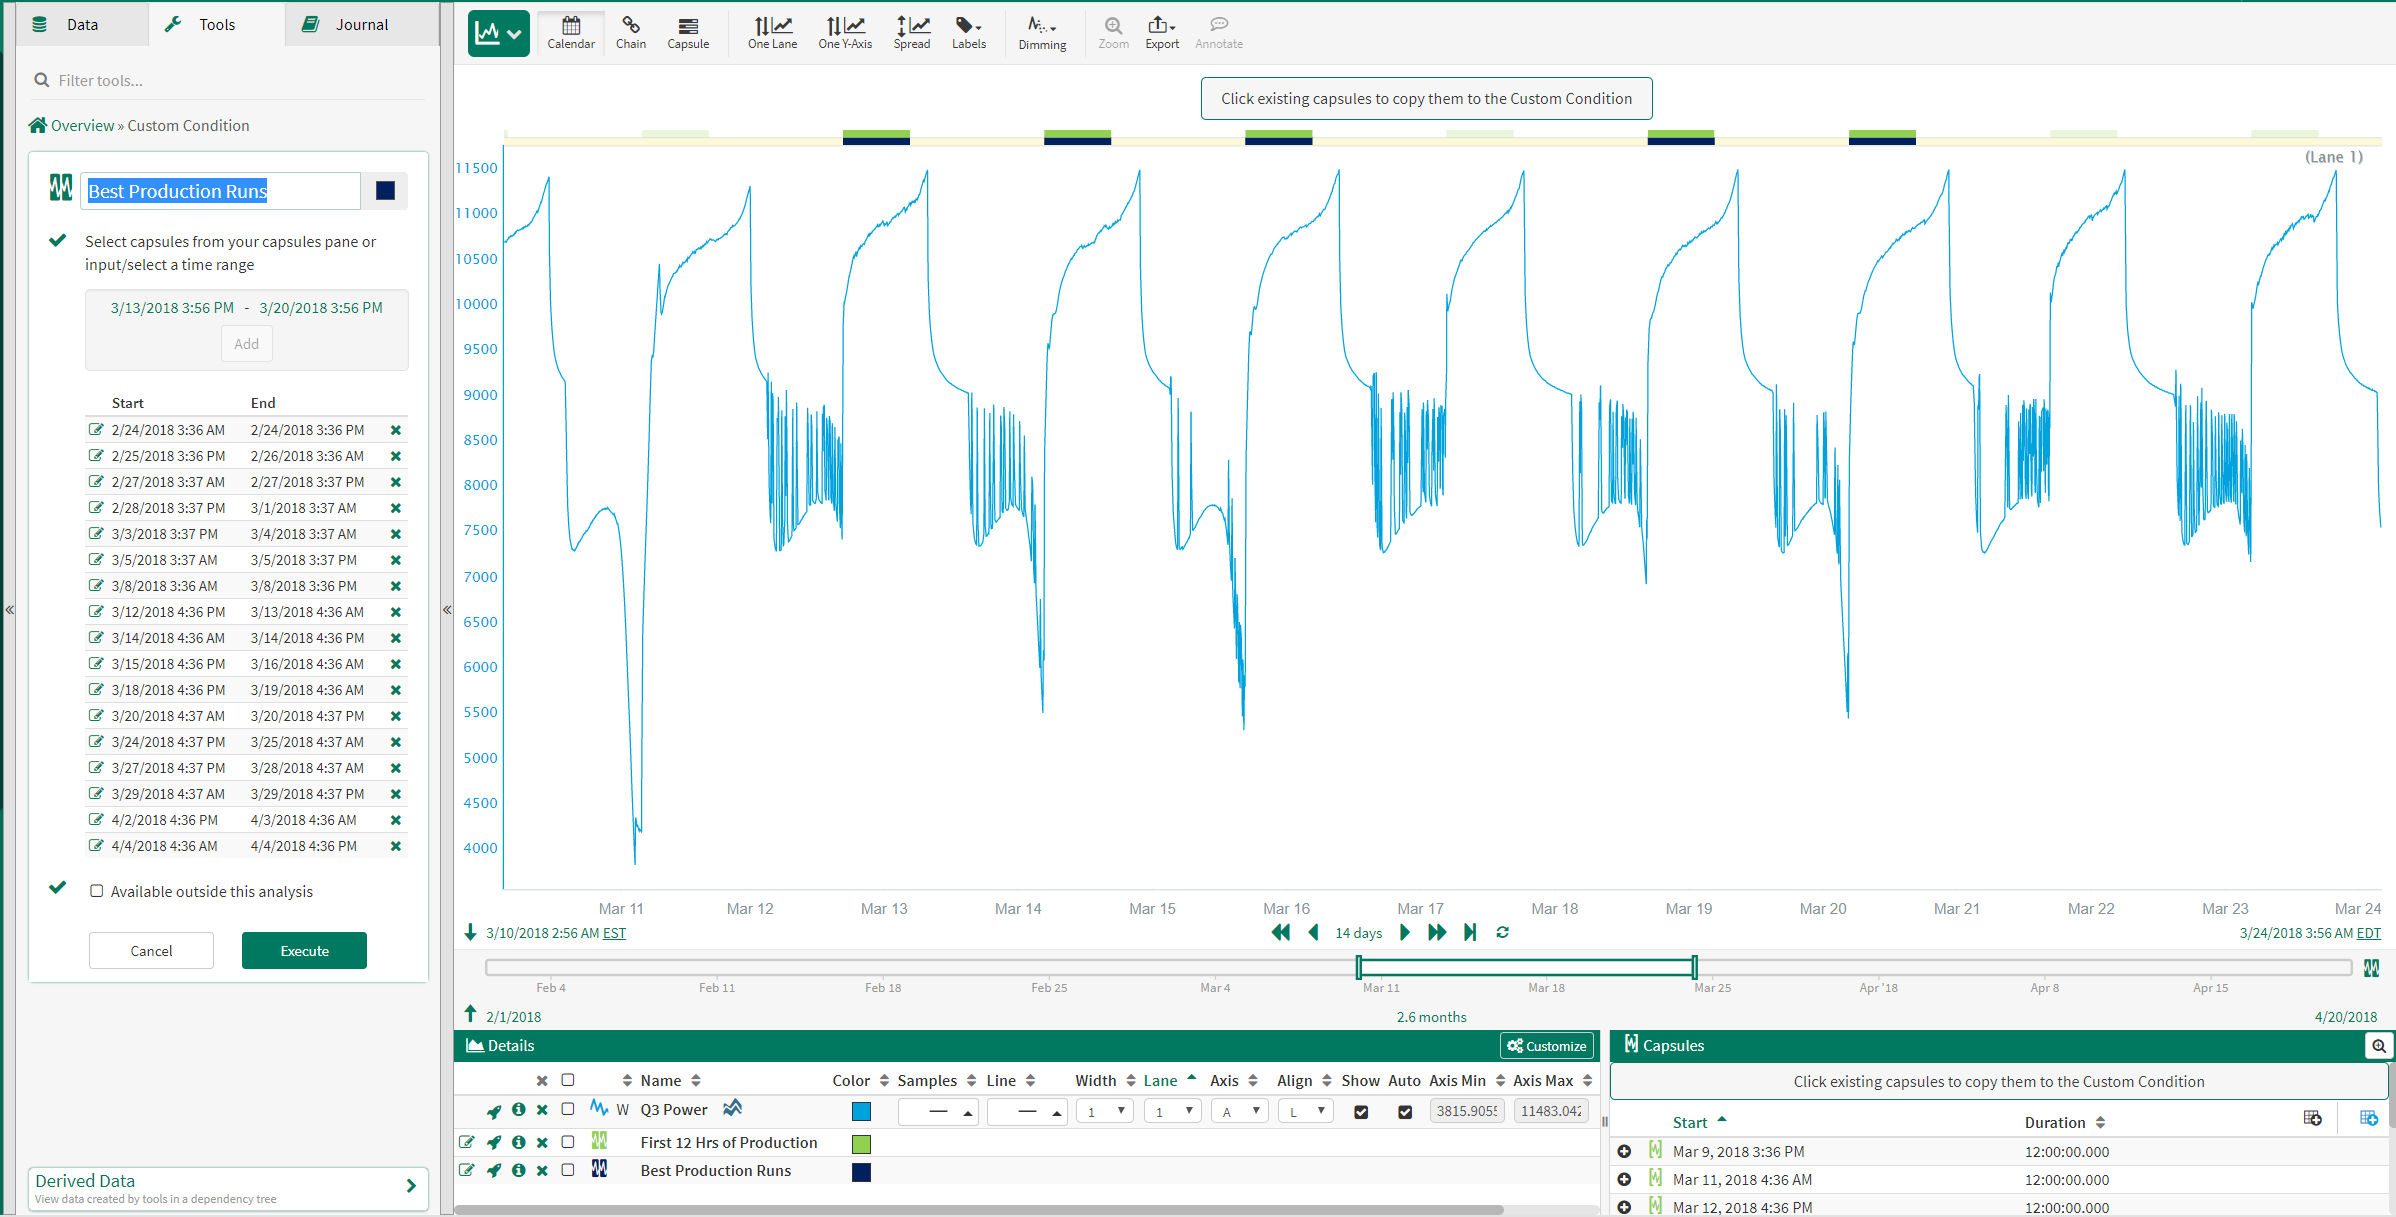
2. Identify Best Production Runs
The best production runs are manually selected using the Manual Condition tool. The capsules in the this 'Best Production Runs' condition will be used to create the Reference Profile.
The image to the right shows the Manual Condition used to create the 'Best Production Runs' condition.
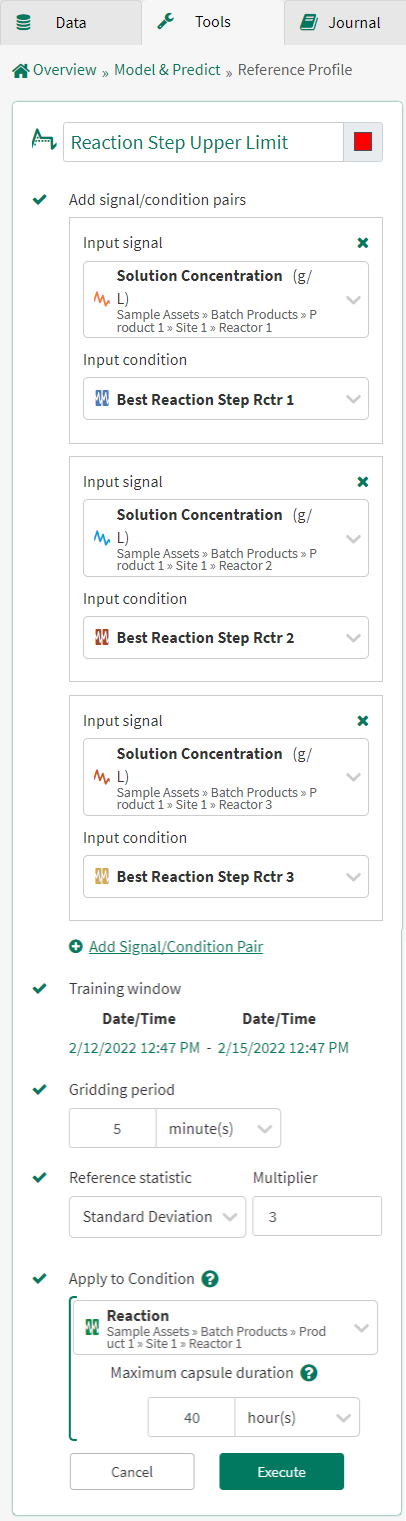
3. Calculate Reference Profile(s)
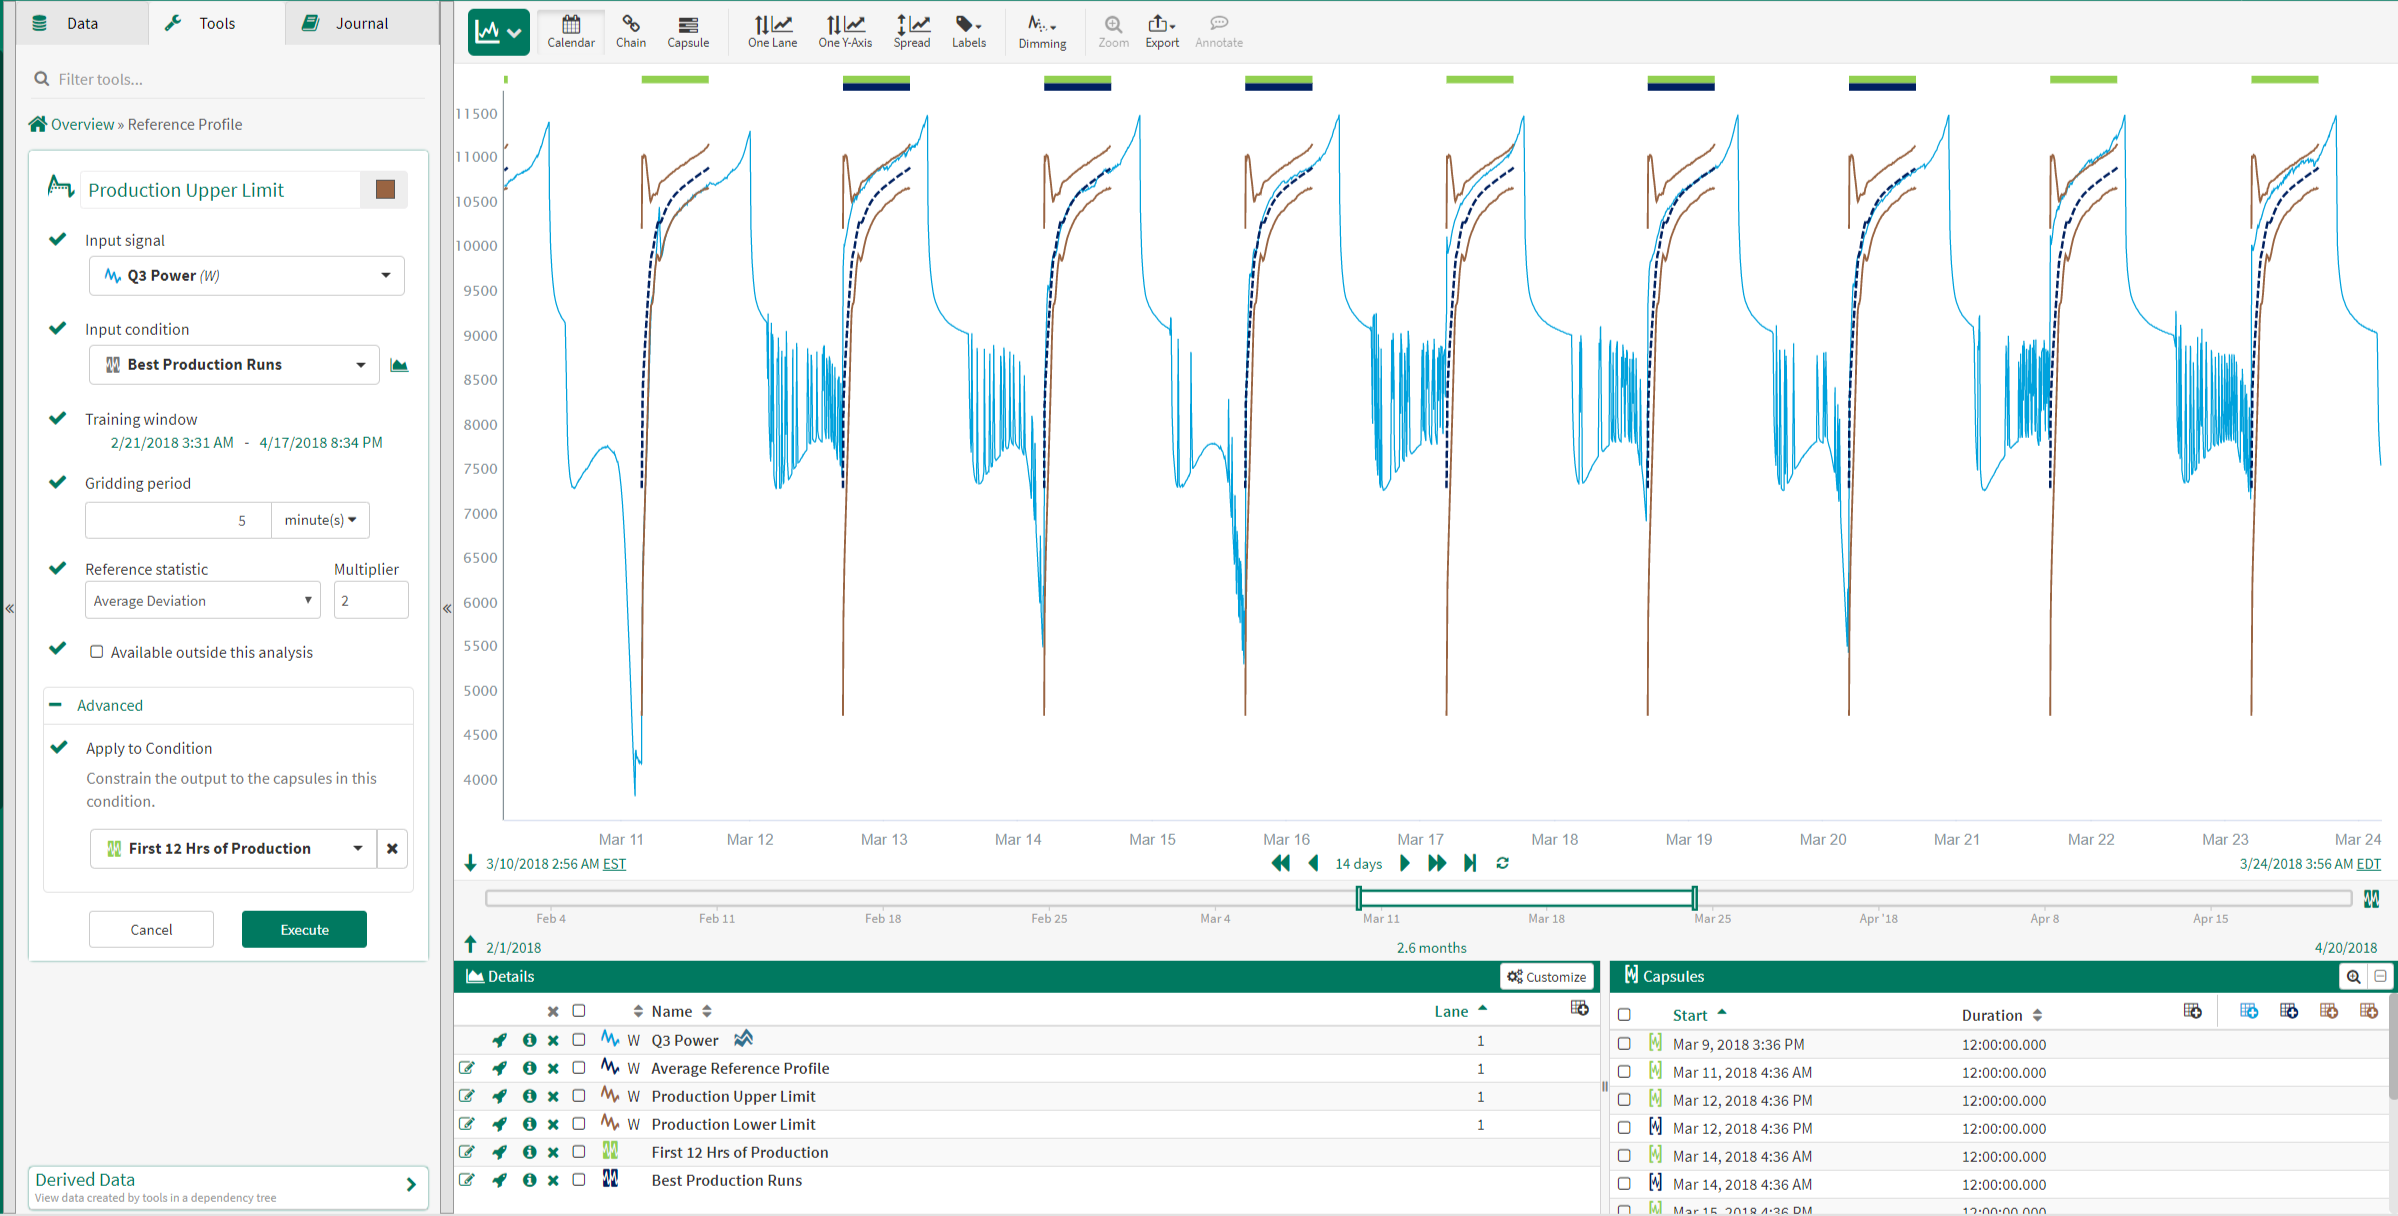
The Reference Profile tool is used to create 3 reference profiles: an Average Reference Profile, a +2 Average Deviation Reference Profile and a -2 Average Deviation Reference Profile.
The image to the right shows the inputs used to calculate the Production Upper Limit profile. The calculated profiles are applied to the input signal during the 'First 12 Hrs of Production' condition.
Note: steps 1 and 2 can be repeated for multiple assets in order to include Best Production Runs from multiple assets to be used as signal/condition pairs.
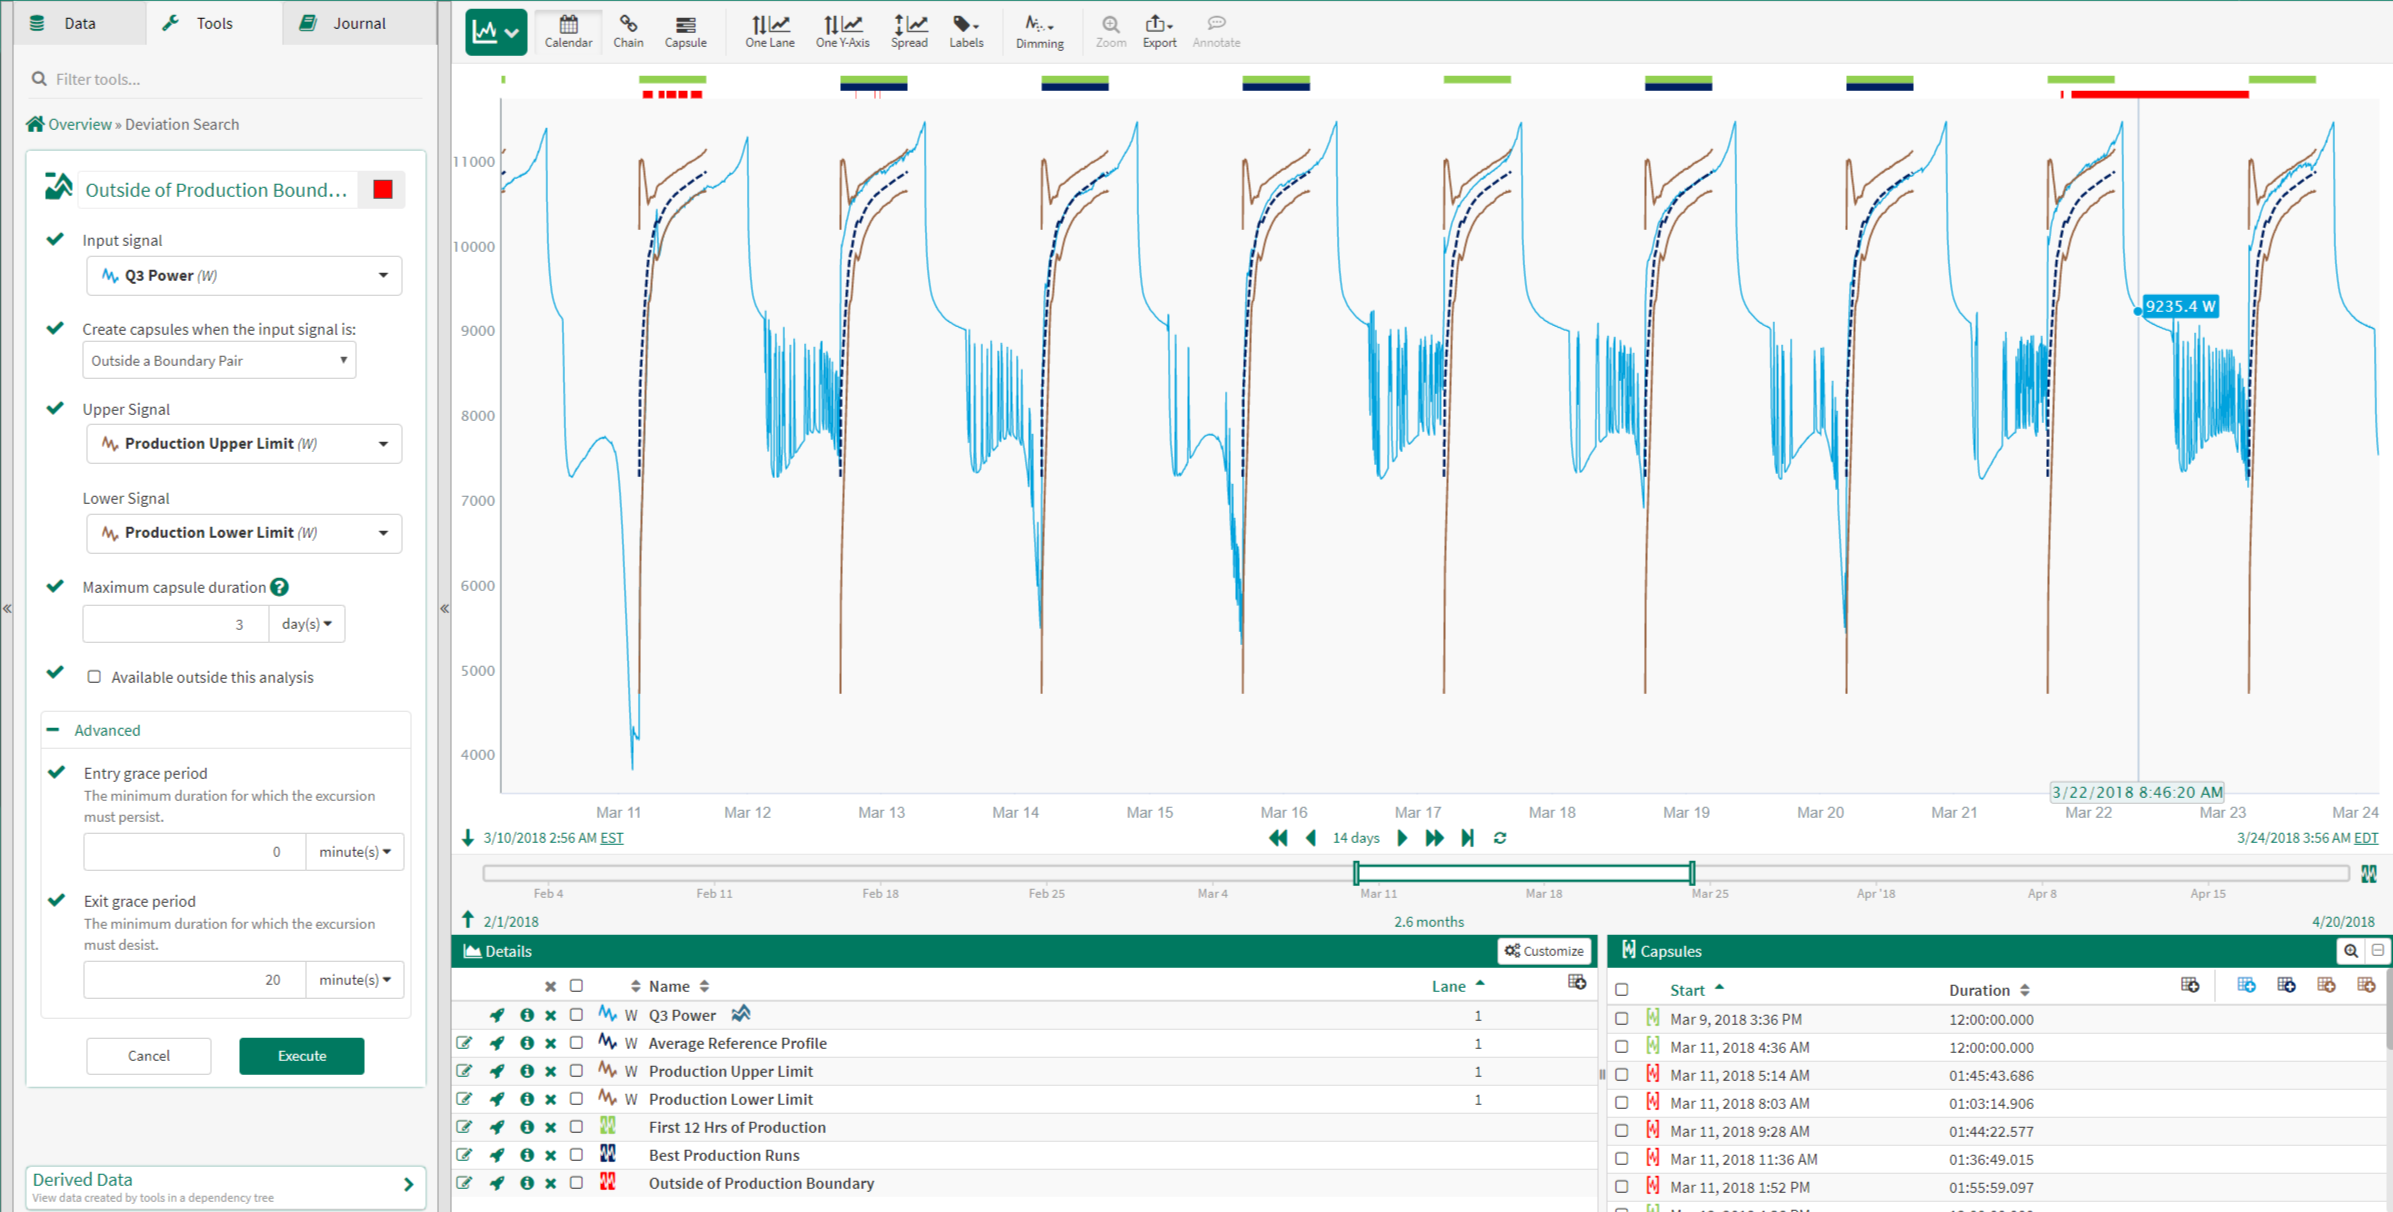
4. Identify Excursions
The Value Search tool is used to identify when the input signal deviates outside of the upper or lower limit.
The image to the right identifies time periods when the input signal exceeds the upper and lower reference profiles.