Analyze Data Crash Course
Welcome!In this use case, use AI-assisted & manual analytics tools to:
 |
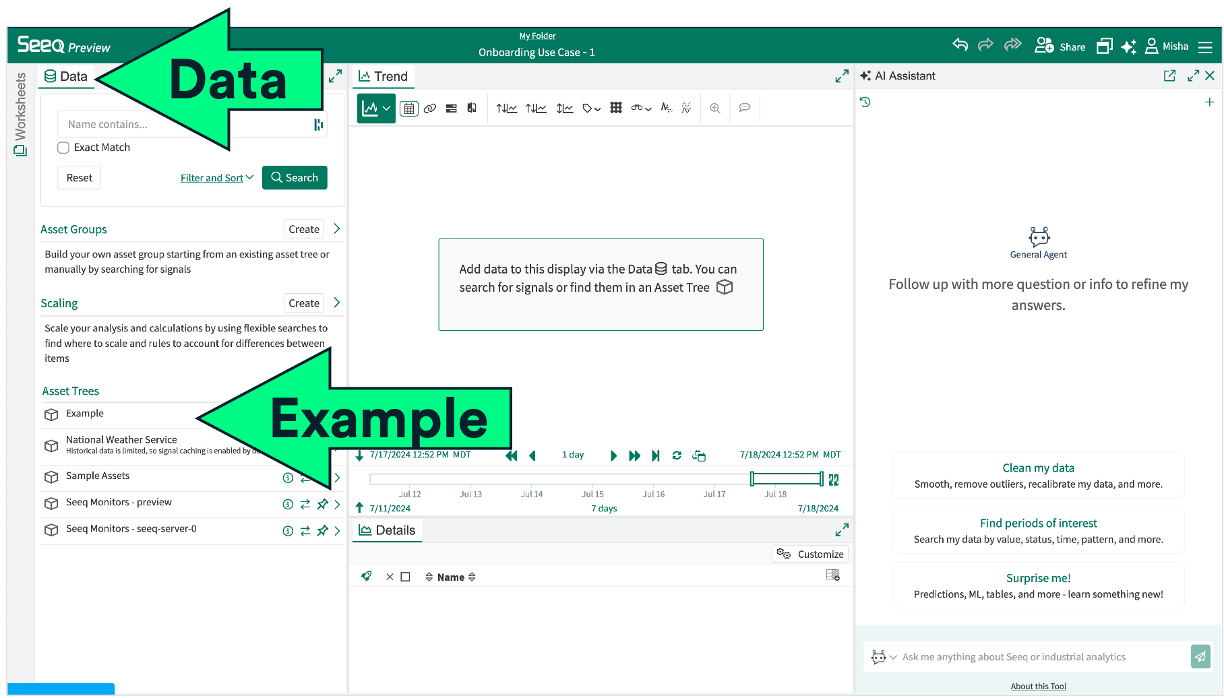
Step 1: Open a new Workbench in Seeq
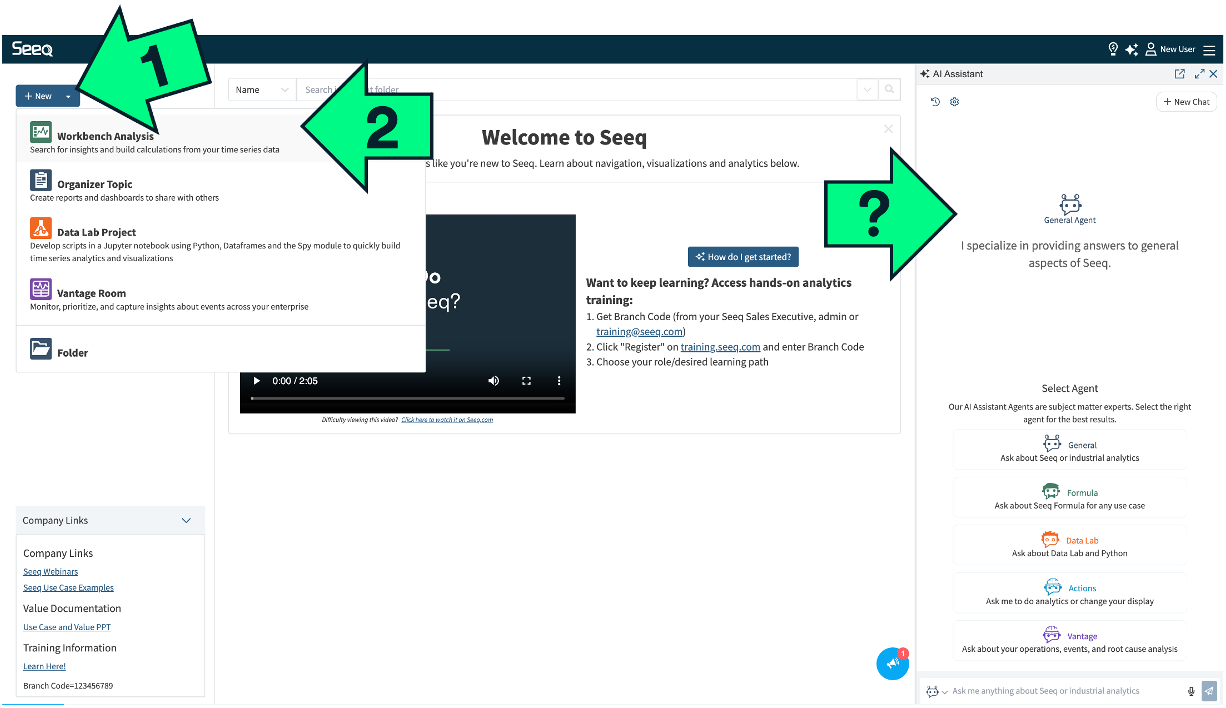
On the Seeq Homescreen (yourcompany.seeq.com), click New, then click Workbench Analysis.
Note that the new Analysis will open in a new tab. Disable pop up blockers to see it.
 Questions? Ask Seeq’s AI!
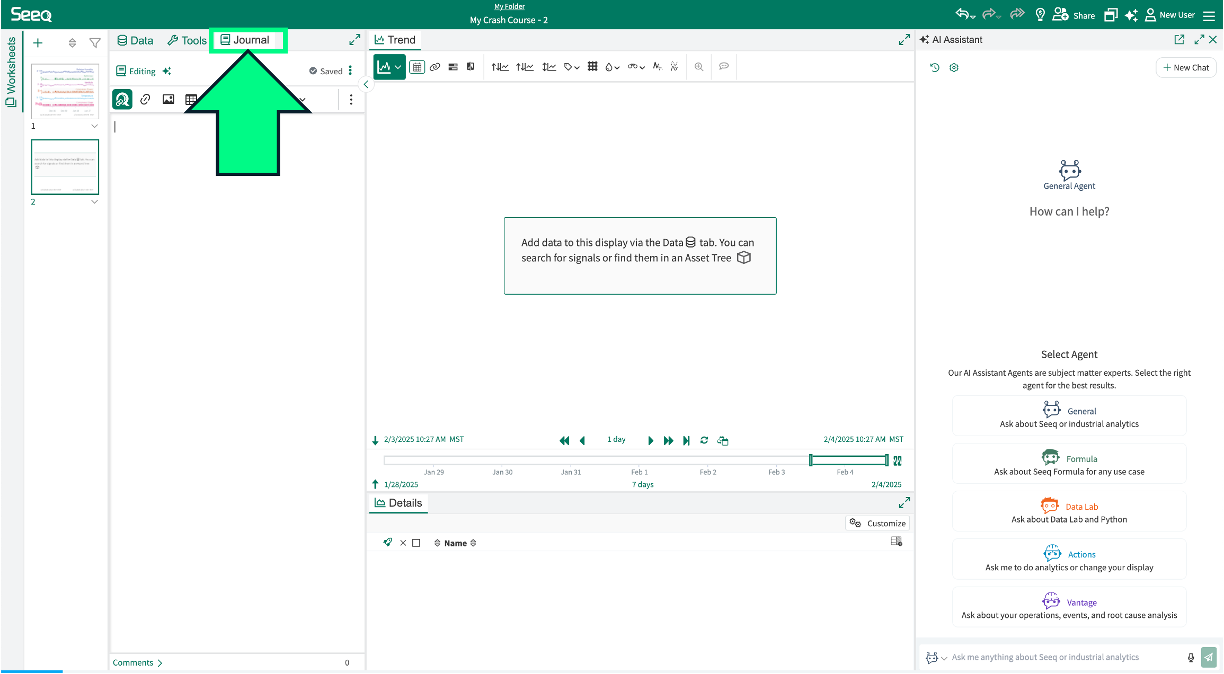
Step 2: Paste the crash course below in the Journal
(or put this tab beside your Seeq screen)
1. Get Data - AI or Manual Search |
You're an engineer assigned to Area A and want to know when the Temperature is too high, then calculate total weekly energy usage in your Compressors.
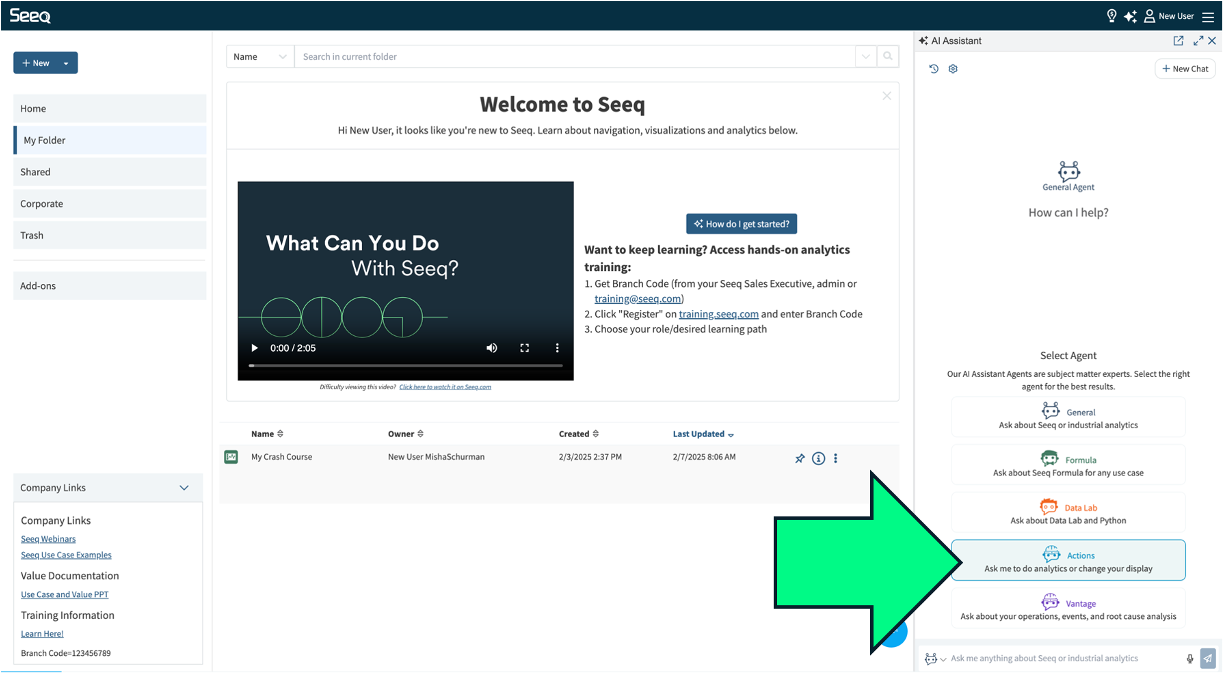
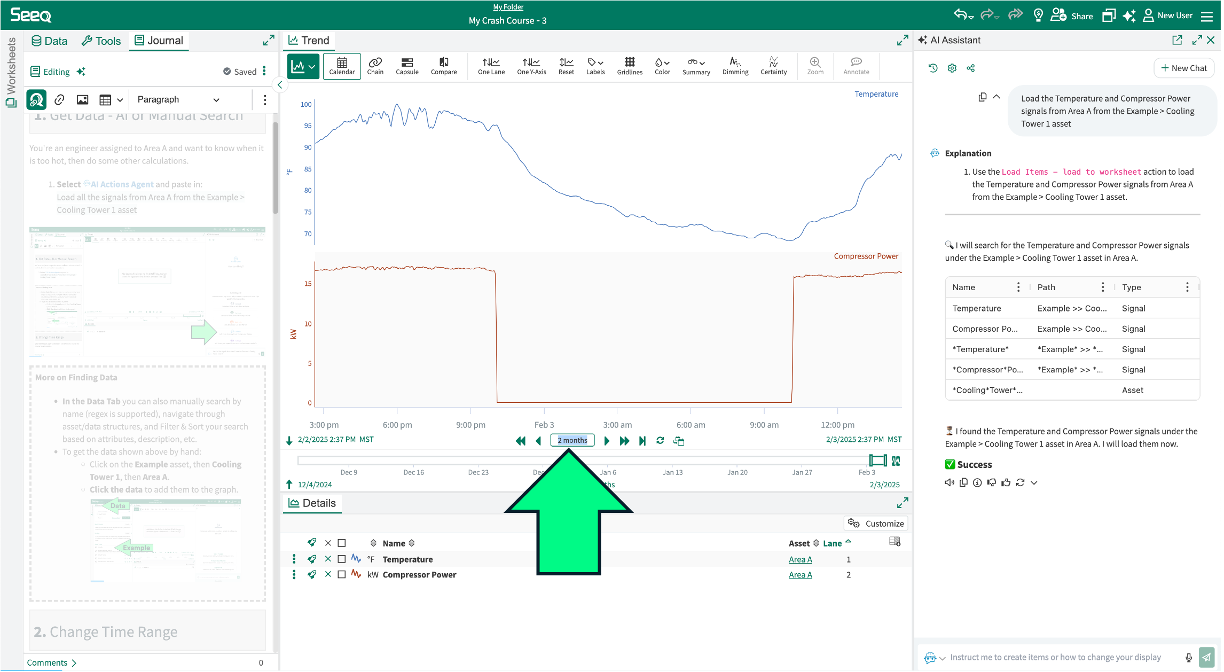
Select AI Actions Agent and paste in:
Load the Temperature and Compressor Power signals from Area A from the Example > Cooling Tower 1 asset
More on Finding Data
 |
2. Change Time Range |
Click on the time range box under the trend, type "2 months" (then Enter) to change the Display Range duration.
**Check out the Customize button in the Details pane: sometimes a click is faster than an AI prompt!
Your work is saved automatically (if you are connected to the internet). |
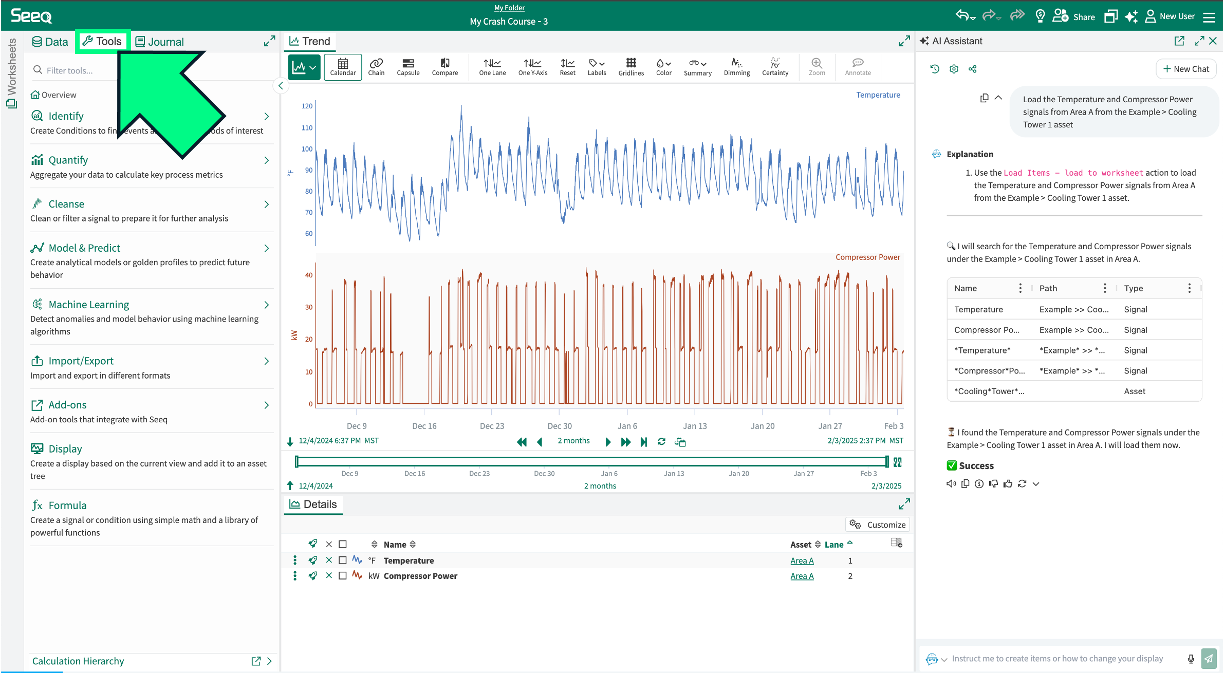
3. Find High-Temperature Periods |
The no-code Tools are organized by Analytics Skills (type of analytics):
Identify periods of interest/events
Cleanse data
Quantify
Model & Predict
Machine Learning
Formula (the calculation editor)
See "Full Training" on your homescreen to learn more.
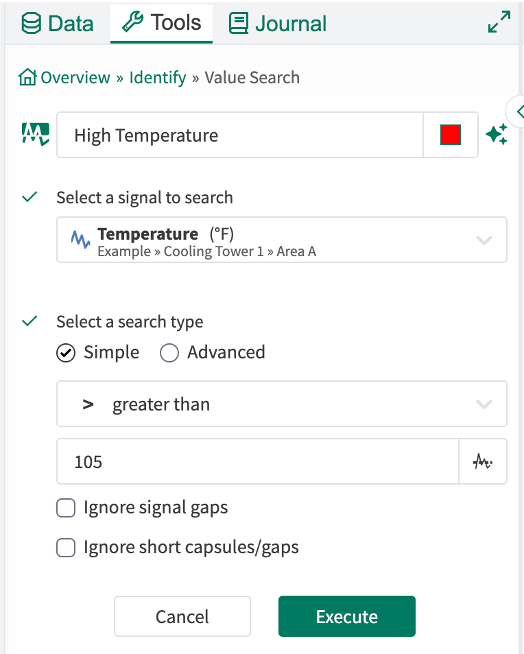
Let's identify High Temperature conditions in the system using the built-in Tools.
Ask General Agent: How can I find when temperature is above 105?
Follow the AI's instructions.
Check your work:
Click the Edit button by the new High Temperature condition in the Details pane should look like this:
What is a Condition?A Condition is a set of bars at the top of the trend that indicates when an event is occurring. 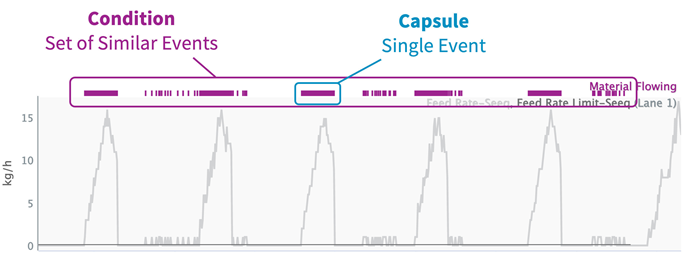 Ask General Agent: What are the different ways of identifying conditions? Ask General Agent: What are Conditions useful for? |
4. Send Notification |
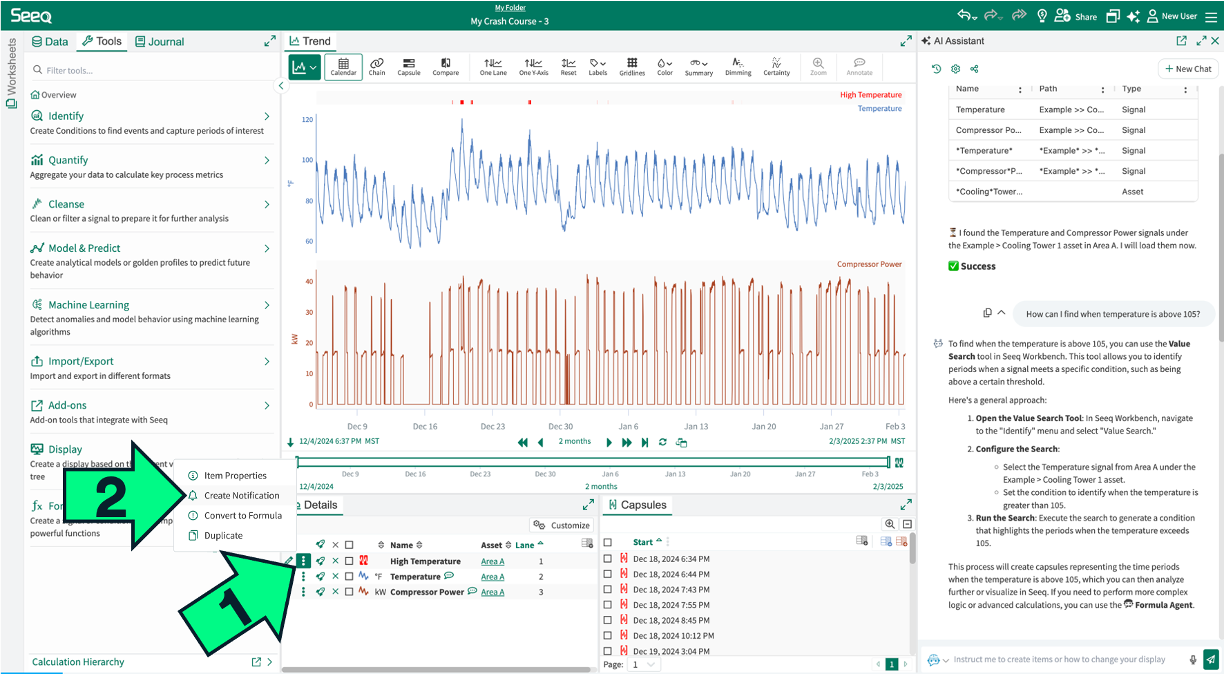
In the Details Pane, click the 3-dot icon by the High Temperature condition.
Then click Add Notifications.
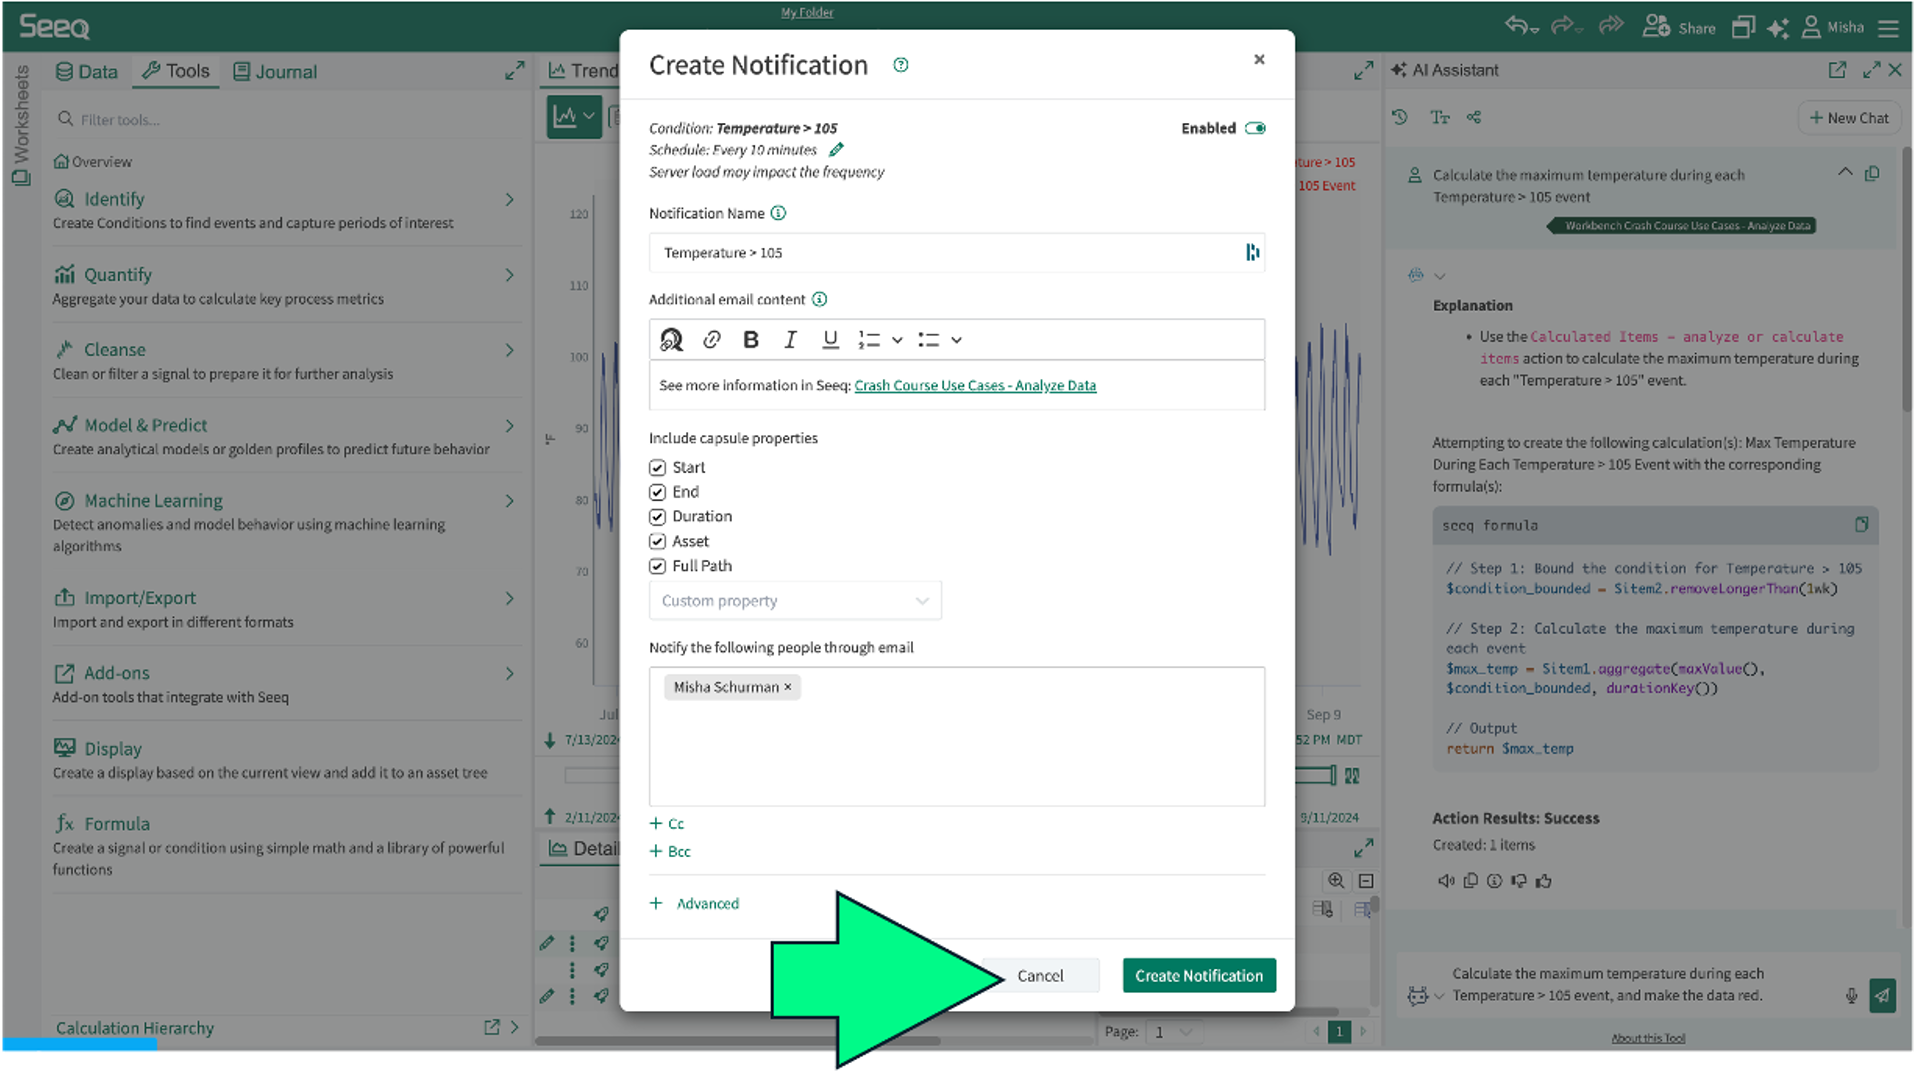
Fill out the form to send a notification to yourself.
Cancel the notification (you probably don't want emails about this example High Temperature condition).
5. Calculate Total Energy Use |
The Actions Agent can help with calculations, as well. To do calculations, AI uses Formula, Seeq's built-in function library (like the calculation bar in Excel, except with more functionality).
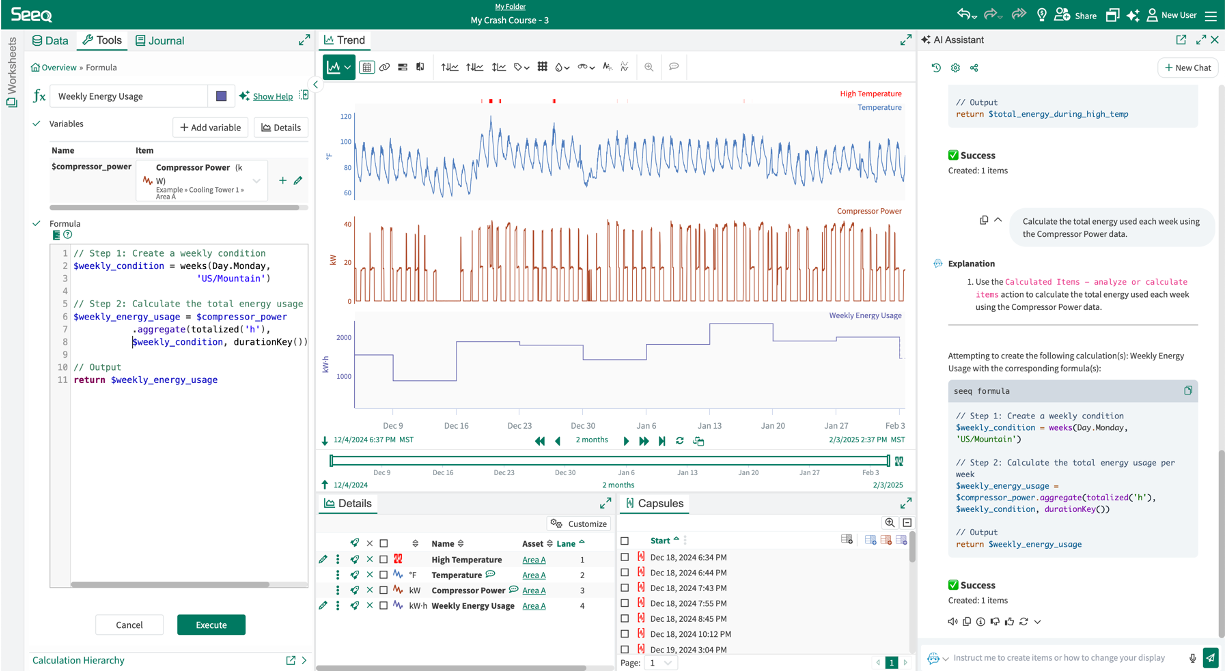
Use Actions Agent: Calculate the total energy used each week using the Compressor Power data.
Check AI's work:
In the AI pane, you will see the Formula with comments to explain what it does.
Check it: Click Edit by the new "Total Energy During High Temperature" signal in the Details Pane. It should look something like this:
PRO TIP: See bottom of Journal for AI Action logging with links to before/after this step. Ask AI General Agent: "What are Seeq links?". |
The End! What's Next? |
We recommend the full Foundations Analytics Skills Training to practice data cleansing, finding events and periods of interest, quantification, modeling & prediction, dashboarding, data viz, and more.
See your Homescreen for more info.