Tutorial: Create and Manage Statistics Summaries
In this tutorial we will learn how to create statistics summaries for a signal in order to track the behavior of the signal over time.
We will create daily averages of the investigated signal and execute the statistical analysis on a monthly basis.
1 - Prepare data
Load and prepare data for Statistical analysis. For this you will use tools you may already be familiar with in which case you can move on to section 2.
Load signals to investigate from the Data tab.
Change Display range in Trend view to include time range to investigate.
Optional: Depending on your process and data you may need to create Conditions - allowing analysis of one process stage, product type etc at the time.
If needed - create sub sets of data. Either by time using Identify > Periodic condition followed by Quantify > Signal from condition to calculate the statistic - i.e. average, range or standard deviation.
If you are comfortable with Formula a more efficient approach is to use Formula to create the subsets and calculate the wanted statistic in one go.
The AI Actions agent can also be used to execute the below or Formula agent for guidance.
Ex. 1: Periodic condition monthly, output daily average of $signal
// Step 1: Create a daily condition in CET time zone
$daily_condition = days('CET')
// Step 2: Calculate the daily average of the Temperature signal
$signal.aggregate(average(), $daily_condition, durationKey())
Ex. 2: Condition with defined sample set size, output range of $signal within each capsule
// Step 1: Create a condition where each capsule contains 10 samples from $signal, within a 1-day window
$condition_10_samples = $t.toCapsulesByCount(10, 1d)
// Step 2: Calculate the range (max - min) of the Temperature signal within each capsule
$signal.aggregate(range(), $condition_10_samples, durationKey())
AI prompts
Ex 1: Calculate daily average of signal
Ex 2: Calculate range of signal in sub sets of 10
2 - Create Statistics Summary
Create monthly statistics summaries.
Go to Tools > Statistics > Statistics Summary.
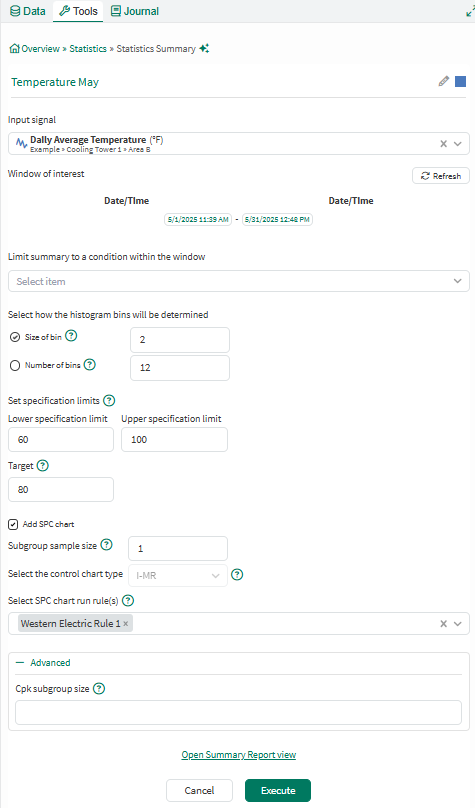
Set a name and select Input signal. Note that the Input signal should be the pre-treated one. In this case that will be Temperature Daily average.
Update the time range to cover a full month, for instance May 1st to 31st.
In this example we look at the overall temperature - not a specific product grade or process stage. Therefor there is no limiting condition.
Set a bin size of 2 - adjust depending on range your input signal.
Define specification limits if available. For the example signal use Lower specification limit = 60, Upper specification limit = 100 and target = 80.
Specification limits are optional. If not provided Ppk cannot be calculated.
Select which SPC chart to add, if any (optional) and apply optional run-rules. Here Western Electric rule 1 was selected.
Execute.
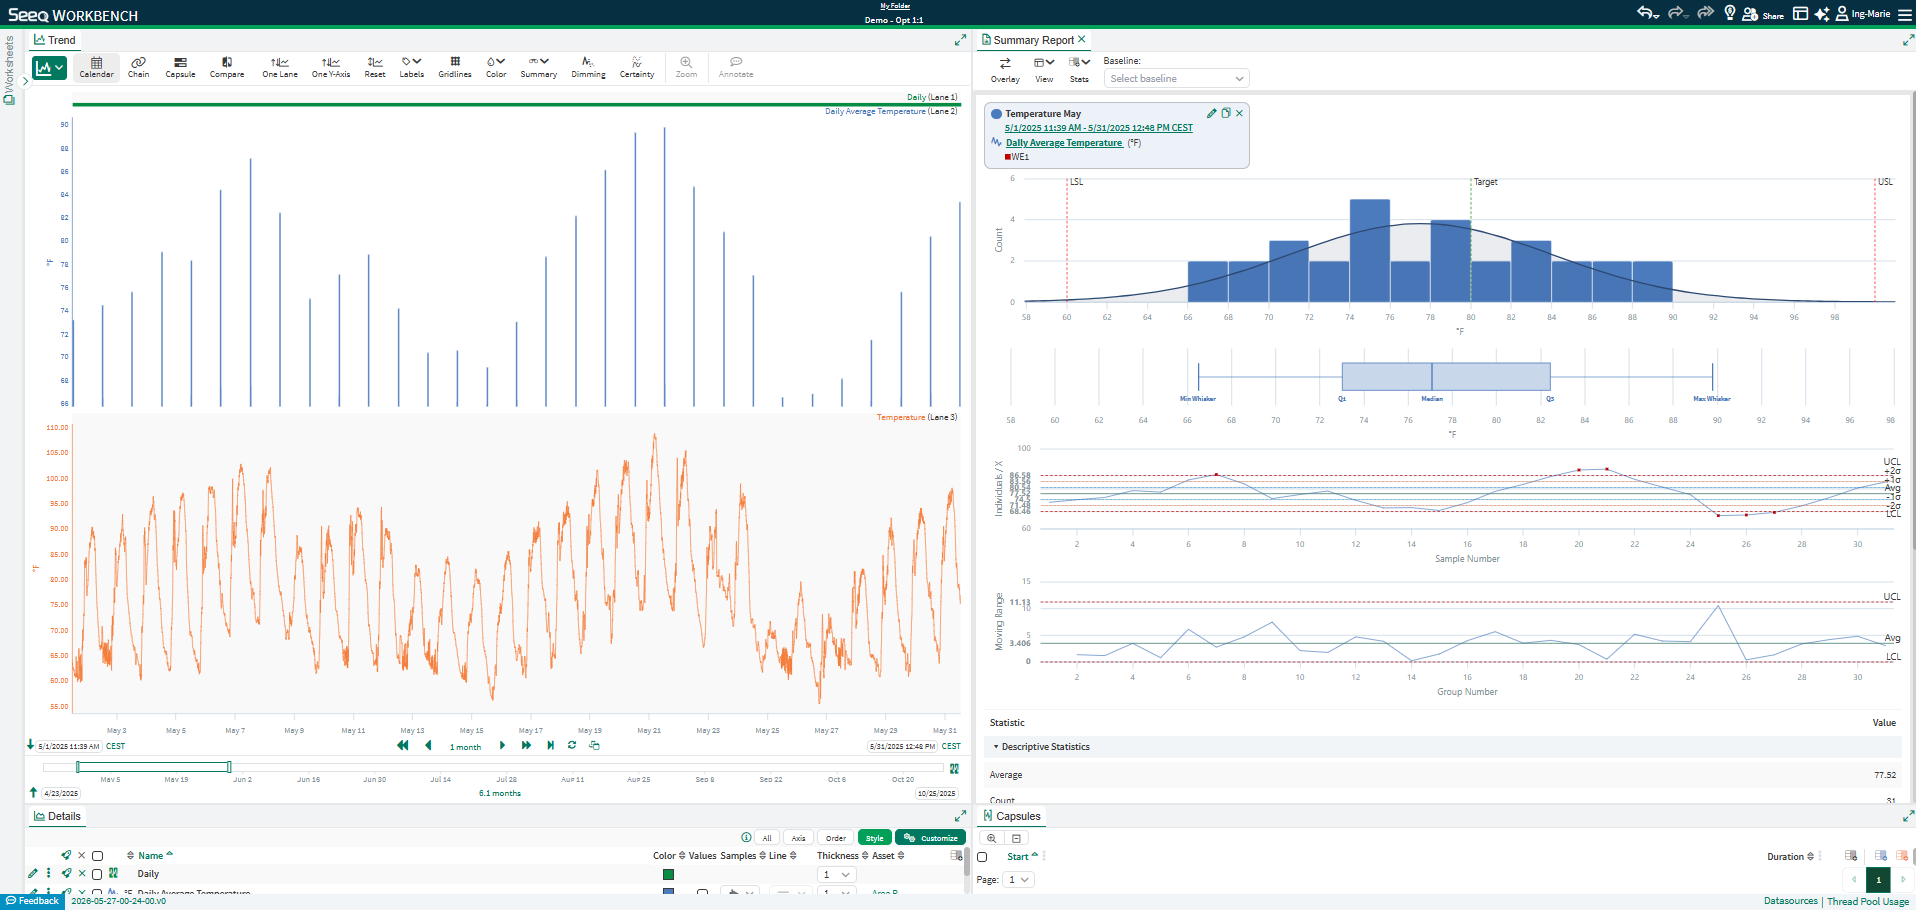
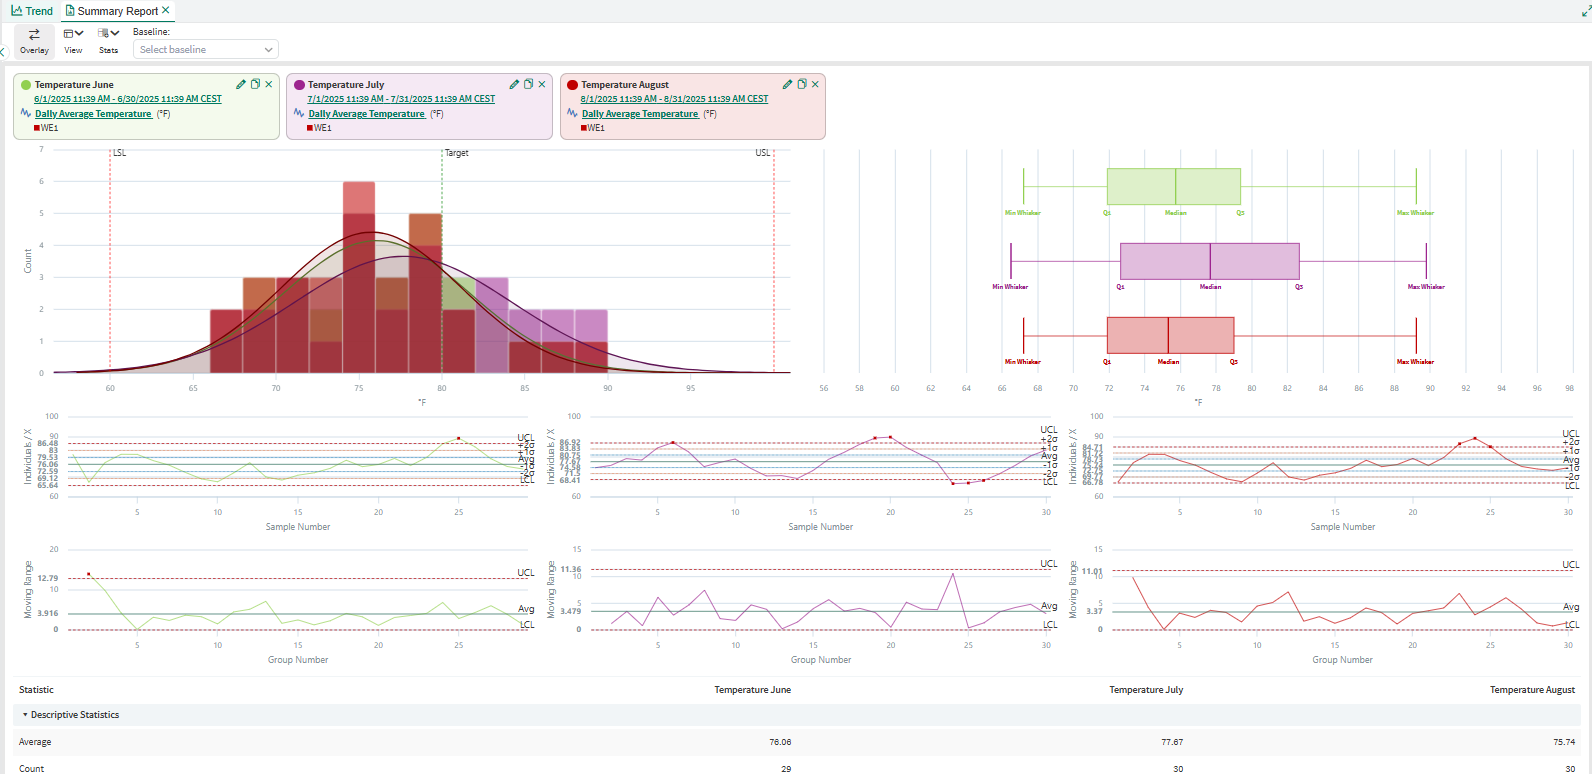
The Summary Report view opens up with the created Statistics Summary displayed. The Summary Report tab can be moved so that Trend view is shown at the same time. Scroll down in the Summary Report view to see the complete table of outputs.
At the top of each open Statistic Summary there is a card with information about the statistic summary. From here you can also edit, copy or close the Statistic summary.
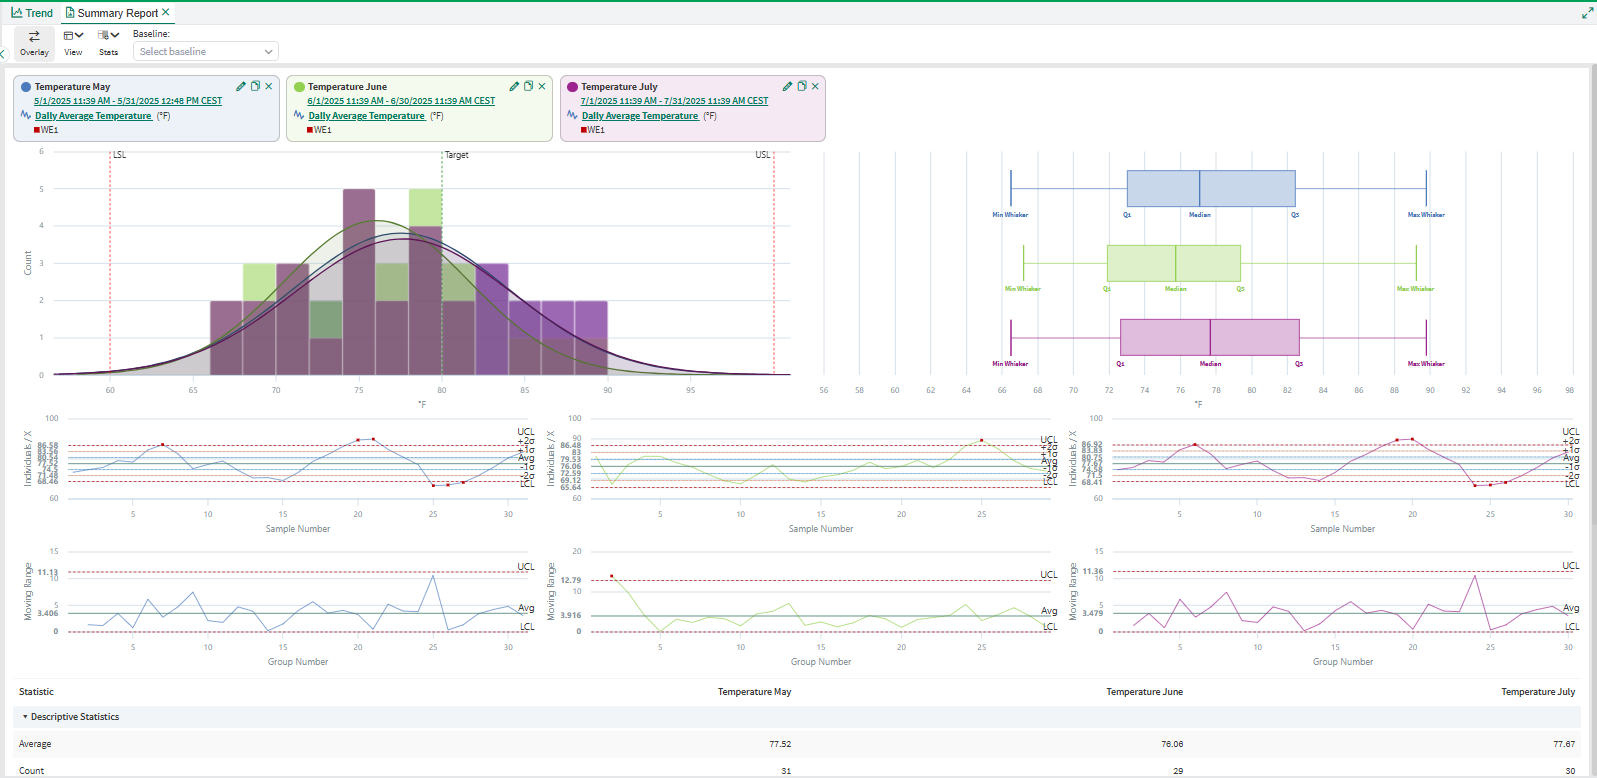
Create Statistic Summaries for the 2 following months. The quickest way to do that is to copy the current Statistic Summary using the copy icon, update the Window of interest and execute. For more information on how to Copy see KB.
As each Statistics Summary is created it is added to the Summary report. Use Overlay by clicking the Overlay button in the toolbar to get a summarized view of the open Statistic Summaries. Scroll down in the Statistics table to see how properties of the data change over time.
3 - Insert into Organizer topic
Open / Create the Organizer topic.
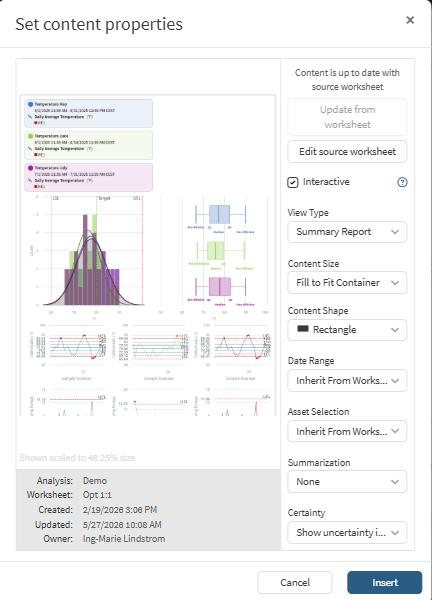
Select Insert Worksheet, Vantage or Link. Select the Analysis and Worksheet containing your Summary Report.
In the Set content Properties the preview pane shows which of the views in the Worksheet that will be inserted. If you see the Trend view and wish the Summary Report, change the View Type to Summary Report.
Set Content Shape to Fill to fit Container and make sure the complete view is represented in the preview pane.
Insert and edit as required.
4 - Update report
Another month has passed and shall be added to the report and the oldest month removed.
Create Statistic Summary for latest Month
Open Worksheet and create a Statistics Summary for the latest month. Either from scratch or by copying one of the previous Statistics Summaries. Those can be copied from the Summary Report view Or Tools > Statistics > View Statistic Summaries. Note that Statistic Summaries cannot be copied from the Summary Report view while in Overlay mode.
Adjust Summary Report view
Close the first Statistic Summary from The Summary Report so that the latest 3 months are visible. Move to Overlay mode.
Update Organizer topic
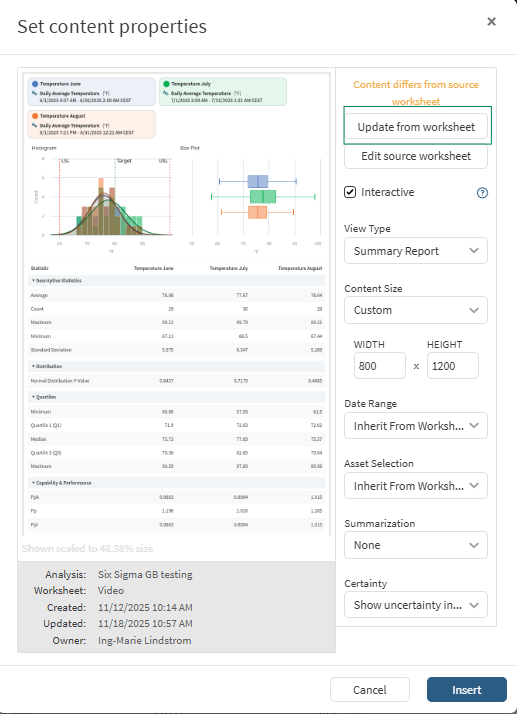
To update the Monthly report in Organizer topic to include the latest 3 months - Select Update Seeq content and click Update from Worksheet.
5 - Test for equal means and variances
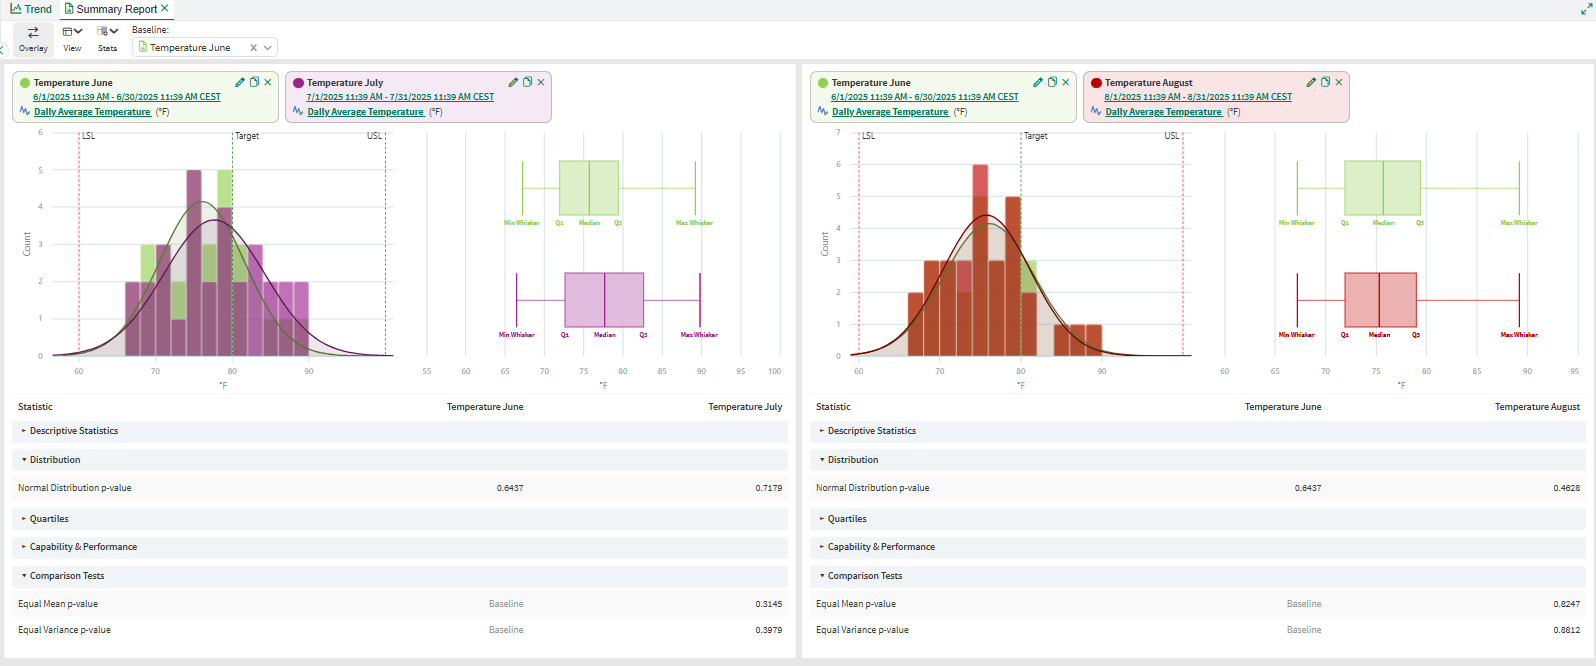
Seeq support t-test for equal means and F-test for equal variances. To execute a test, select a Baseline Statistic Summary from the Summary Report Toolbar. Here we select Temperature in June.
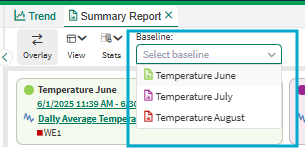
When a Baseline is selected, the view will split out into pairwise comparisons and the results of the comparison tests shown in the Statistics table. Here each section in the table has been collapsed which is done by clicking the arrows on each section header in the table.
Note that comparisons can only be done on comparable signals. For more info see Knowledge base on Comparable Summaries.