Compare View
Basics
Compare View overlays the capsules within your conditions and separates them by a property so that the signals are realigned at the start of each property. This allows you to compare one or more signals within capsules that have the same property.
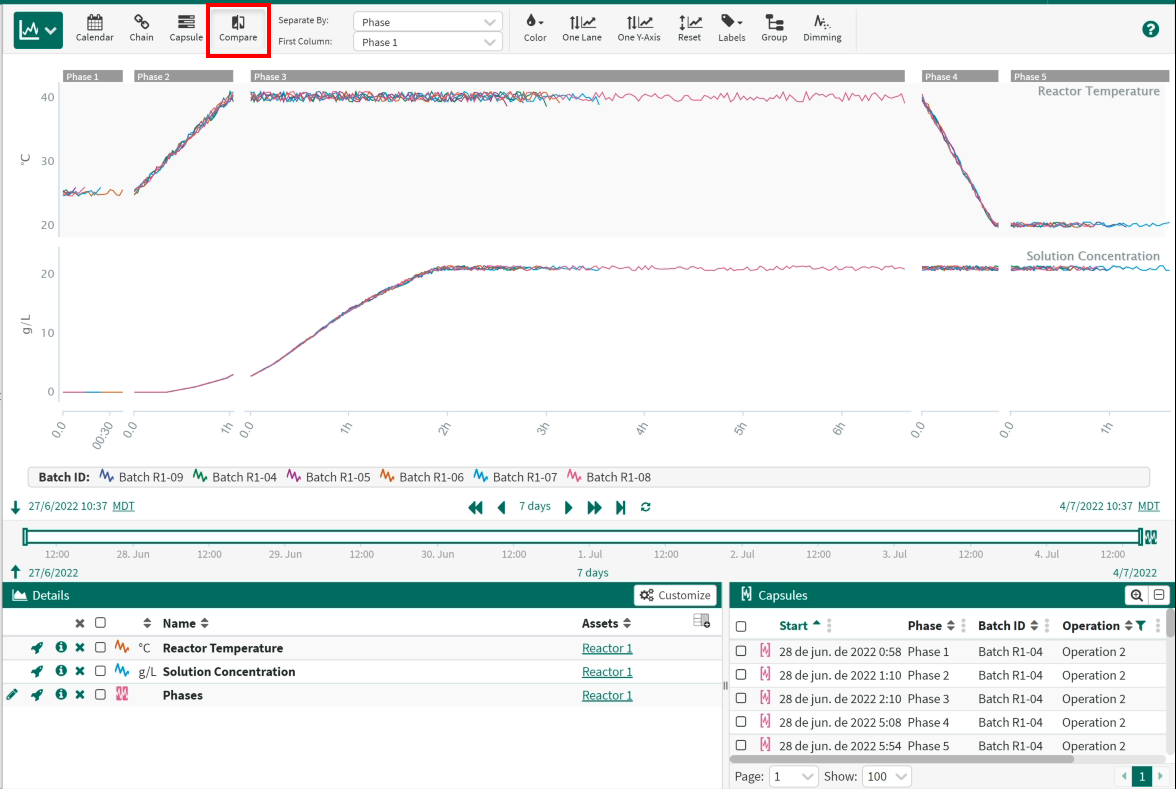
In this mode, all time shown on the x-axis is relative to the start of a capsule. This view requires that one or more conditions with one or more properties and one or more signals be present in the Details pane. To enter compare view, click the Compare icon in the upper left-hand side of the display pane.
Example use cases
Compare data across batches where each phase or operation could vary in length of time.
Entering Compare View
Separating by properties
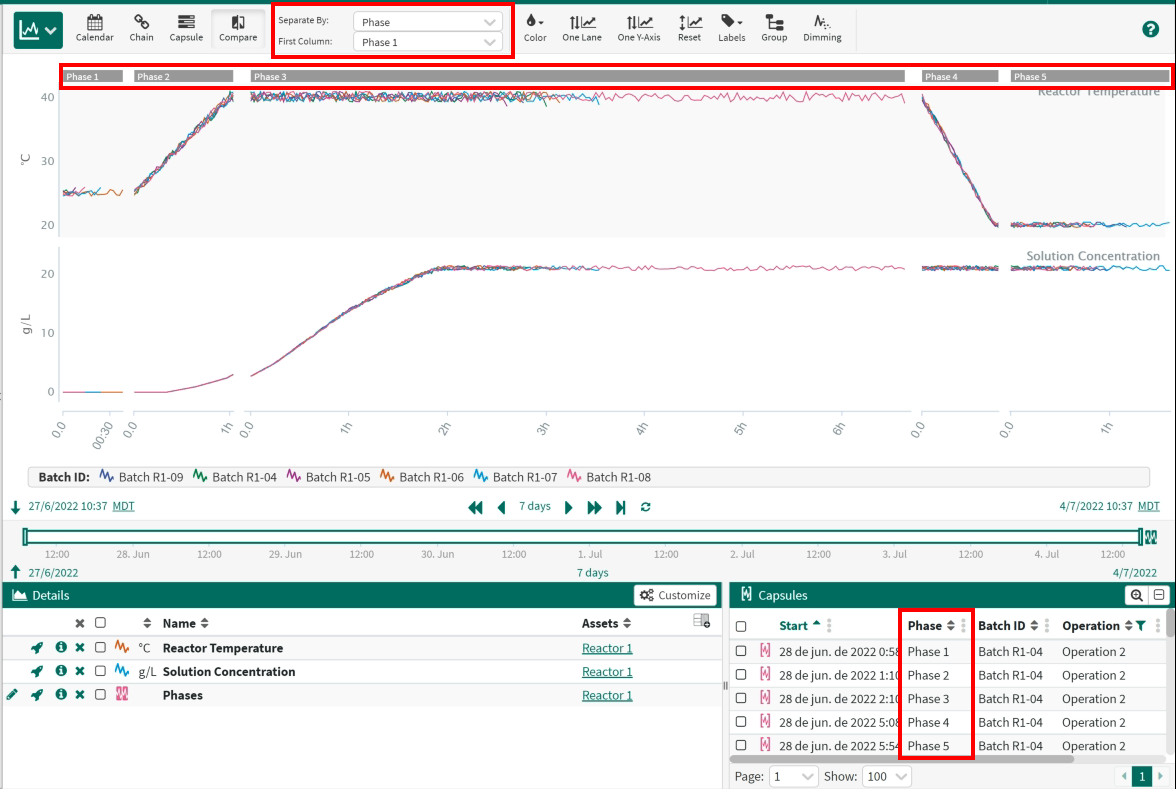
If you already have a condition with at least one property, a property will be autofilled in the Separate By dropdown. You can change this property by clicking the dropdown at the top of the screen. Capsules with the same value for the selected property will be overlayed on top of each other. The x-axis will be reset to 0 at the beginning of each unique value. The property values can be seen across the top of the screen. The order is set by the order they appear in the capsules pane. The first column can be set by the dropdown at the top of the screen.
Note: If you do not have a condition with properties you can easily make one from string signals using the Condition with Properties tool.
Separate By
Coloring Options
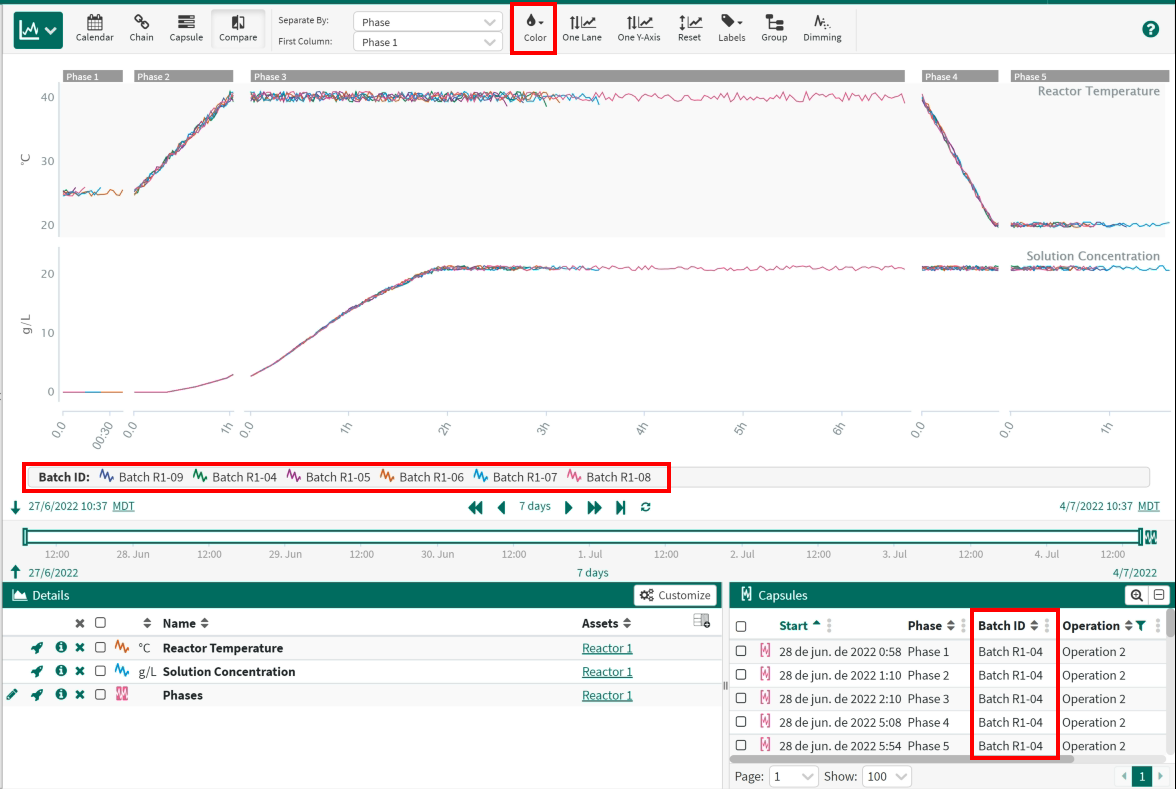
By default, Compare view is rainbow colored by a property. You can change which property is used for coloring or switch to coloring by signal using the Color option in the top toolbar. Rainbow will apply a distinct color for each unique property value so that it is easy to visually distinguish data from different capusles.
Coloring Option
Grouping Signals to Conditions
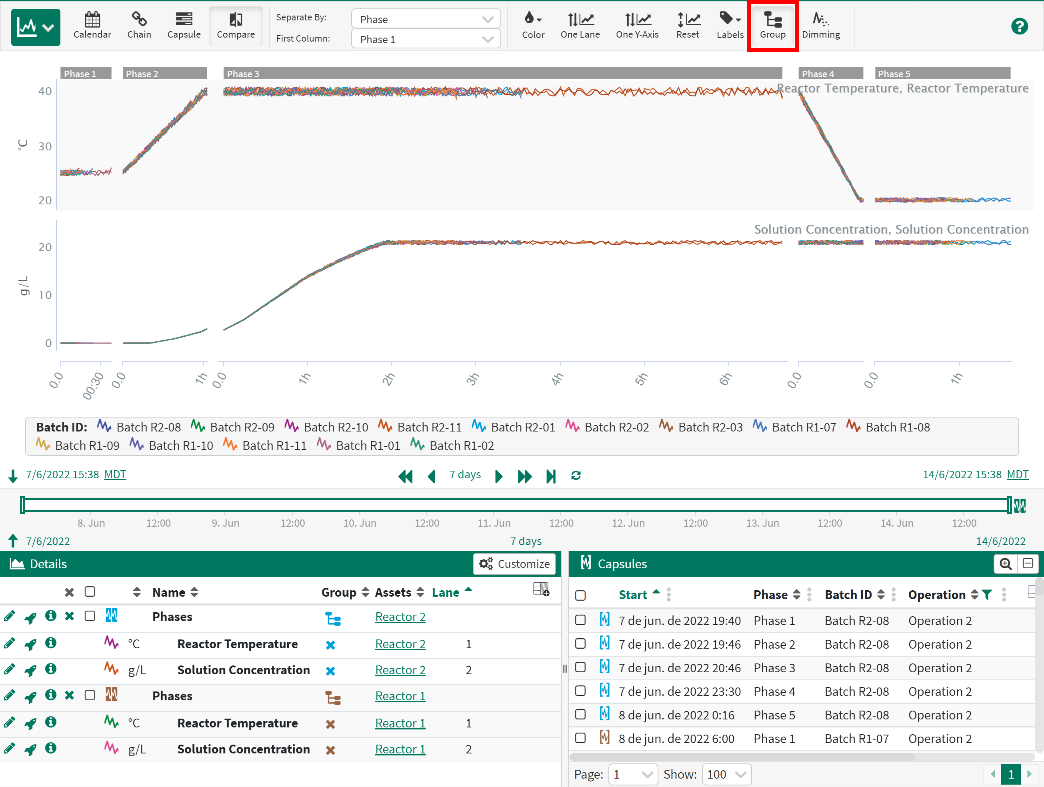
Grouping a signal with a condition will only display that signal during the grouped condition. This is helpful when multiple conditions are present but a signal only applies to a subset of the conditions.
To use Grouping, click the Group button in the toolbar.
This will update the Details pane to show only the conditions available in your worksheet.
Then click the Group icon button in the Details pane to assign the desired Signals.
R54 and newer: When the toolbar Group button is enabled, then any condition in the details pane that has no grouped signals will be automatically grouped with signals in the details pane that share the same parent asset. Additionally, any new signals or conditions that are added to the details pane will be automatically grouped if they share the same parent asset.
Grouping Signals to Conditions in Capsule Time
Filtering the Capsule Pane
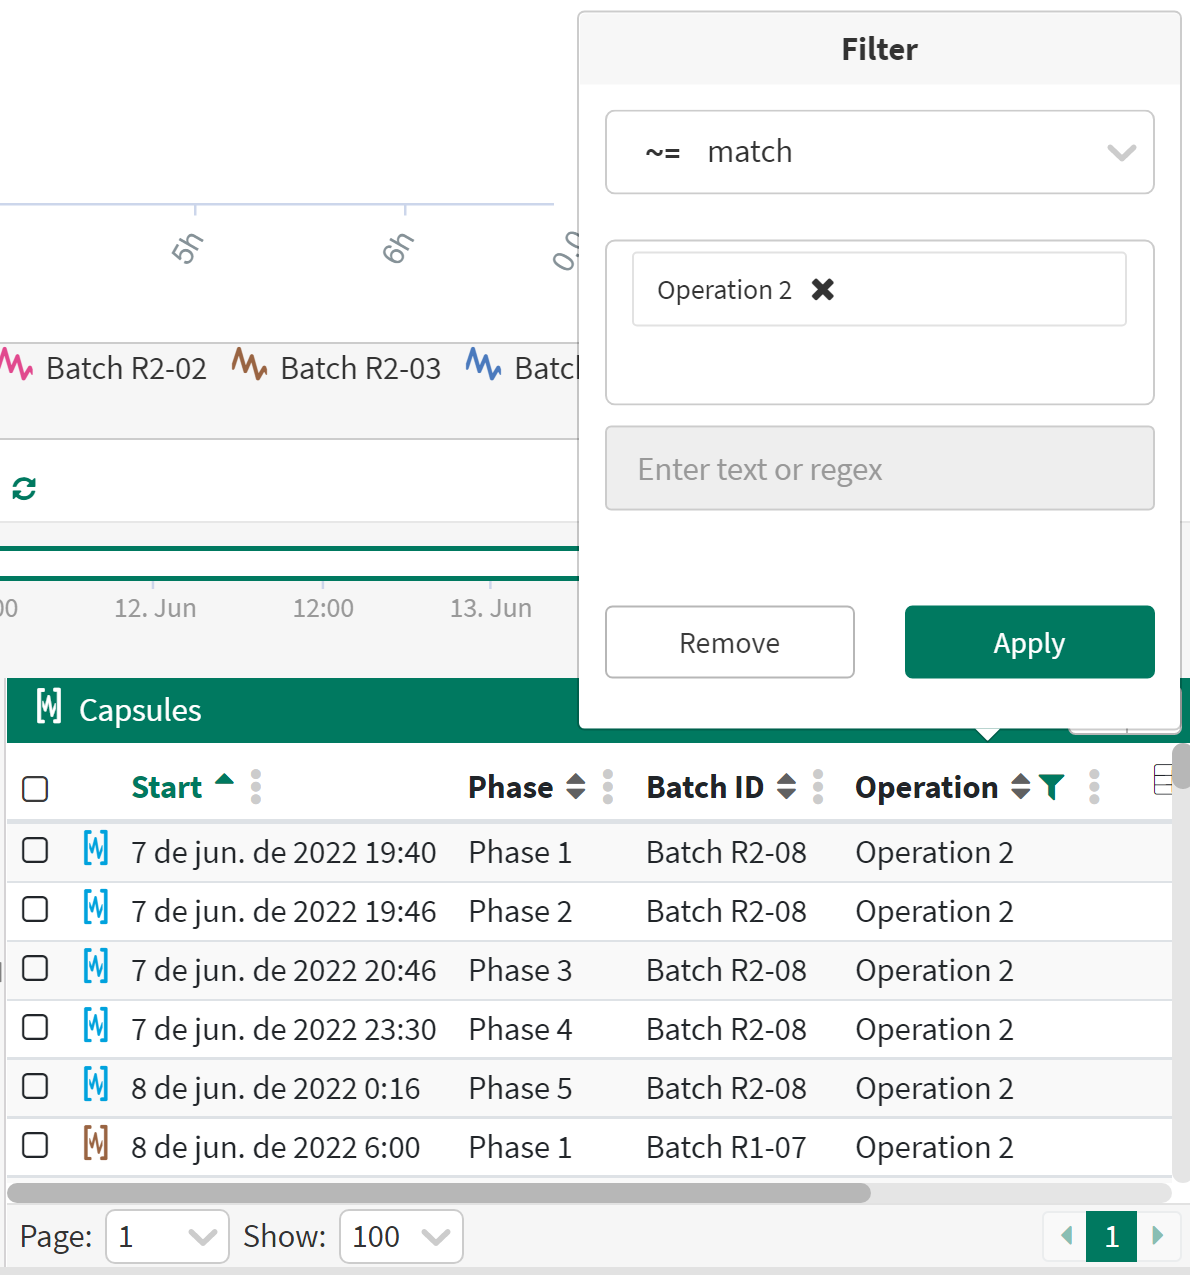
Most columns in the Capsules Pane can be used to filter the capsules in the display. Access the filter from the three dot menu in the header of the Capsules Pane and apply numeric or text filters to focus on a subset of any condition(s). This is a visual filtering only, and the results of subsequent calculations depending on the condition are not filtered. This will also apply when switching to other views.
Filtering the Capsule Pane
