Champion Dashboard Add-On – Quick Reference
Source of Truth:
The complete documentation is available in the official Champion Dashboard User Guide.
This page provides a concise overview of features, setup, and usage for Seeq users and administrators.
Overview
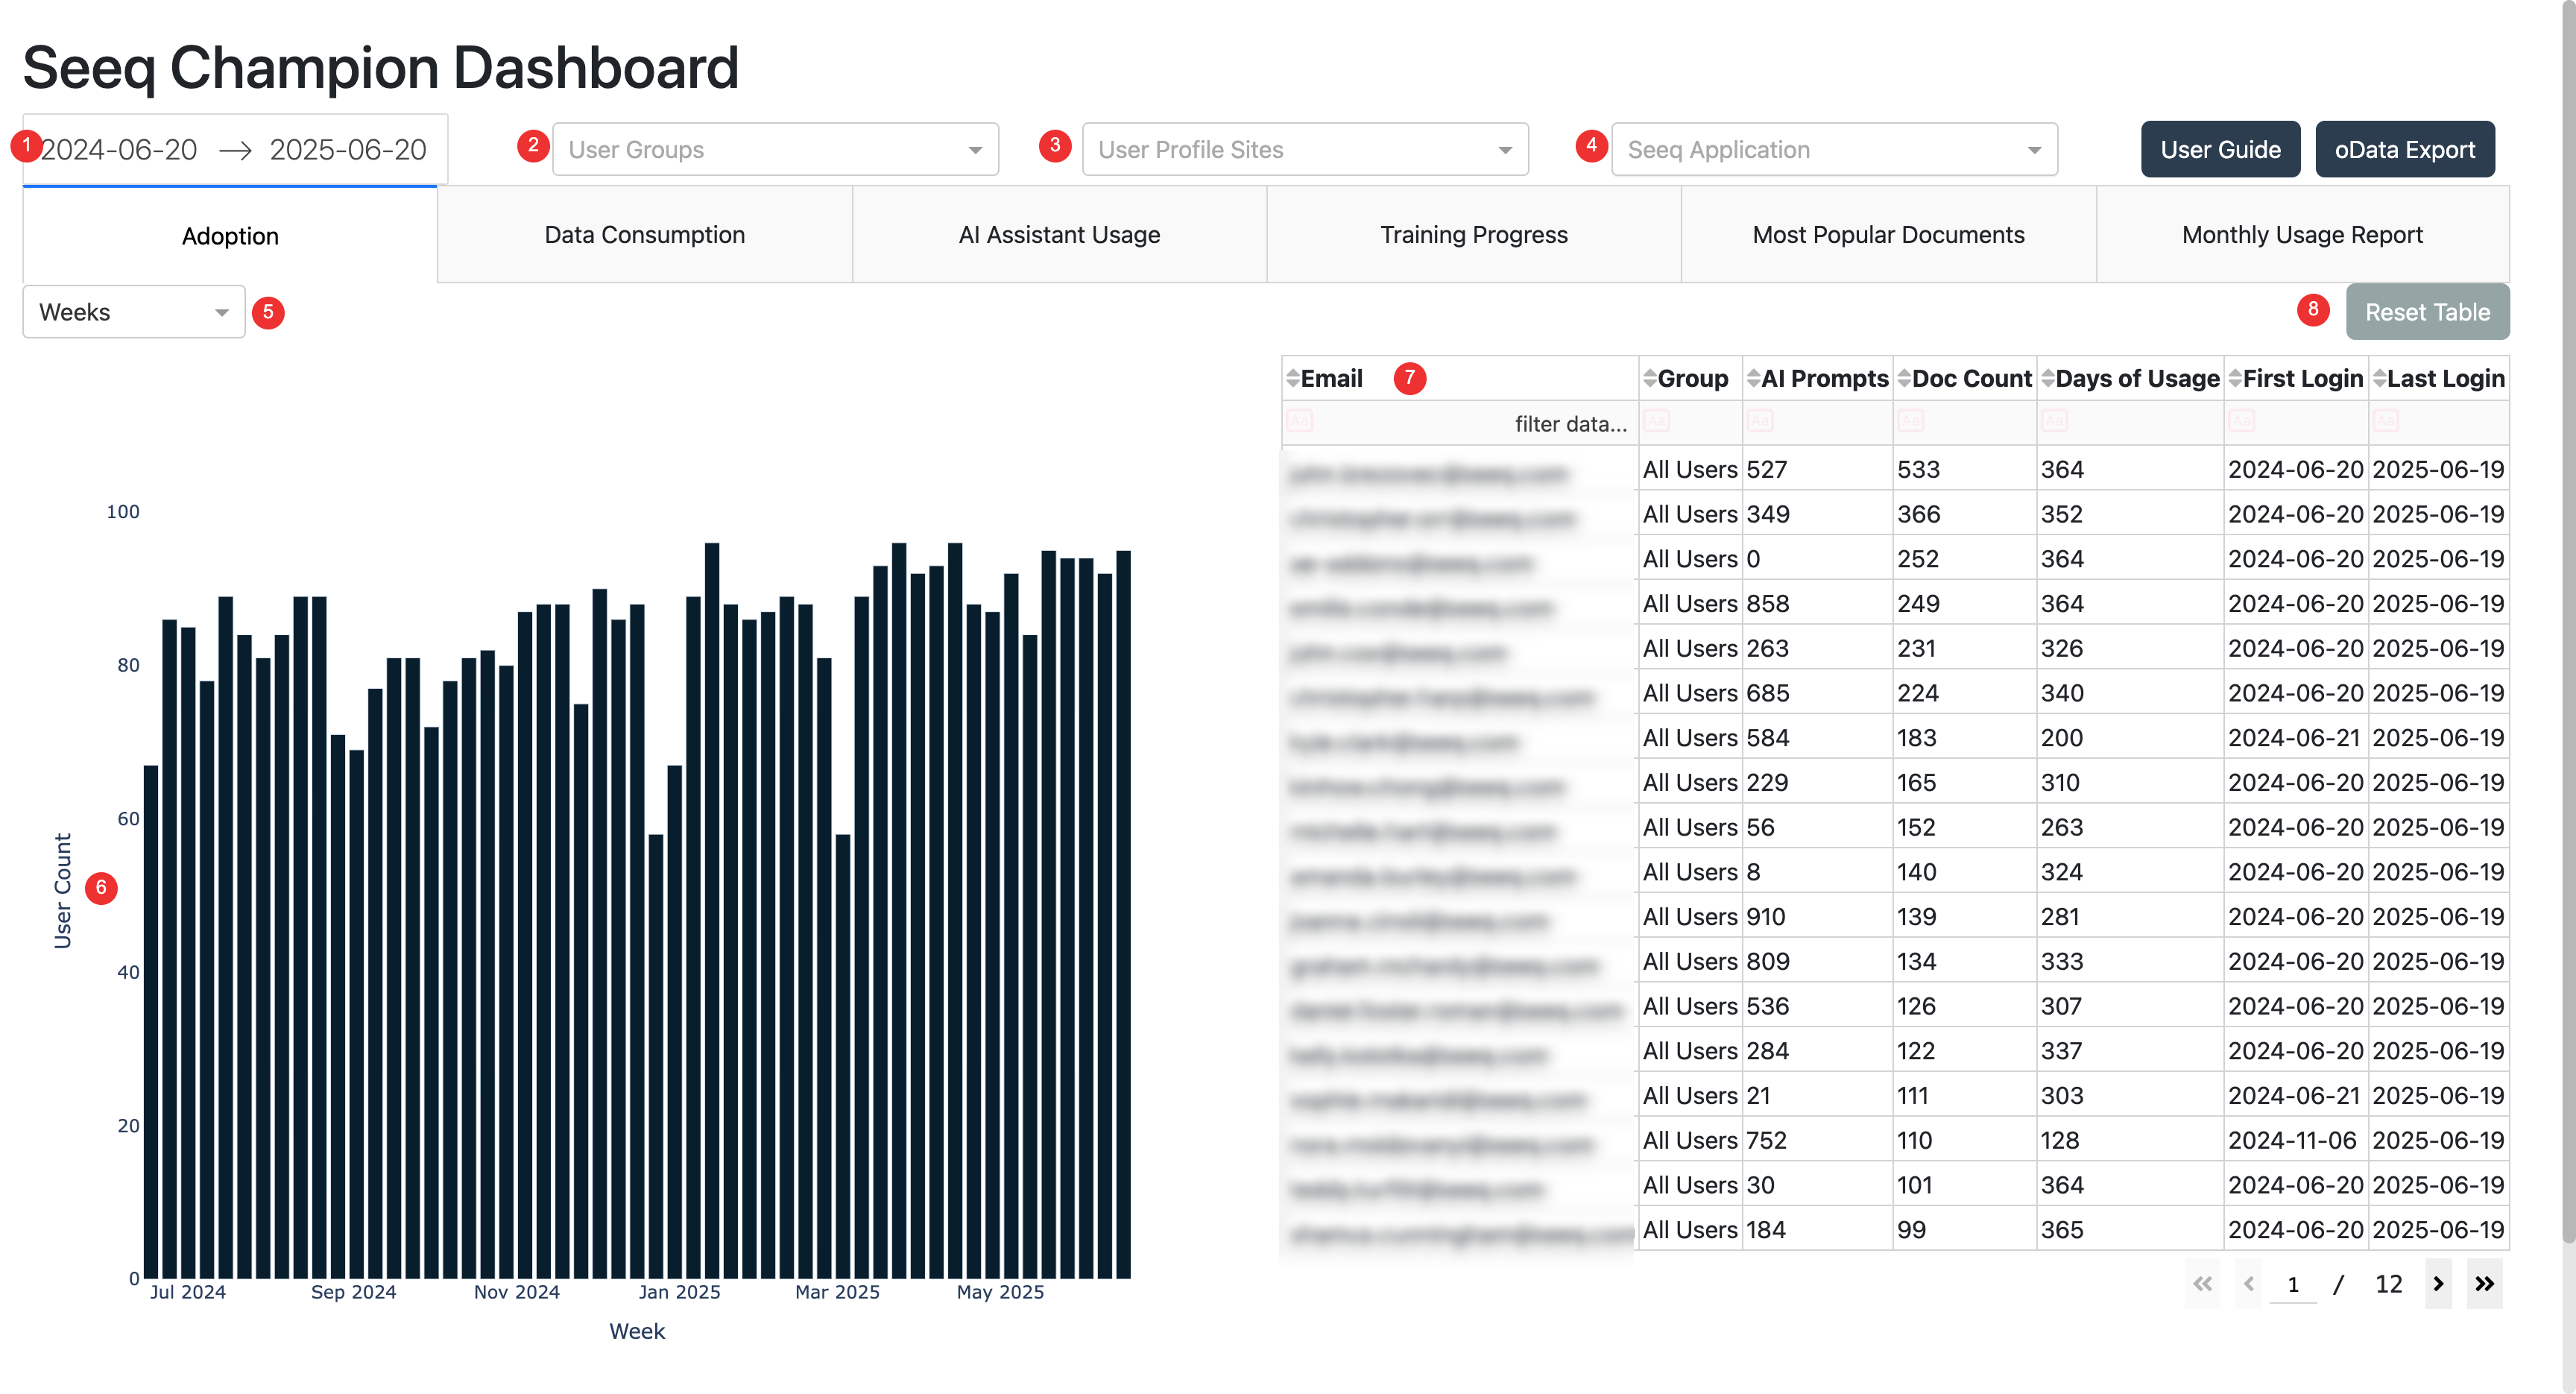
The Champion Dashboard Add-On provides visibility into Seeq usage, adoption, training progress, AI Assistant activity, and document engagement across your organization.
It helps administrators and Seeq Champions measure how users interact with the platform and identify engagement opportunities.
Installation & Setup
Install via the Seeq Add-On Manager
First-time launch must be performed by an admin; initialization may take up to 20–30 minutes.
Admins can configure:
Email anonymization
OData export toggle
Export folder locations
Access defaults to admins; visibility for other users or groups can be granted via configuration.
📊 Dashboard Tabs & Features
Tab / Feature | Purpose | Notes / Constraints |
|---|---|---|
Adoption | Tracks number of unique users over time. | Filter by group, site, and application. |
Data Consumption per Week | Shows amount of data consumed (e.g., GB). | Uses same filters and time-granularity options as Adoption. |
AI Assistant Usage | Displays user prompts and token activity. | Helps track adoption of Seeq AI Assistant. |
Training Completions | Tracks learning progress and course completions. | Available for SaaS customers only. |
Most Popular Documents | Ranks documents (Workbench, Topics) by unique viewers. | Identifies high-value or frequently accessed documents. |
Monthly Usage Report | Provides a trailing 12-month summary across applications. | |
OData Export | Exports dashboard data for BI tools (Power BI, Tableau, etc.). | Large dataset (~millions of rows possible). |
Using the Dashboard
Launch from the Seeq Home Screen or Tools → Add-Ons menu.
Use interactive filters (time range, user group, site, application) in most tabs.
Click bars or data points in charts to filter associated tables.
⚠️ Known Limitations
Usage hours per user/document are not tracked.
Older Seeq versions (pre-2024) may undercount document viewers.
OData exports can be large due to day–user–source granularity.
📘 Limitations & compatibility →