Chain View
Basics
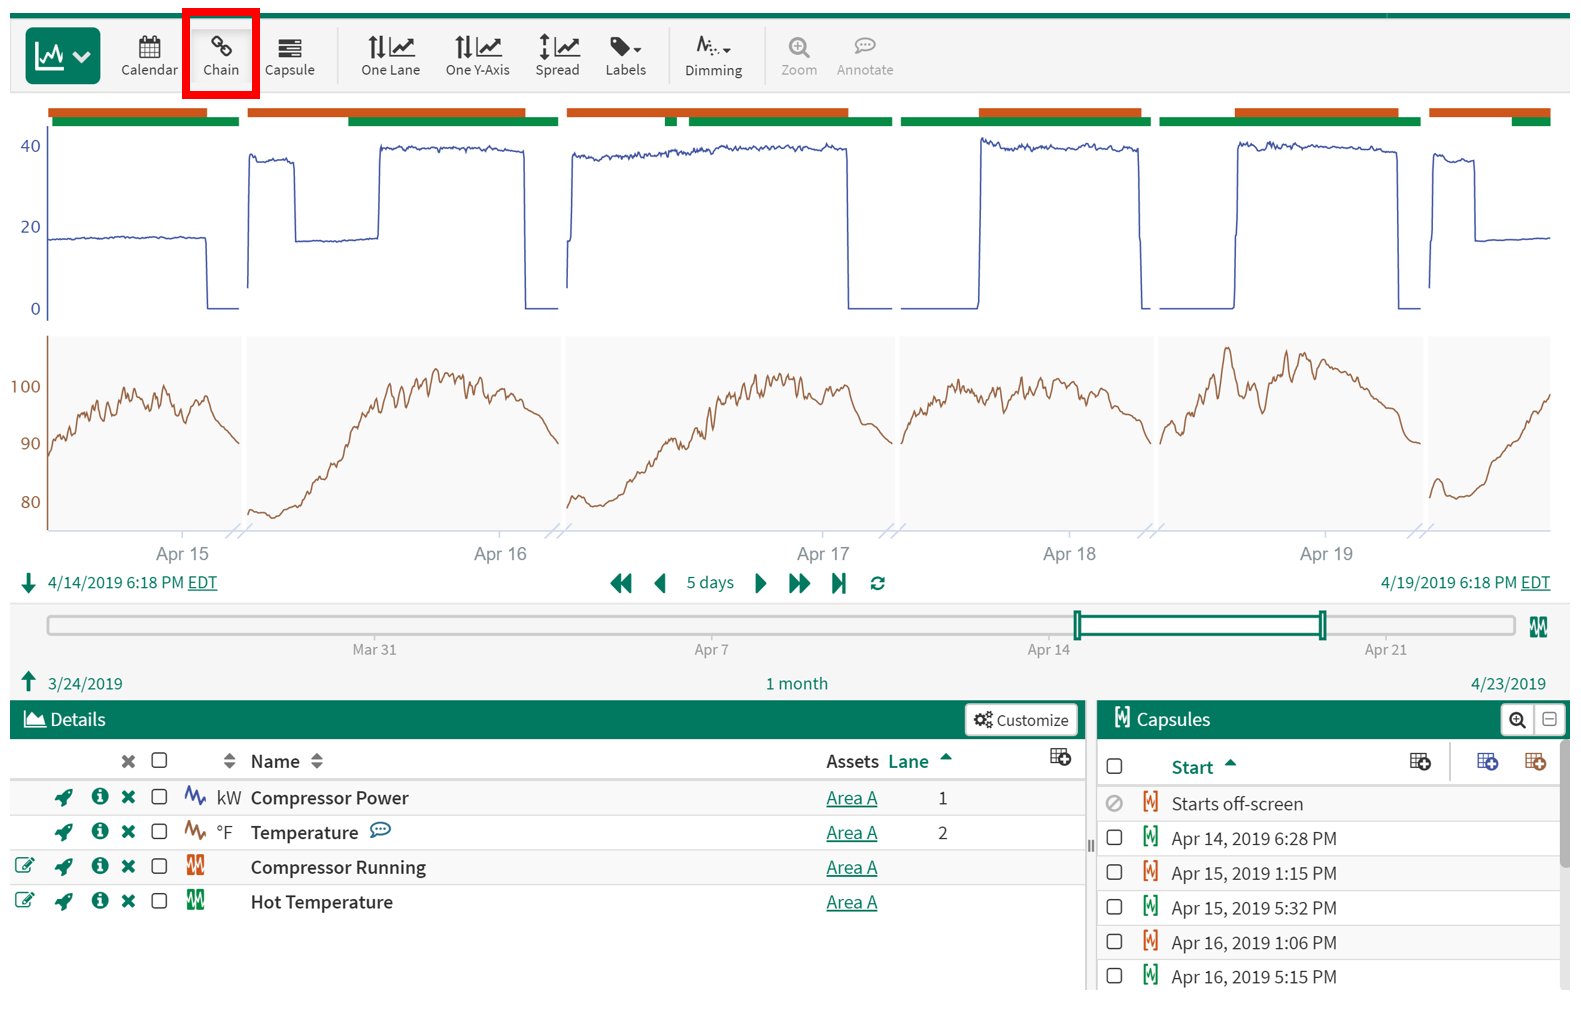
Chain view filters the trend to only display signal periods during conditions of interest. This view requires that one or more conditions and one or more signals to be present in the details pane. To enter into chain view click the Chain icon 
Example use cases
Create a condition for machine startups and using chain view visualize the last 5-10 startups. This view will eliminate all of the steady state behavior.
Create a condition for when a machine is running a particular product code using Value Search. Filter all trends using chain view to just show process signals while producing that particular product.
Entering Chain View

Sub-Filtering to Selected Conditions

Sub Filtering Within Chain View
Inside of chain view you can further filter your trend to specific conditions or capsules. Chain view will only display capsules which are currently listed in the capsule panel.
Sub-Filtering to Selected Conditions
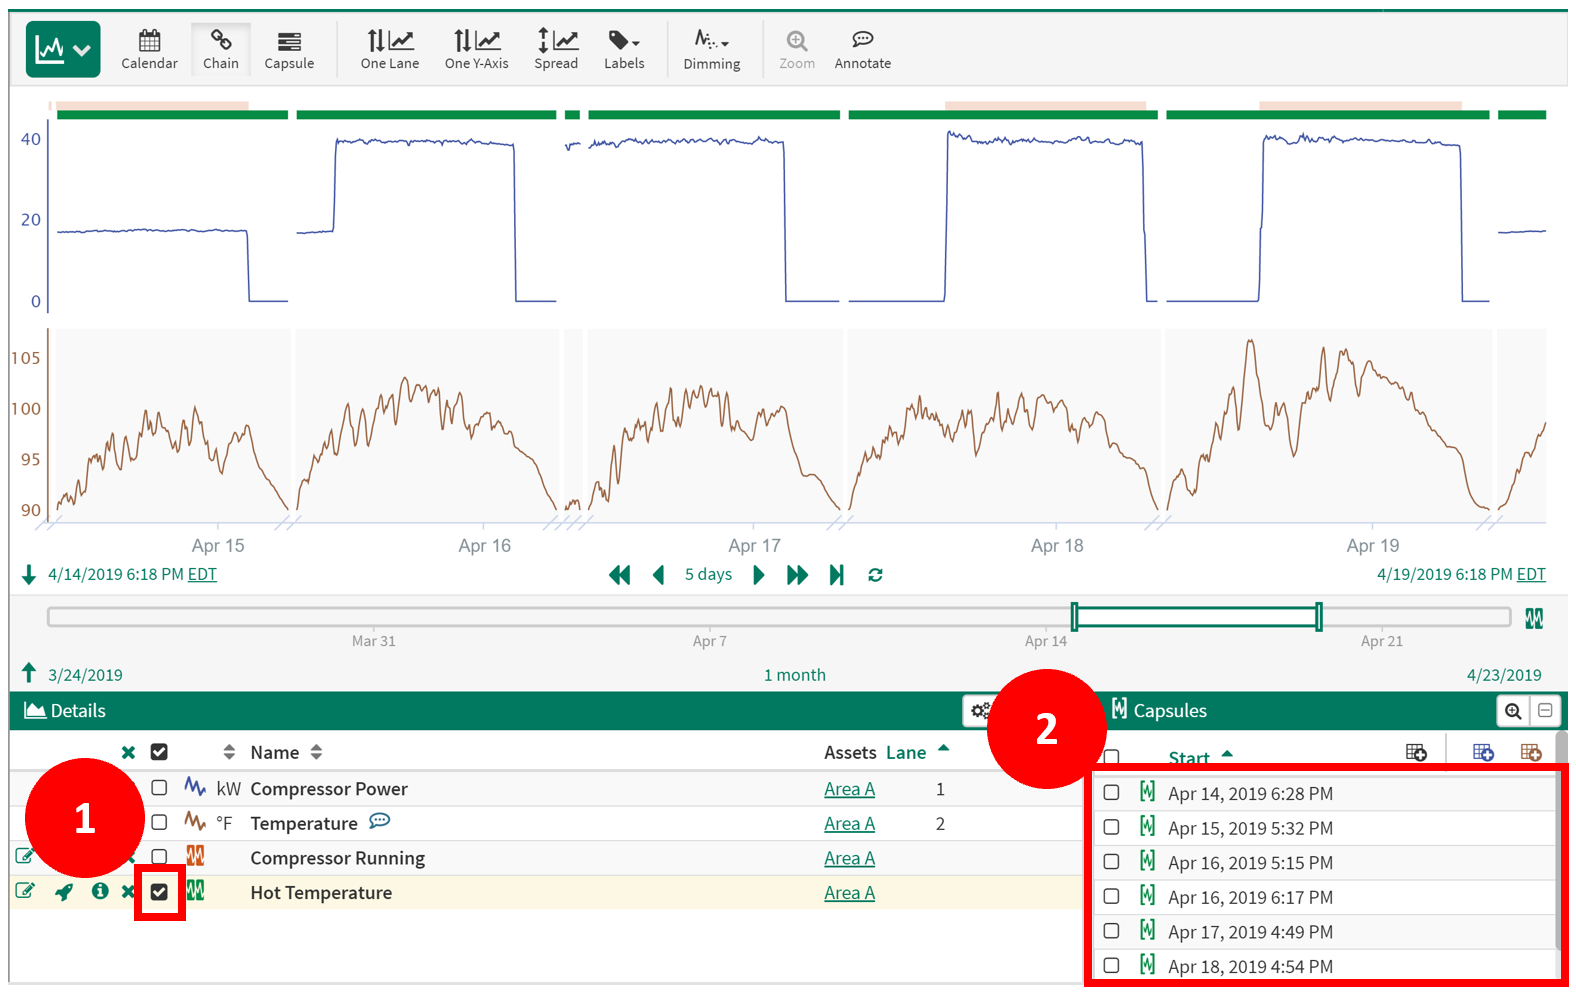
By selecting a condition in the details pane (check the box next to the item as shown in step 1 of the screenshot to the right), the capsules pane is filtered to just show capsules from the Hot Temperature condition (step 2). This filter also applies to the chain view plotting and now the trend only shows times when it is Hot Temperature.
Sub-Filtering to Selected Capsules

Sub-Filtering to Selected Capsules
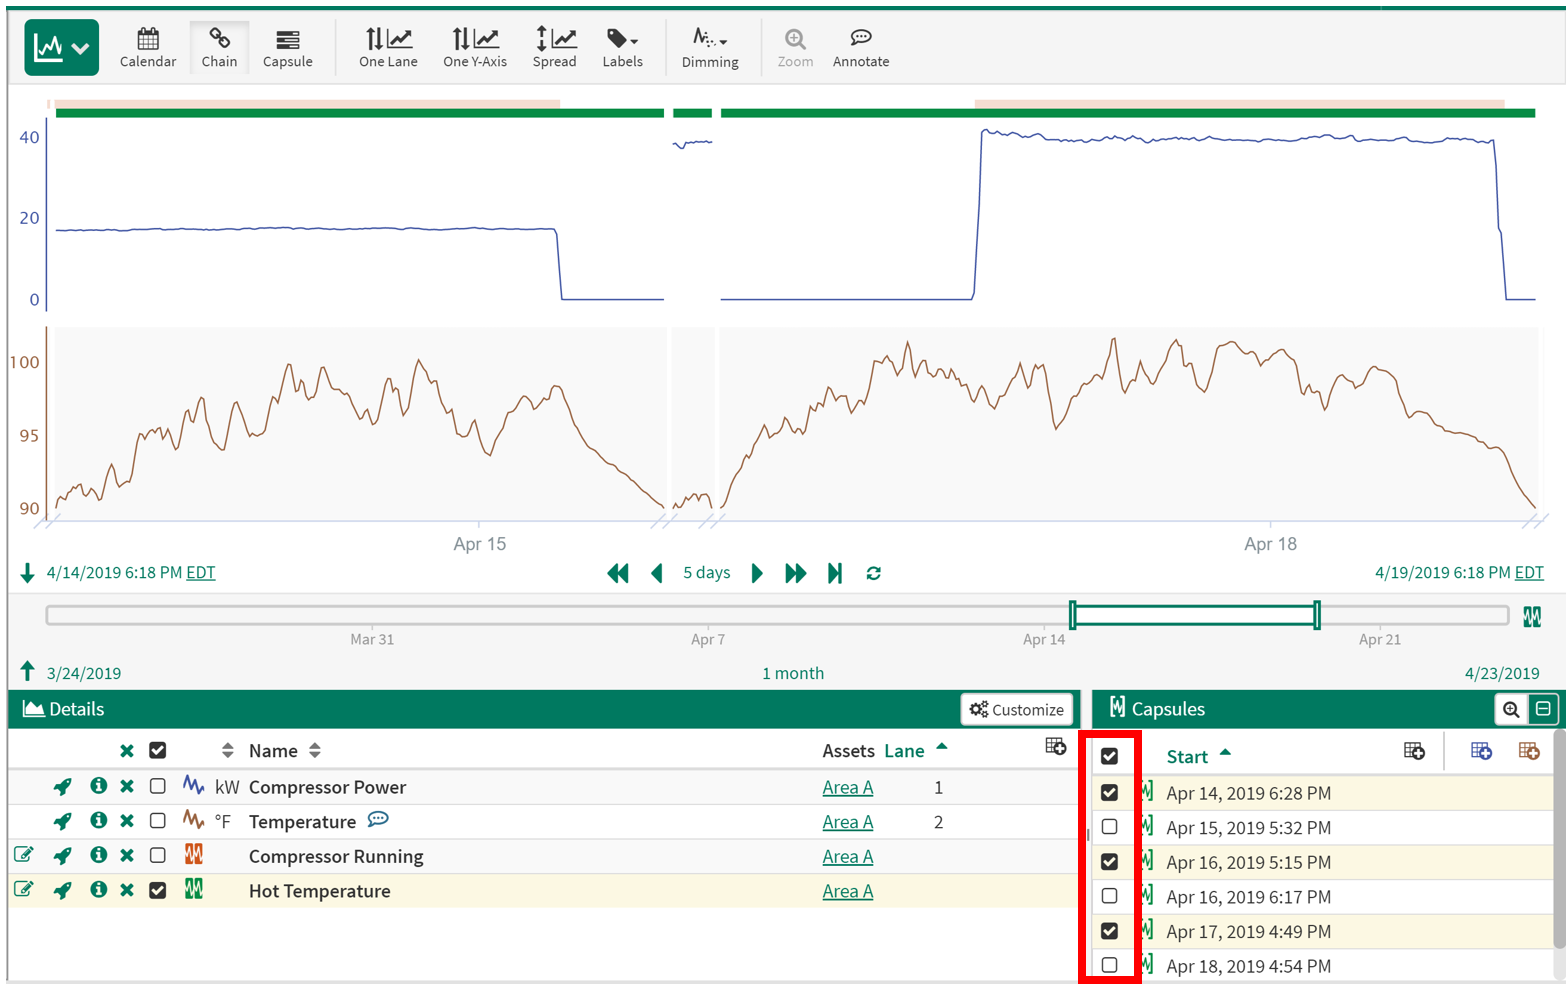
The same filtering principles apply to individual capsules. To filter your signals down to specific capsules select them by clicking the capsule start time. This selection also applies to the chain view plotting and now the trend only shows the three particular capsules from the Hot Temperature condition.
Grouping Signals to Conditions
Grouping a signal with a condition will only display that signal during the grouped condition. This is helpful when multiple conditions are present but a signal only applies to a subset of the conditions.
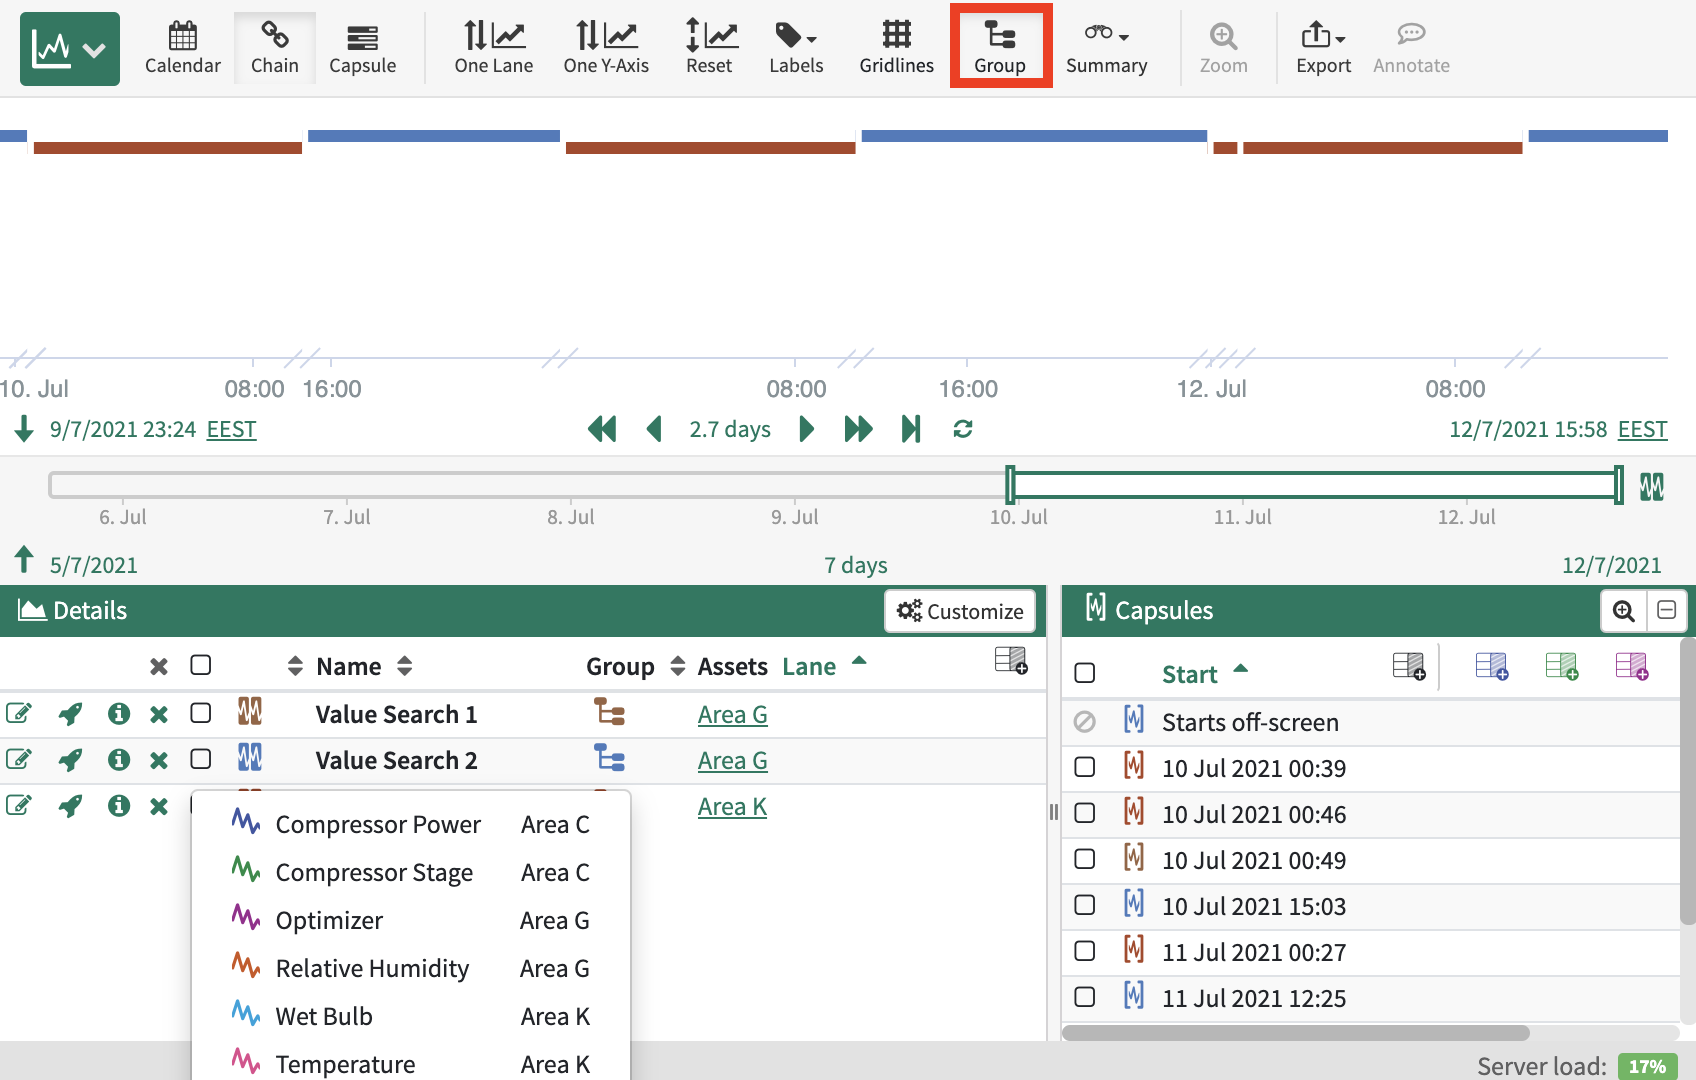
To use Grouping, click the Group button in the toolbar.
This will update the Details pane to show only the conditions available in your worksheet.
Then click the Group icon button in the Details pane to assign the desired Signals.
When the toolbar Group button is enabled, then any condition in the details pane that has no grouped signals will be automatically grouped with signals in the details pane that share the same parent asset. Additionally, any new signals or conditions that are added to the details pane will be automatically grouped if they share the same parent asset.
Grouping Signals to Conditions

