Export to OData
Overview
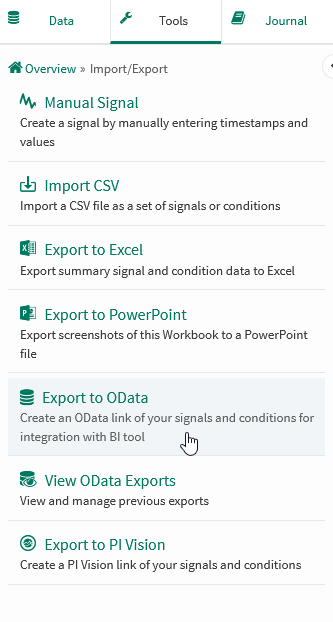
Seeq has an OData export feature that allows trends and calculations to be exported to Spotfire, Tableau, or Microsoft applications Excel and Power BI.
OData exports can be read directly by these software programs for use in dashboards or for further analysis.
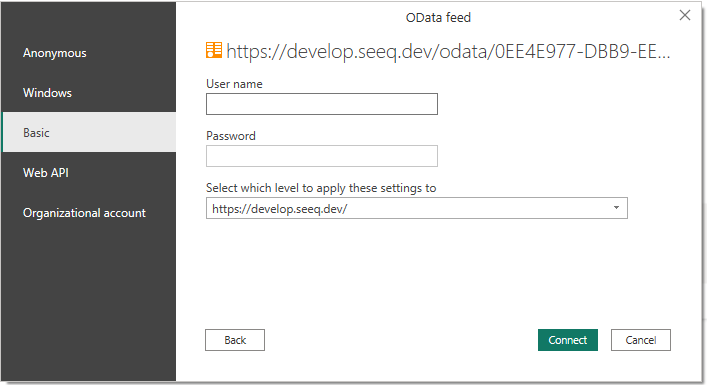
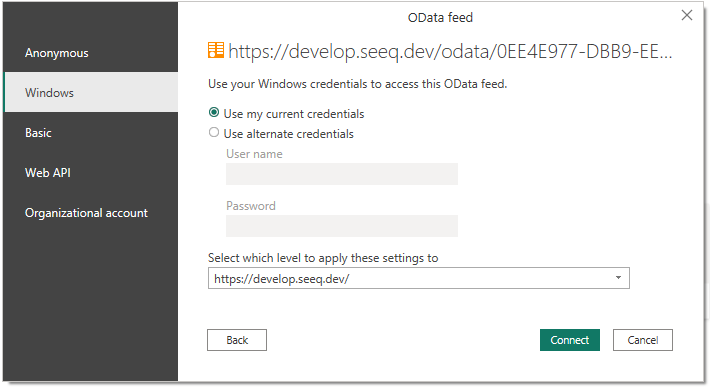
Users can authenticate the OData feed using a Seeq Access Key or username & password. Alternatively, if Seeq is set up with Windows Auth and a user is reading an OData export in a Windows product (e.g. Excel, Power BI), the user can authenticate the OData feed seamlessly.
What’s new in R63
OData Export has changed significantly in R63:
New service
A new version of the OData Service has been added. See the “Modern Data Exports“ section compared to “Legacy Data Exports“ below.
Form
The “Samples table mode“ is now a directly-selectable option.
The “Samples table grid“ has “Ungridded original timestamps” added as an option.
Data tables (legacy service)
Samples export:
Modified: “Automatic” grid period now is calculated based on the time range being exported.
Capsules export:
Modified: Column ordering has been changed slightly to increase clarity. Capsule properties are now in alphabetical order.
Removed: Signal statistics within each capsule are no longer output to improve performance. Use the
$condition.setProperty(...)formula if these statistics are still required.
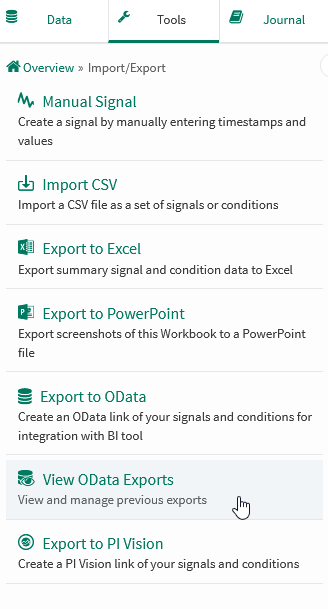
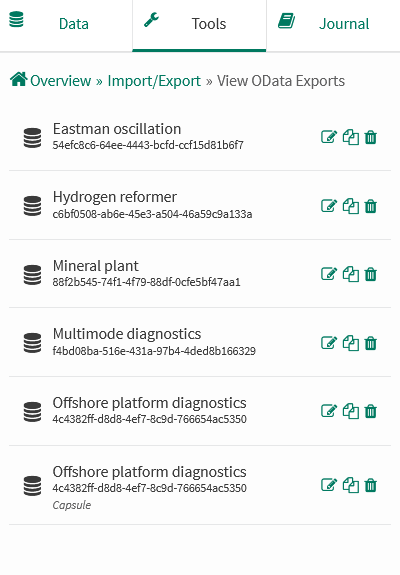
Viewing OData Exports
Creating & Editing OData Exports
Exporting to Other Applications
Data Exports
There are two parallel OData services available: Legacy and Modern.
All defined OData exports are able to be exported using either service. Specifying a Modern or Legacy URL will dictate which service Seeq will utilize.
Administrators can set the Features/OData/DefaultProtocol configuration option to 4.0 to enable the Modern service as the default. 2.0 will show the Legacy export URLs instead.
Legacy exports will be deprecated in a future version of Seeq, then fully removed in a proceeding version.
Modern OData Exports
Modern exports are accessed via /odata/{id}.svc URLs. These endpoints support up to OData Version 4.0.
Four tables are available within each OData Export: Information, Items, Samples, and Capsules.
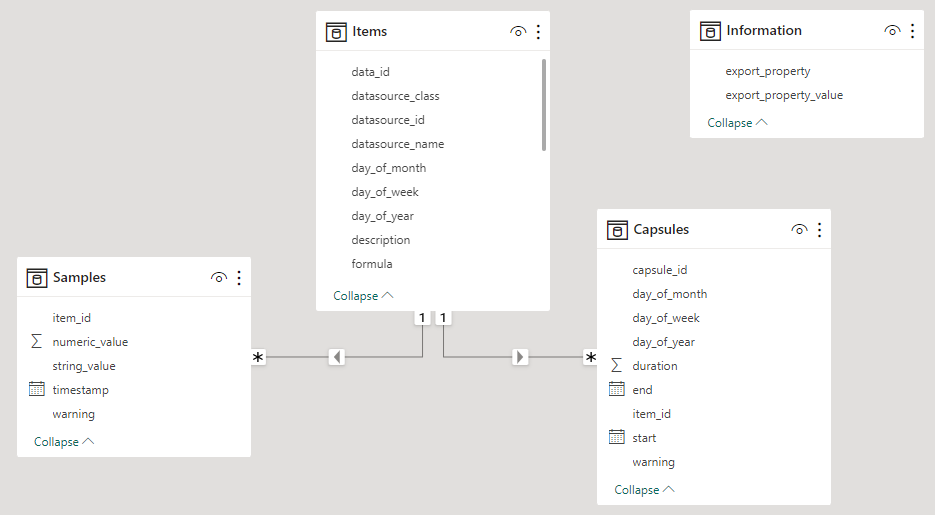
Information Table
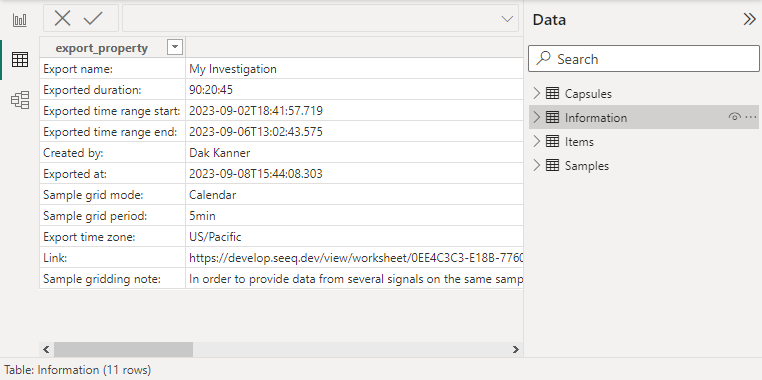
The Information table details the meta information about the export. It includes which configuration options were used to generate the export, the link back to Seeq where this export can be modified, and other such data.
Items Table

The Items table lists the properties of all exported items.
Their Seeq ID, type, name, asset path, and description are listed first. All other metadata properties follow after that in alphabetical order (minus specific properties that are unlikely to be useful such as UI Config). Finally, any conditions with capsule properties list those properties alphabetically and their associated unit of measure.
Samples Table
The Samples table reports the value of each signal at different timestamps. The grid period options determine the timestamps that will be output. The signal’s value at the given timestamp will be present in either the numeric_value or string_value column, depending on the signal type.
Calendar and Chain mode
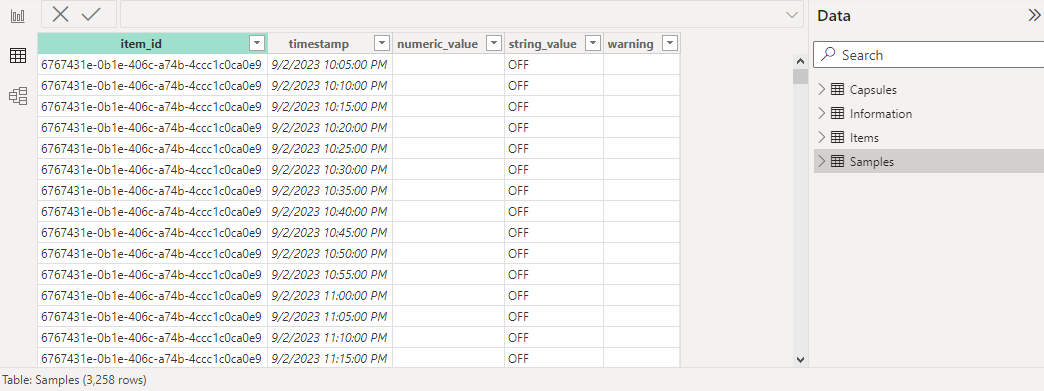
These modes output the signals' value at each real-world timestamp. Calendar mode lists all timestamps within the exported interval. Chain mode filters out times where no capsules are present.
Capsule mode

Capsule mode represents a signal segment within each capsule. This data includes the same columns as Calendar/Chain mode, but also include the condition’s ID, the capsule’s ID, and the time this sample is located relative to the capsule’s start (in minutes).
Capsules Table

The Capsules table lists all capsules within the exported time range. The start, end, and duration are listed for all capsules (when available) followed by the capsule properties in alphabetical order.
Legacy OData Exports
Note: The columns output by legacy OData exports are based on the signal and condition names & asset paths. If any duplicate columns are present, it can cause errors for some clients. If exports with duplicate columns are defined, archive those exports and clear your client cache to fix the issue.
Note: Memory limitations for legacy exports may cause exports to return 502 Bad Gateway responses or 400 responses with a This OData export is estimated to be larger than the server configuration allows... error message. Systems which regularly export large amounts of data will likely want to preemptively increase Memory/Appserver/Size and/or Memory/Appserver/OData/MaxEstimatedMemoryUtilization config options to ensure legacy exports work as expected.
It is generally a good idea to limit the expected size of legacy exports to prevent memory errors and to get responses quickly. The specifics vary from server to server, but ensuring your exports have fewer than 10 items and 100,000 rows is a good upper boundary to help ensure performance.
Legacy exports are accessed via /odata.svc/{name}_DataSet URLs. These endpoints support up to OData Version 2.0.
Each export configuration equates to a single table. This table can either be a Samples or Capsules export.
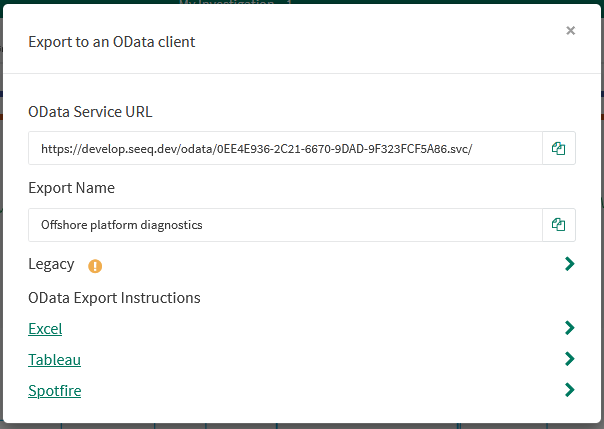
When the Features/OData/DefaultProtocol configuration is set to 4.0, the legacy export links can be accessed by expanding the Legacy section of the “Export to an OData client” modal.
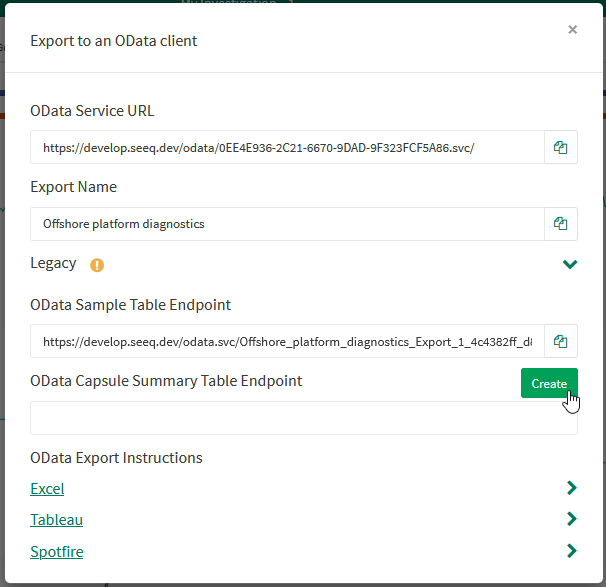
Samples Export
The Samples table reports the value of each signal (and condition) at different timestamps. The grid period options determine the timestamps that will be output.
Calendar and Chain mode

These modes output the signals' value at each real-world timestamp. Conditions are represented as signal-like data using the $condition.countOverlaps() formula function.
Calendar mode lists all timestamps within the exported interval. Chain mode filters out times where no capsules are present.
Capsule mode

Capsule mode outputs a column for each signal + capsule pair. The signal segments are gridded from the start key of each capsule.
Capsules Export

The Capsules table lists all capsules within the exported time range. The start, end, and duration are listed for all capsules (when available) followed by the capsule properties in alphabetical order.
Examples
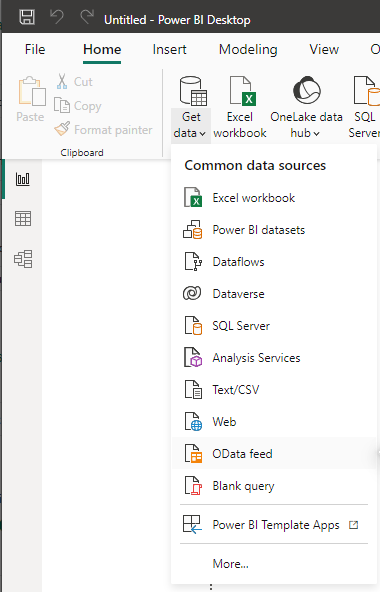
Authenticating using Seeq Username and Password or Access Key in Microsoft Power BI Desktop
Authenticating using Passwordless Windows Auth in Microsoft Power BI Desktop
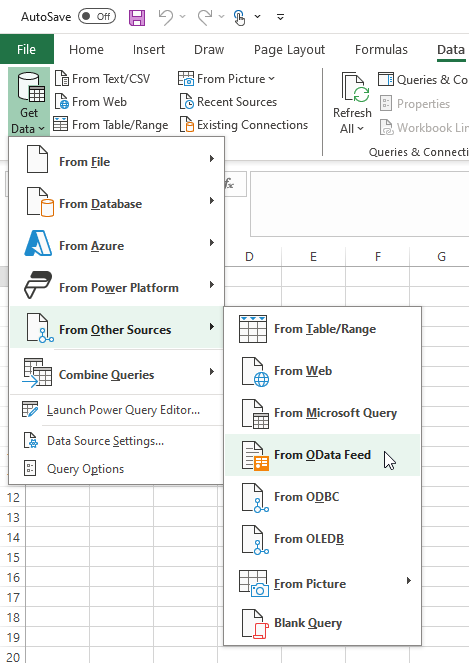
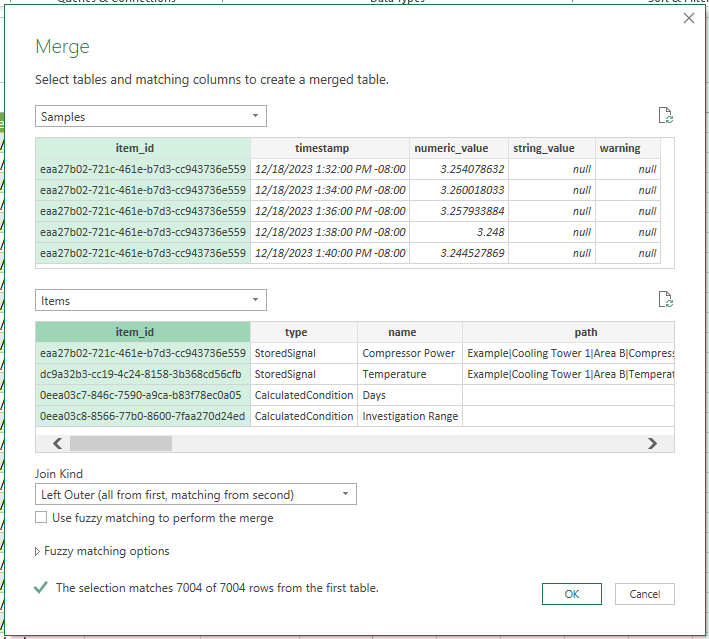
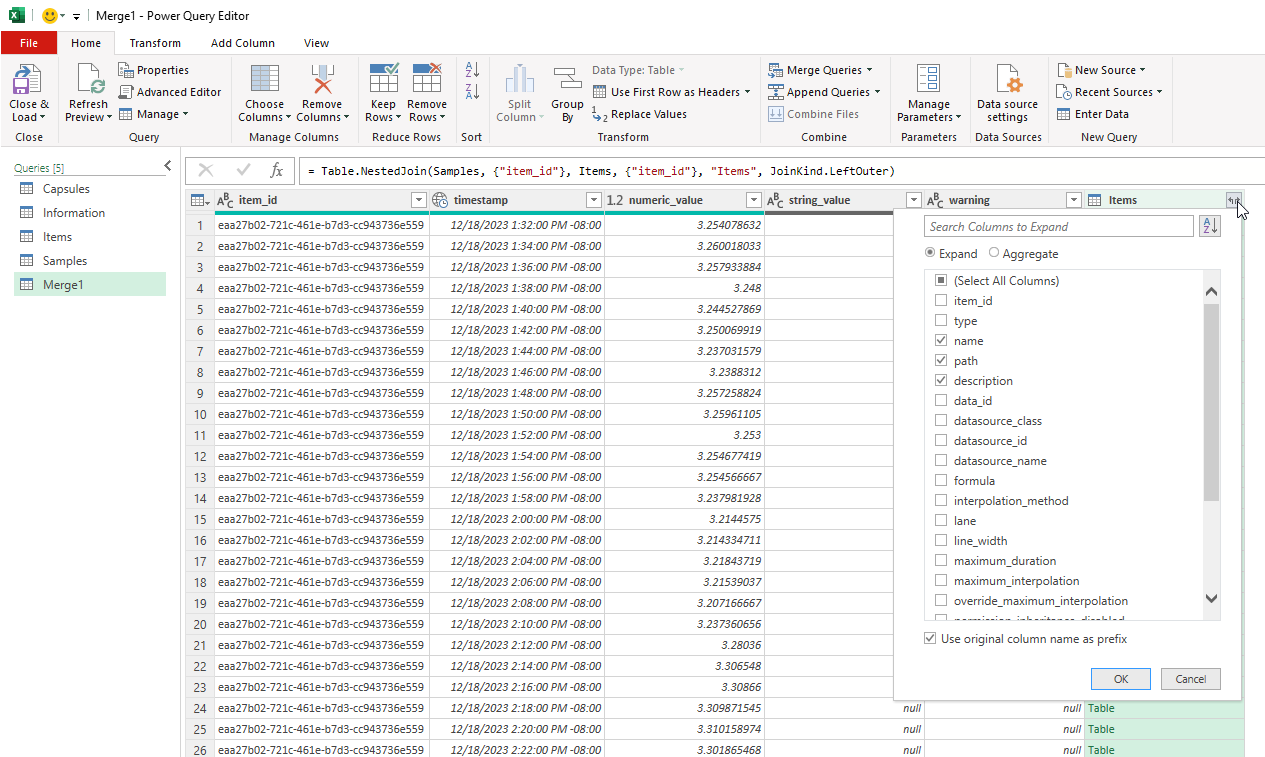
Joining modern OData tables in Microsoft Excel
Step 2. Download the raw table data.
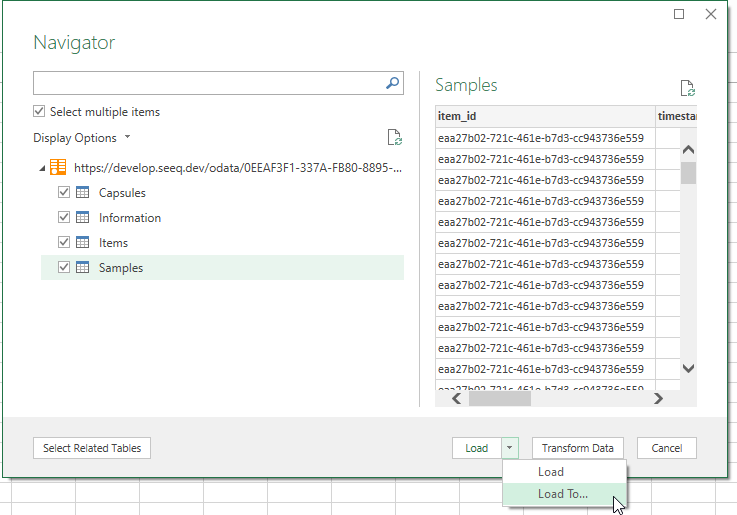
From the Navigator modal, check the “Select multiple items“ option. Select the desired tables. Then click “Load To.“
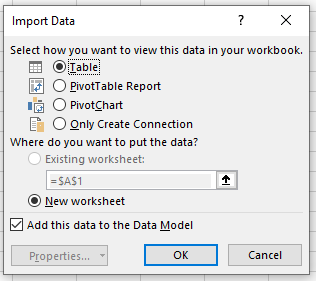
On the Import Data form, select “Table” and “New worksheet“ then clock OK. This will load each of the tables' raw data as their own sheet.
