Displaying Signal or Capsule Properties and Statistics
Statistics or Properties in the Details Pane
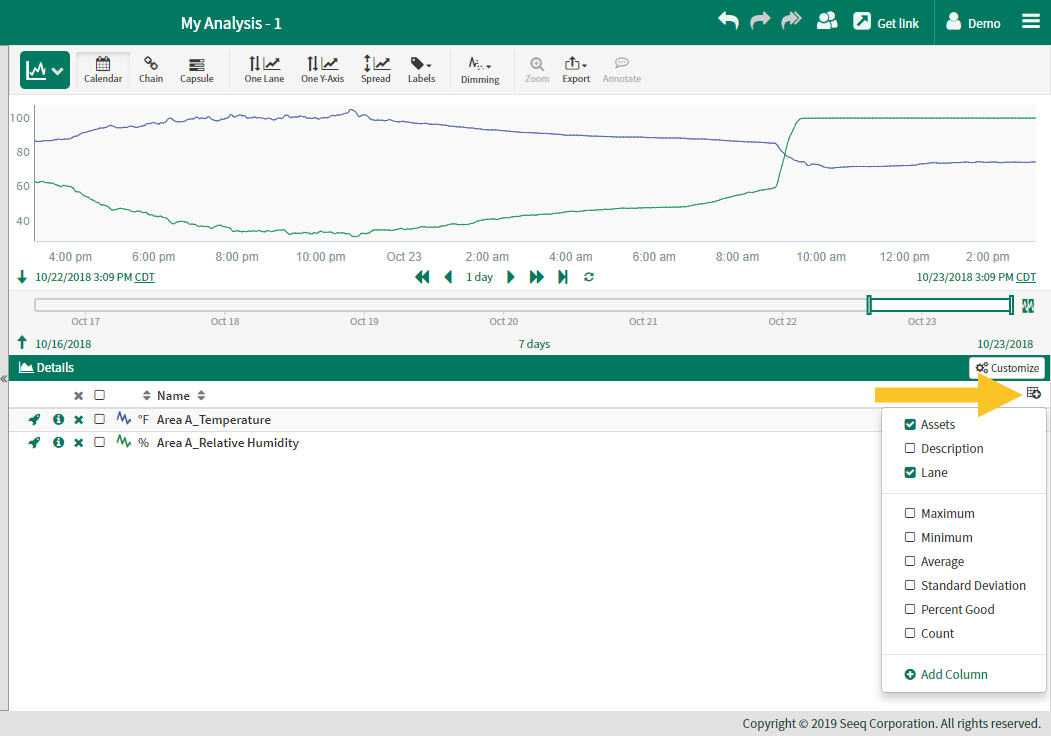
In the details pane you can add or remove descriptive properties or statistics to display alongside each item. By clicking the Add Column button 
Descriptive Properties
Assets - The name of the parent asset of an item.
Description - Item description as reported by the datasource.
Lane - The lane number a signal is displayed in. This is a useful mechanism to sort signals and conditions so that they appear in the same order in the trend and in the details pane.
Statistics
Selected statistics are computed for signal or condition over the entire display range.
Custom Columns
The final option is being able to add a column with a custom property. Clicking, "Add Column," will give you a total list of available item properties.
Statistics or Properties in the Details Pane
Capsule Level Statistics
Filtering in the Capsules Pane
Statistics or Properties in the Capsule Pane
In the capsule there are two types of statistics and properties you can add to the capsule table. Statistics which are calculated per capsule (start, end, duration, etc) and statistics which are calculated per signal per capsule (max Temperature per capsule or average Compressor Power per capsule).
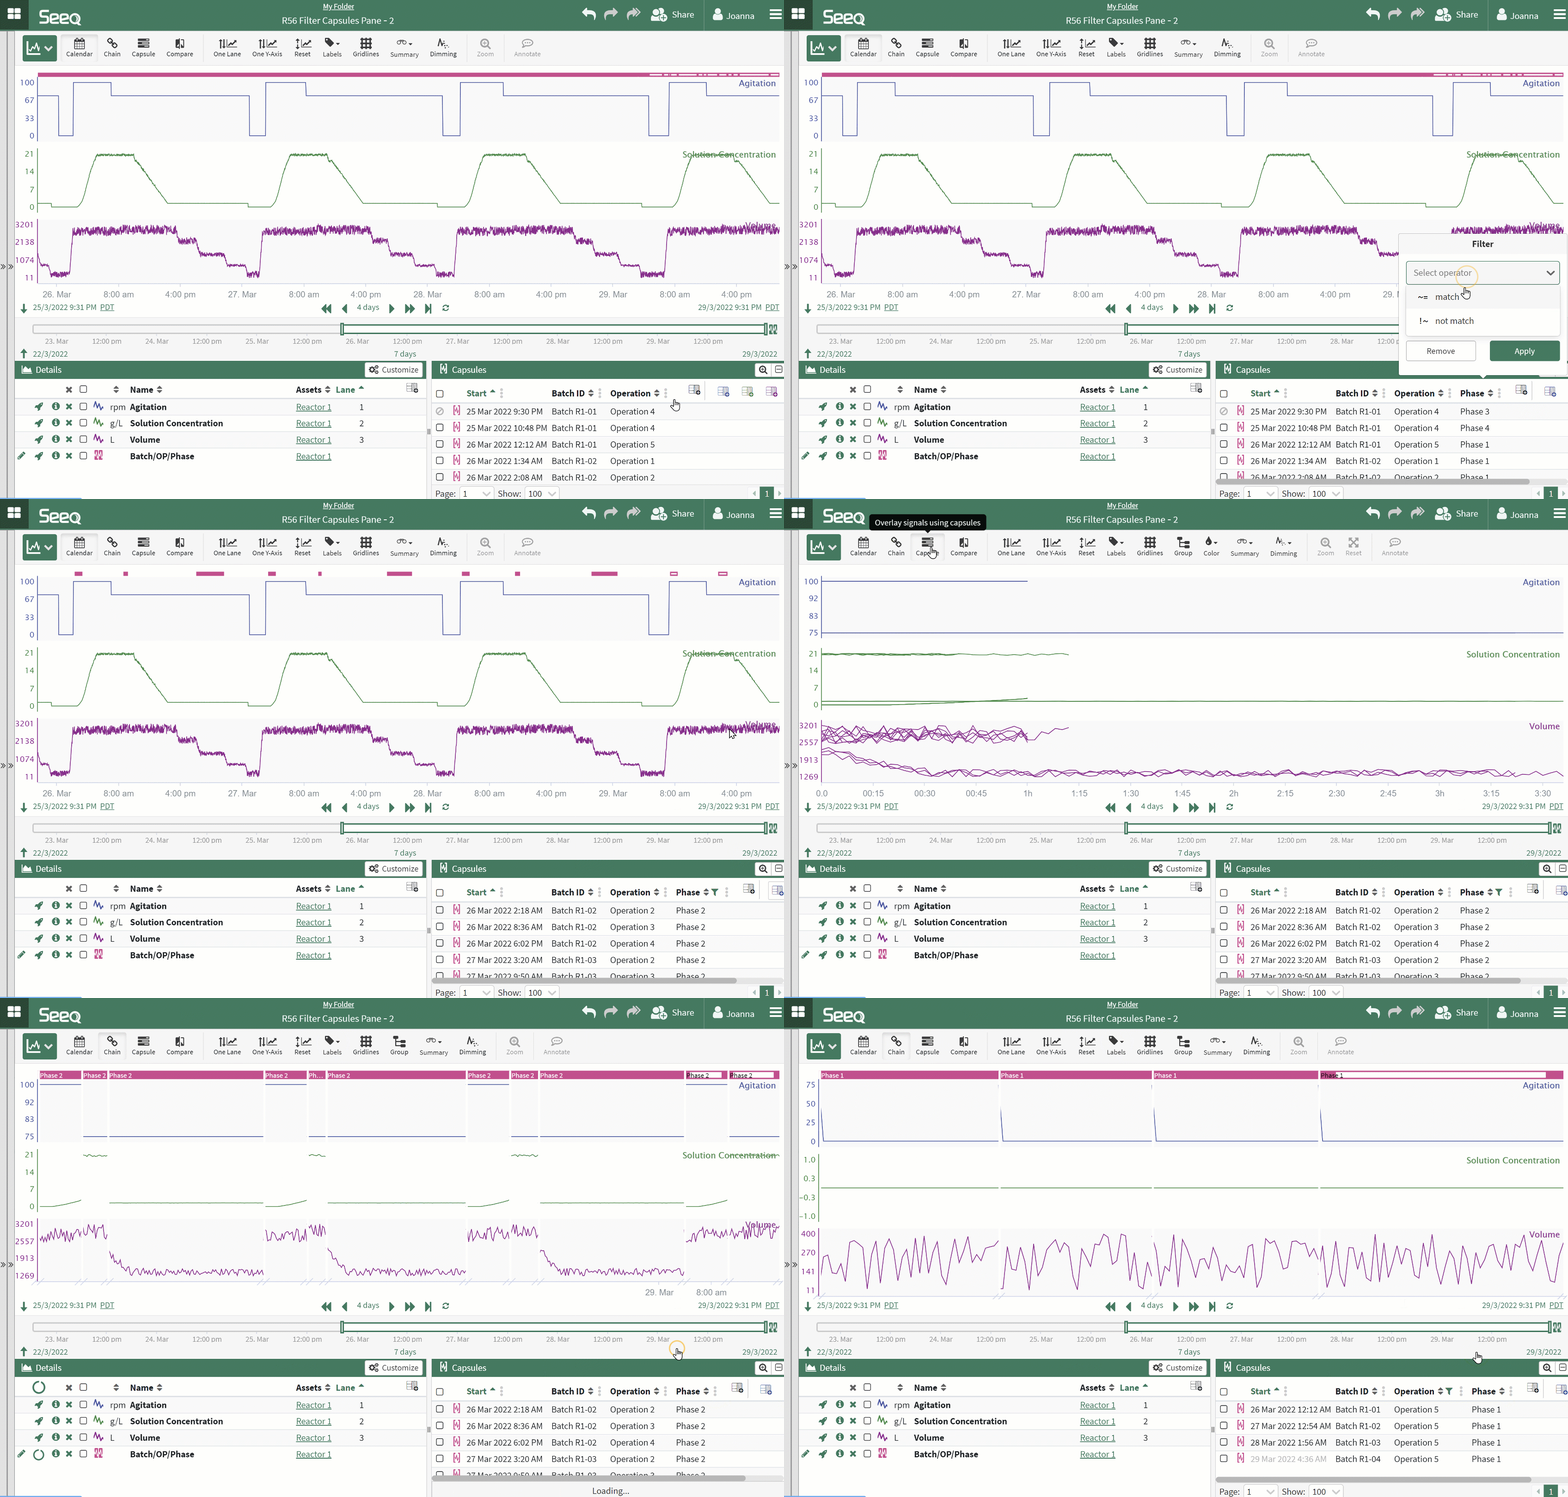
Most columns in the Capsules Pane can be used to filter the capsules in the Display. Access the filter from the three dot menu in the header of the Capsules Pane and apply numeric or text filters to focus on a subset of any condition(s) in Trend and Scatter Plot views. This is a visual filtering only, and the results of subsequent calculations depending on the condition are not filtered. Filtering capsules in the Capsules pane will not impact the results of a histogram as it is a calculated item.
Capsule Level Statistics
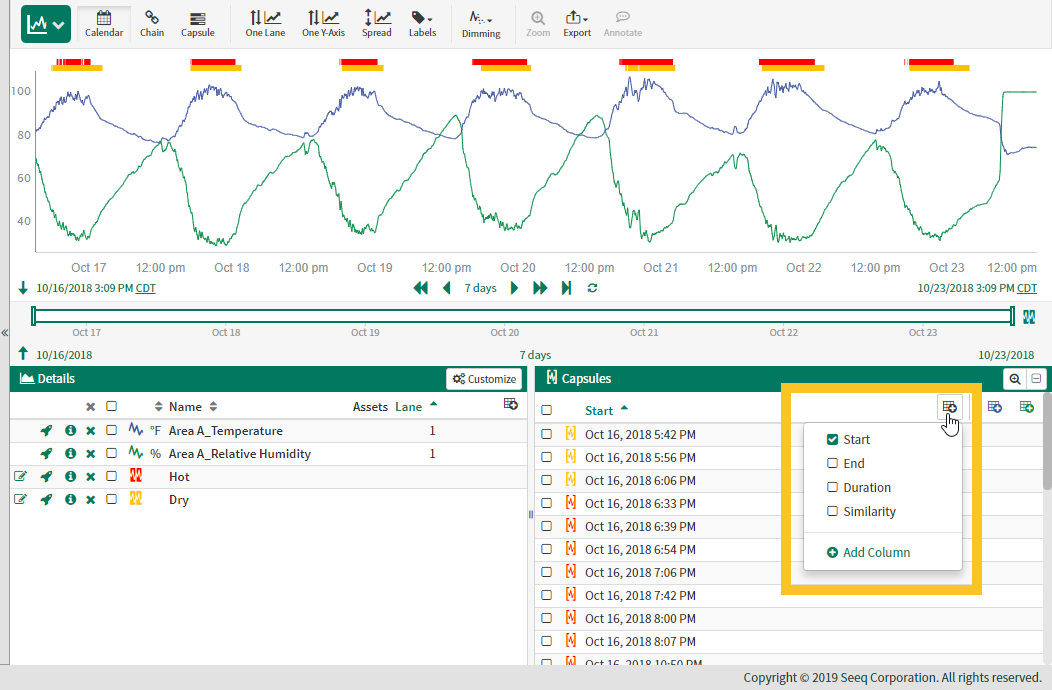
By clicking the farthest left Add Column button 
Descriptive Statistics
Start - start time of each capsule
End - end time of each capsule
Duration - total duration of each capsule
Similarity - If capsules were generated using the Profile Search Tool, this is a ranking from 0% to 100% which describes how close the capsule is to the originally selected profile.
Note: Capsules that extend beyond the display range will display "starts off-screen" or "ends off-screen" and not provide a duration measurement.
Custom Properties
The final option is being able to add a column with a custom property. Clicking, "Add Column," will give you a total list of available capsule properties. Properties can store important metadata about a capsule. These properties can originate from external datasources or from calculations like the toCapsules() formula. Example properties include things like BatchID, Product Type and Value.
Signal Statistics per Capsule
Signal Statistics per Capsule
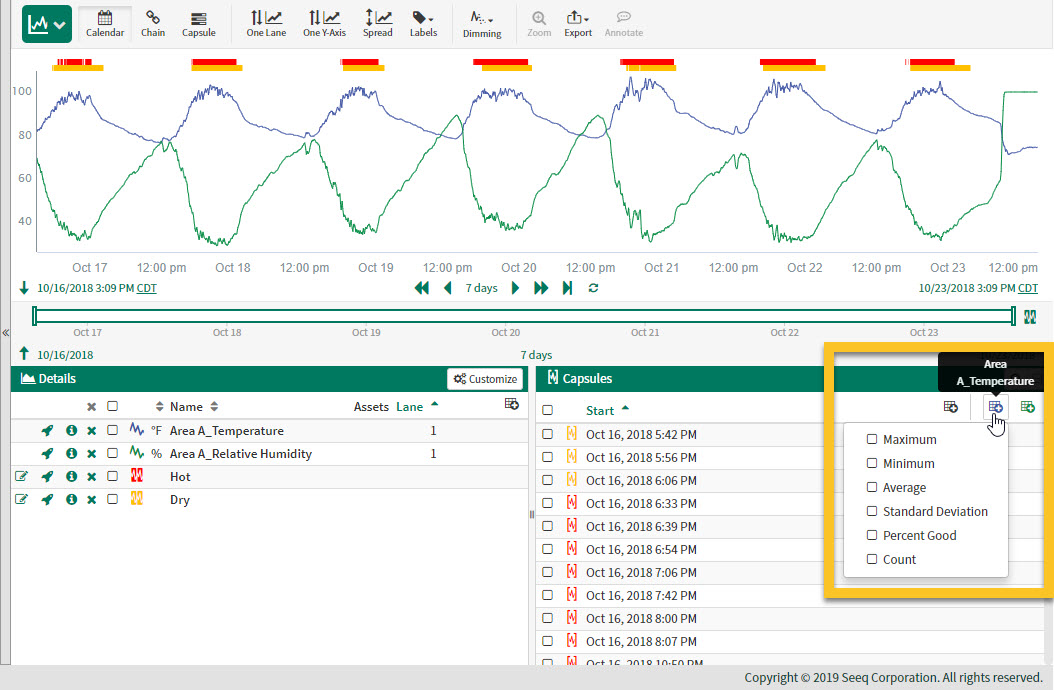
By clicking the colored Add Column button 
In the example shown to the left, clicking on the blue Add Column icon will allow users to add statistics which summarize the blue trend (Compressor Power) between the start and end time of each capsule. Sample statistics might include average power per capsule or max power per capsule.
The summary statistics plotted in the table can also be turned into a new time series of their own using the Signal from Conditions Tool.
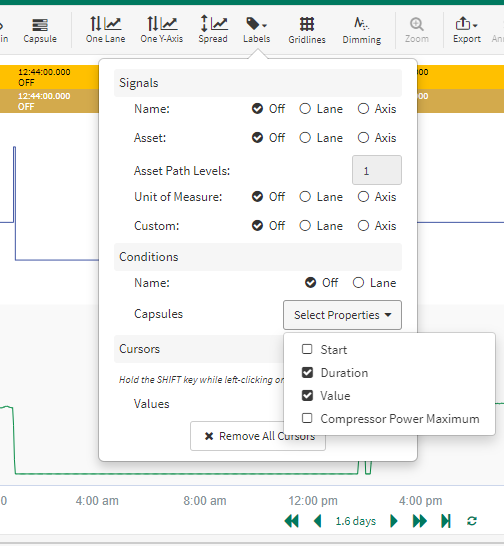
Add Capsule Properties to the Display Range
Add any capsule properties to the display range by adding them via the Labels button in the toolbar.
