Export to OData
Overview
Seeq has an OData export feature that allows trends and calculations to be exported to Spotfire, Tableau, or Microsoft applications Excel and Power BI.
The OData export can be read directly by these software programs for use in dashboards or for further analysis.
Users can authenticate the OData feed using their Seeq username and password. Alternatively, if Seeq is set up with Windows Auth and a user is reading an OData export in a Windows product (e.g. Excel, PowerBI), the user can authenticate the OData feed seamlessly.
Viewing OData Exports
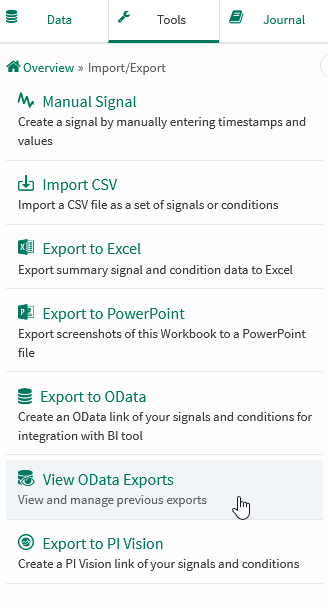
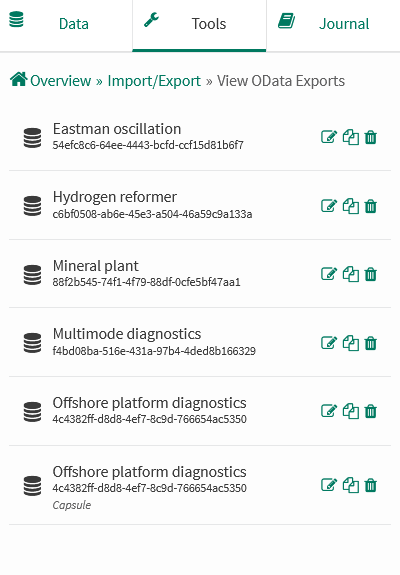
Previously-created OData exports can be accessed using the “View OData Exports“ panel from the Tools menu in an Analysis, within the “Import/Export” section.
This list alphabetically shows all OData exports that have been created within this Analysis.
Each export includes buttons for editing the configuration, copying the link to your clipboard, and deleting the export. Clicking the body of an export will display the modal with the link(s) and instructions.
Creating & Editing OData Exports
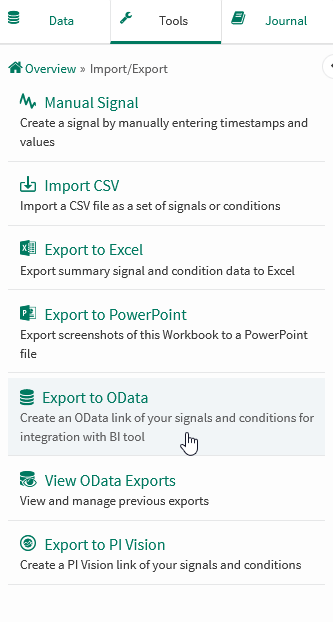
The “Export to OData” tool panel can be accessed from the Tools menu in an Analysis, within the “Import/Export” section.
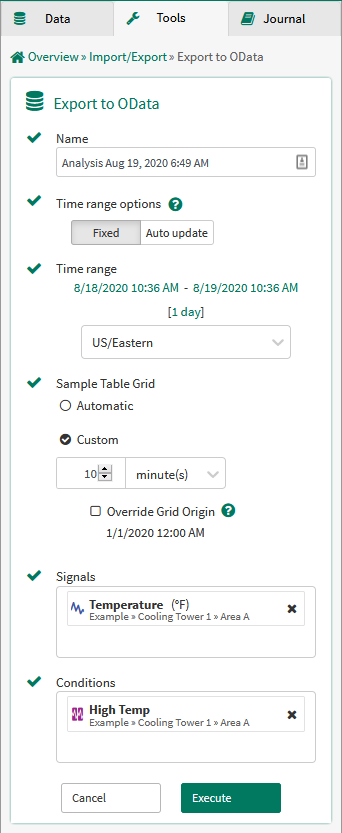
Name: Provide a relevant name that will be used in identifying the export upon importing to the new application. The name provided here will be appended with a unique identifier.
Time range options: Select a Fixed time range or select Auto update for a moving time window.
Auto Update and $RangeStart/$RangeEnd are premium features that require a Seeq Enterprise license.
Auto update: When this option is selected, the time range is adjusted to end at ‘now’ whenever the export URL is queried by your OData client. The originally-selected duration is used to determine the start date. The auto update "scheduling" portion needs to be configured in the BI tool.
The OData service will support URL parameters
$RangeStartand$RangeEnd. When the range parameters are specified, the originally-selected time range is ignored (the specified time zone is still respected).Be sure you’ve specified a custom Sample Table Grid to ensure consistent sample frequencies are output.
Supported date-time formats include ISO-8601 with offset (
2020-02-25T14:15:30+01:00), ISO-8601 without offset (2020-02-25T14:15:30, uses the configured time zone), and Microsoft Excel default US format (2/25/2020 2:15:30 PM, uses the configured time zone).For example, this URL requests data for all of January 2022 in the configured time zone.
https://mycompany.seeq.site/odata.svc/ExampleExport_DataSet?$rangestart=2022-01-01T00:00:00&$rangeend=2022-01-31T23:59:59
Time range: Specify the time range by adjusting the start, end and duration fields.
Time Zone: This is the time zone to be used for all times within the export. This setting defaults to that of the source worksheet. If the selected zone observes daylight savings time, ambiguities may occur at these events.
Sample table grid: The grid option determines the timestamps that will be reported in the sample table.
Automatic: Looks at the signal with the most frequent sampling rate and outputs samples for each signal with a timestamp interval based on it. For example, if your most frequent sampling rate is 5 minutes, the values exported will be separated by 5 minutes. If the number of samples to be exported exceeds 1 million, Seeq will adjust the gridding period to export only 1 million rows of data.
Custom: Samples are segmented according to the grid period you set. For example, a grid period of 1 hour leads to values with timestamps separated by an hour.
Override Grid Origin: The specific date and time to orient the grid period. For example, this allows a weekly grid to be calculated every Monday at 9:00 AM rather than the default of Sunday at midnight.
Signals: Modify the list to only include the signals desired in the export.
Conditions: Modify the list to only include the conditions desired in the export.
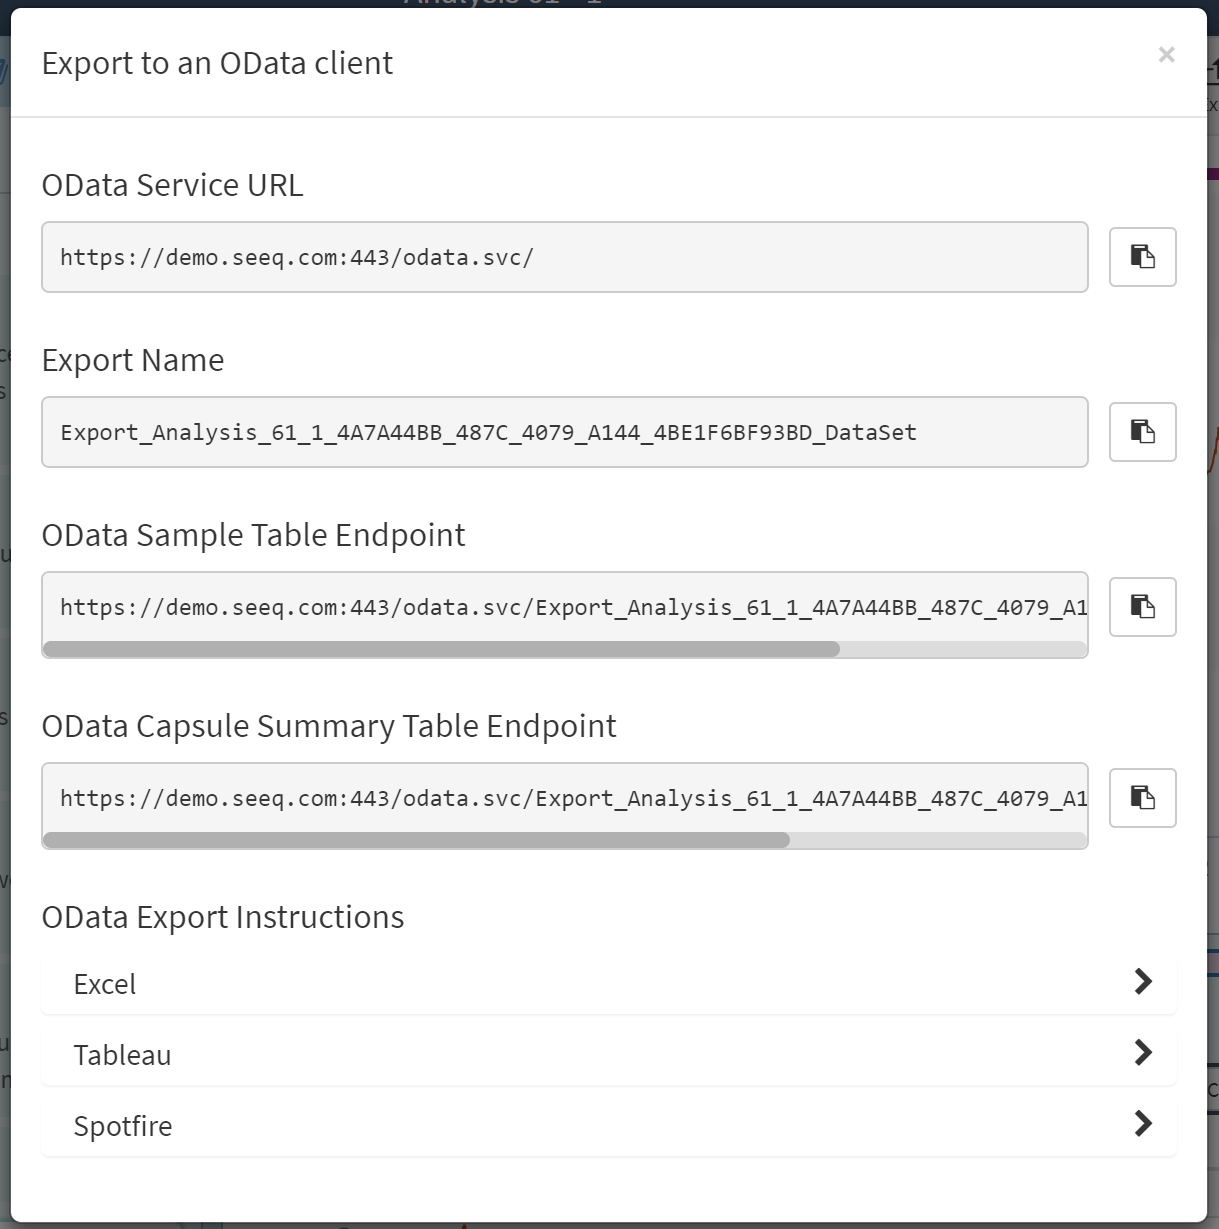
Exporting to Other Applications
From the 'Export to an OData client' window, select the desired import application from the menu at the bottom for detailed instructions.
Then copy the desired data export link.
Data Exports
Note: The columns output by OData exports are based on the signal and condition names & asset paths. If any duplicate columns are present, it can cause errors for some clients. If exports with duplicate columns are defined, archive those exports and clear your client cache to fix the issue.
Note: Memory limitations for legacy exports may cause exports to return 502 Bad Gateway responses or 400 responses with a This OData export is estimated to be larger than the server configuration allows... error message. Systems which regularly export large amounts of data will likely want to preemptively increase Memory/Appserver/Size and/or Memory/Appserver/OData/MaxEstimatedMemoryUtilization config options to ensure legacy exports work as expected.
Exports are accessed via /odata.svc/{name}_DataSet URLs. These endpoints support up to OData Version 2.0.
Each export configuration equates to a single table. This table can either be a Samples or Capsules export.
Samples Export
The Samples table reports the value of each signal (and condition) at different timestamps. The grid period options determine the timestamps that will be output.
Calendar and Chain mode
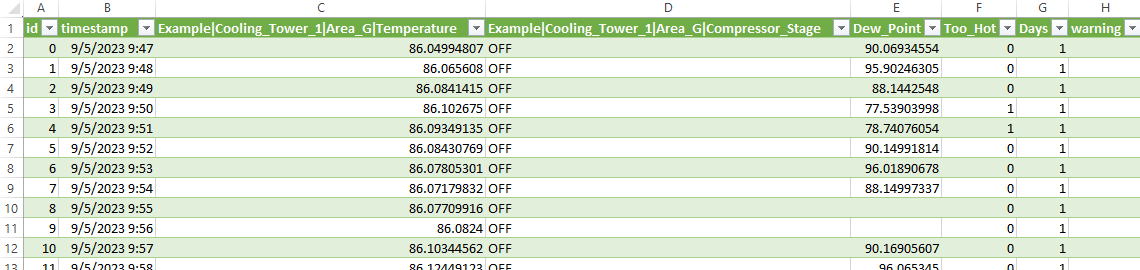
These modes output the signals' value at each real-world timestamp. Conditions are represented as signal-like data using the $condition.countOverlaps() formula function.
Calendar mode lists all timestamps within the exported interval. Chain mode filters out times where no capsules are present.
Capsule mode
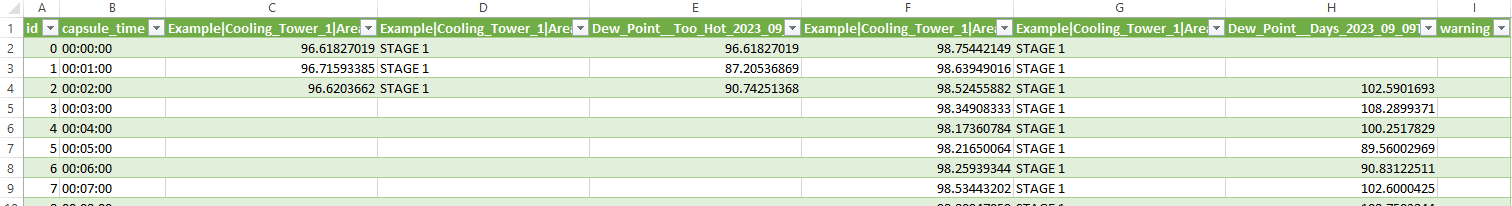
Capsule mode outputs a column for each signal + capsule pair. The signal segments are gridded from the start key of each capsule.
Capsules Export
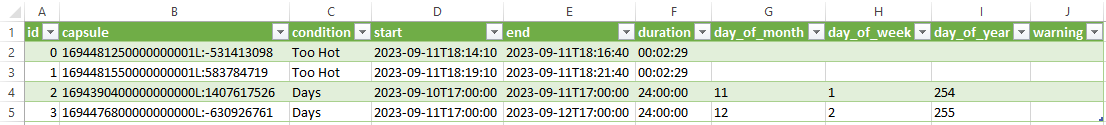
The Capsules table lists all capsules within the exported time range. The start, end, and duration are listed for all capsules (when available) followed by the capsule properties in alphabetical order.
If signals are included in the export configuration, statistics within each capsule will be calculated for each signal segment.
Examples: Importing to Microsoft Power BI
Using Seeq Username and Password
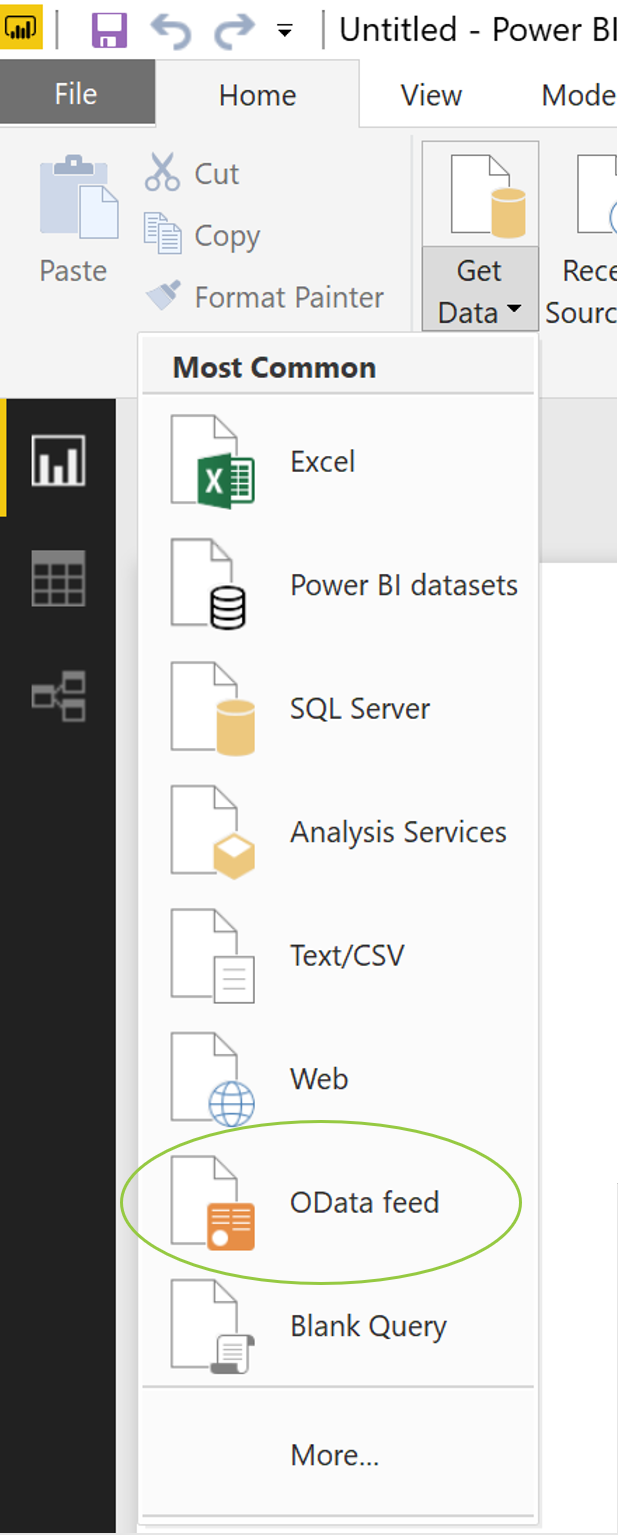
Step 1. Open Microsoft Power BI and navigate to the "Get Data" dropdown → OData option selection (note it must be the desktop version of the application):
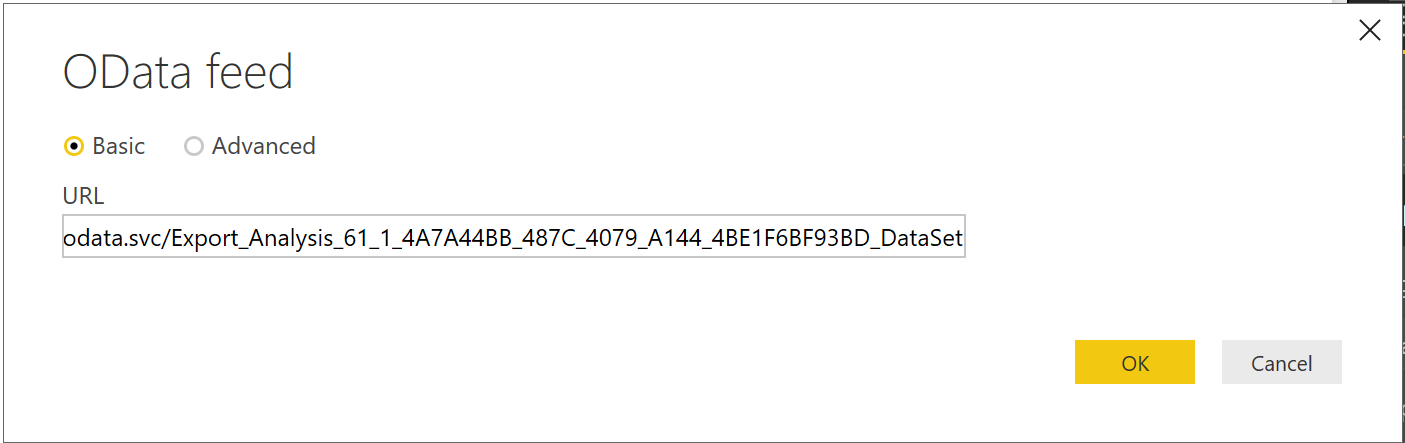
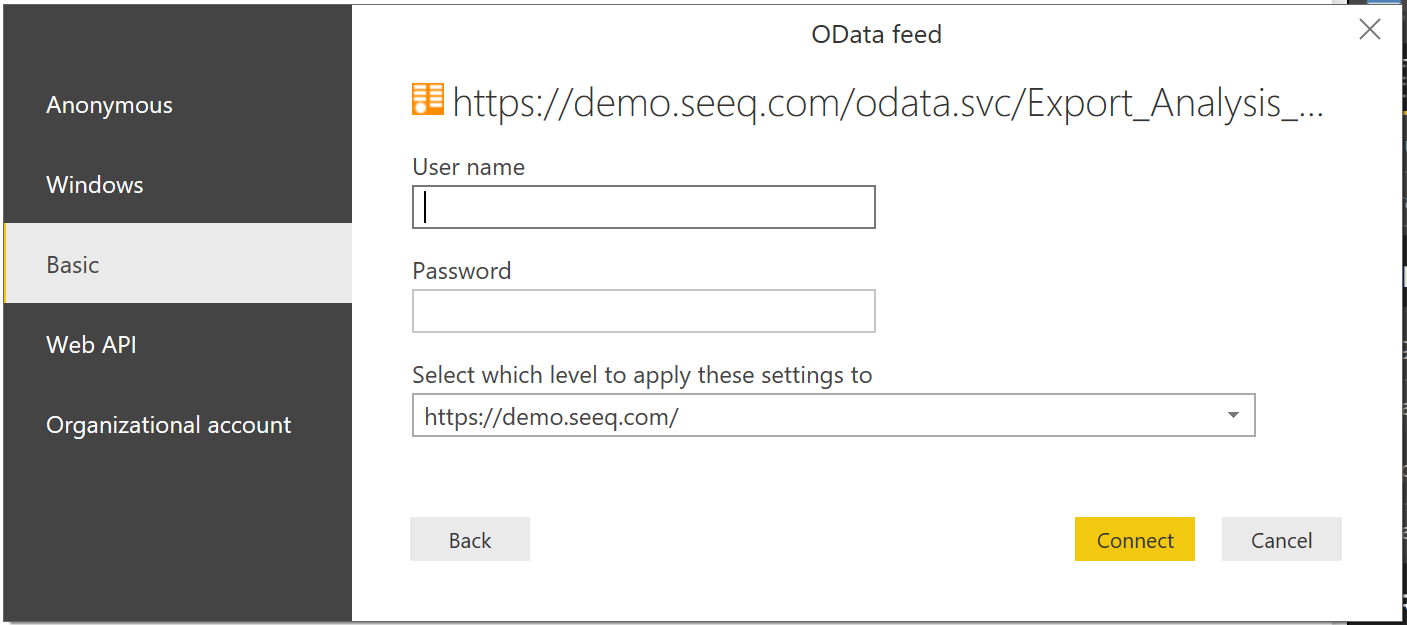
Step 2. Insert the export URL and enter your Seeq login credentials. Either an Access Key or your regular username+password are acceptable. Access Keys must be used if you log into Seeq using Single Sign-On such as Azure Active Directory or Okta.
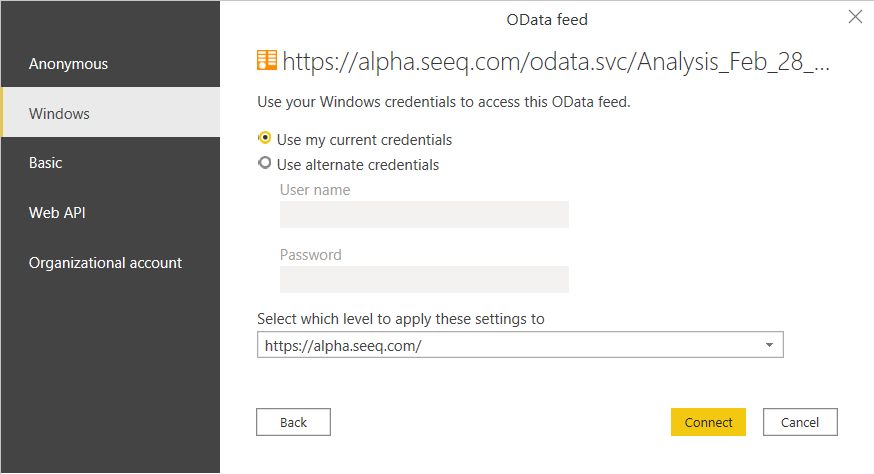
Using Passwordless Windows Auth
Step 1. Open Microsoft Power BI and navigate to the "Get Data" dropdown → OData option selection (note it must be the desktop version of the application):
Step 2. Insert the export URL, then click Windows on the left sidebar, select "Use my current credentials", and click Connect.
Note that this method is only supported for systems using the Windows Auth Connector or the LDAP Connector to provide passwordless authentication for users, and the user logged into Windows must match a Seeq user who has access to the exported content. If you are using an authentication provider that is not currently supported, please utilize Access Keys as credentials for the OData Export.