Understanding the Ignition Module
Browsing Ignition tags from Seeq Workbench
Once you are logged in, create a new Workbook. Once the Workbook is created, you will have a Worksheet to which you can add data.
The Ignition tag hierarchy will automatically show up in the list of assets:
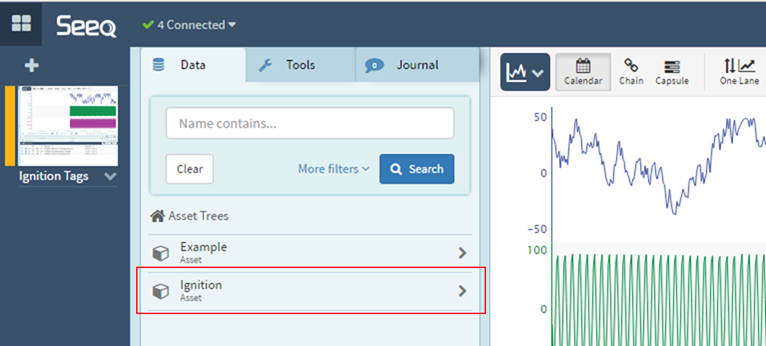
You can click on the asset to drill down into the hierarchy. When you get down to a tag that is historized, you can click on it to bring it onscreen.
You can also search for assets in the Data tab's textbox (that has "Name contains..." in it), and then click through to historized tags.
Seeq will only index Ignition tags that are historized. If a tag is not historized, it will not show up in the Seeq tag hierarchy or in search results.
Once you have data onscreen, you can do lots of stuff with it. Take a look at our Seeq University videos to learn more.
Asset Identification
Seeq differentiates between the portion of the Ignition tag hierarchy that represents an asset and the portion that represents a signal. Correct identification of each is important in order take advantage of various Seeq features, including asset swapping and Treemap rollups.
User Defined Types
By default, Seeq will use the highest User Defined Type (UDT) in the hierarchy to define the dividing line between the asset and signal portions of the tag path.
For example, let's look at the following tag hierarchy in the Ignition Designer:
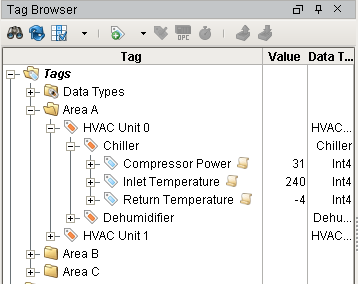
The highest UDTs in the hierarchy are HVAC Unit 0 and HVAC Unit 1. As a result, Seeq will construct its asset tree as follows...
Area A >> HVAC Unit 0 >> Chiller/Compressor Power
Area A >> HVAC Unit 0 >> Chiller/Inlet Temperature
Area A >> HVAC Unit 0 >> Chiller/Return Temperature
...where the orange items are assets and the black items are signals. It will look like this in Seeq:
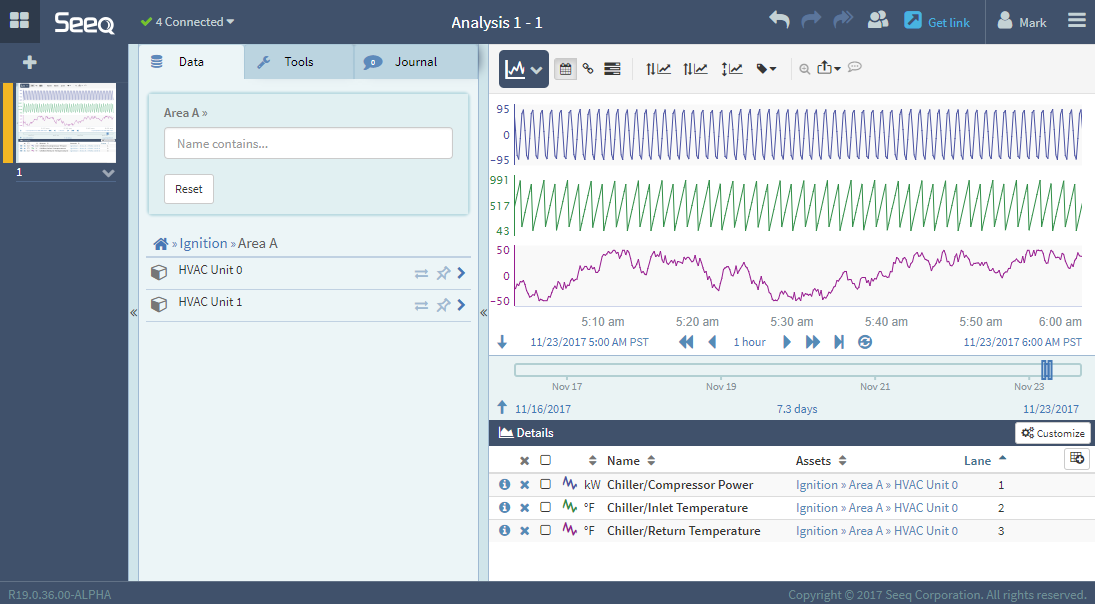
In this example, all HVAC Units have Chillers and Dehumidifiers, and we want to be able to compare and swap out HVAC Units in calculations.
Asset Path Specifications
Sometimes your Ignition configuration does not make use of UDTs, or the UDTs are defined in such a way that Seeq is not detecting the signals and assets in the way that you want. In this case, you can specify an Asset Path pattern.
In the Ignition Gateway Configuration site, navigate to CONFIGURE > SEEQ > Settings.
In the Asset Paths text box, add an Asset Path pattern. For example, let's say your tag hierarchy looks like this:
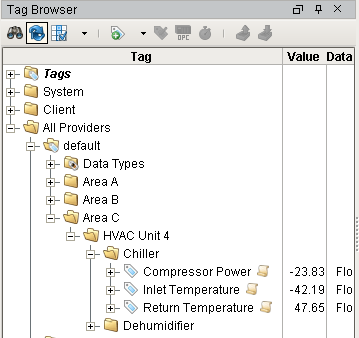
If you want Seeq to identify HVAC Unit 4 as the asset, and therefore use Chiller and Dehumidifier as part of the signal names, you would add this Asset Path pattern:
[default]Area C/HVAC Unit 4Note that the Tag Provider name is required at the beginning, enclosed in square brackets.
You can add as many Asset Path patterns as you would like by putting them each on their own line.
You can use wildcards to reduce the number of Asset Path patterns you'll need to add. For example, you could have specified:
[*]Area*/*This pattern will match any tag provider, and any tag that is a child of a root tag that starts with "Area".
You can use double-asterisk to match any part of the tag hierarchy. For example, this pattern will match any tag that starts with HVAC anywhere in the tag hierarchy:
**/HVAC*Once you click Save Changes, Seeq will re-index the Ignition tag database and modify the asset/signal hierarchy.
Adding a "Show in Seeq" Button to an Ignition Vision Window or Template
You may find it desirable to make it easy for Vision users to see trends in Seeq for the tags that are being displayed in a Vision window or template.
There will be a "Seeq" section to your Ignition Designer component palette, with a "Show in Seeq" button that can be added to any window or template.
Just drag & drop the component on to a window or template and then modify its properties as follows:
Text | The text that will appear on the button. |
Paths | The tag paths that you want to appear in Seeq. You can specify multiple tag paths for Seeq to bring up by separating them with a semi-colon. Example:
CODE
If you are adding the Show in Seeq button to a template, you will likely need to use an Expression to construct the tag path programmatically. For example: 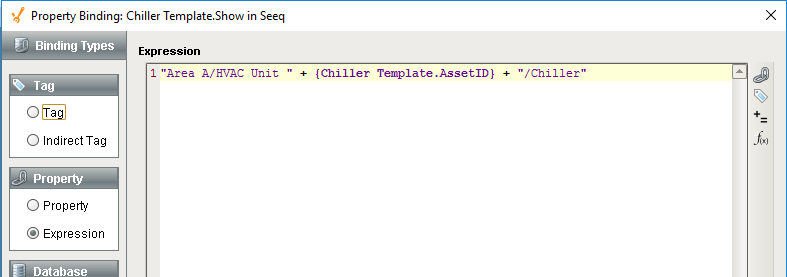 Again, you can use semi-colons to separate multiple paths in your expression. |
Workbook | The name of the Workbook that you want to come up in Seeq. Note that each user will get their own private copy of this workbook. It will not be created multiple times: If it already exists, it will be reused. |
Worksheet | The name of the Worksheet that you want to come up in Seeq. It will not be created multiple times: If it already exists, it will be reused. All existing tags will be removed and replaced by the new set. If a user wants to preserve any exploration they might have done on a set of tags, they can use the Duplicate Worksheet feature in Seeq to branch off their investigation so that it won't be overwritten the next time they use the Show in Seeq button from Ignition. If they forget to do that, they can just hit the Previous Workstep button in the top-right of Seeq Workbench and then use the Duplicate Worksheet feature. 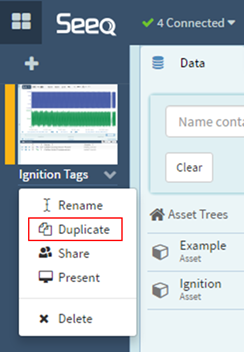 |
Display Start Time | The start time for the historical trend that will appear when Seeq Workbench comes up. Typically, you will want to specify an offset from the current time using the asterisk (*) which means "now". For example, a start time of *-1h means "one hour ago". |
Display End Time | The end time for the historical trend that will appear when Seeq Workbench comes up. Typically, you will want to specify the current time using just an asterisk (*). |
Investigate Start Time | The start time for the investigation range that will appear when Seeq Workbench comes up. The investigation range is the broader range shown at the bottom of the trend: 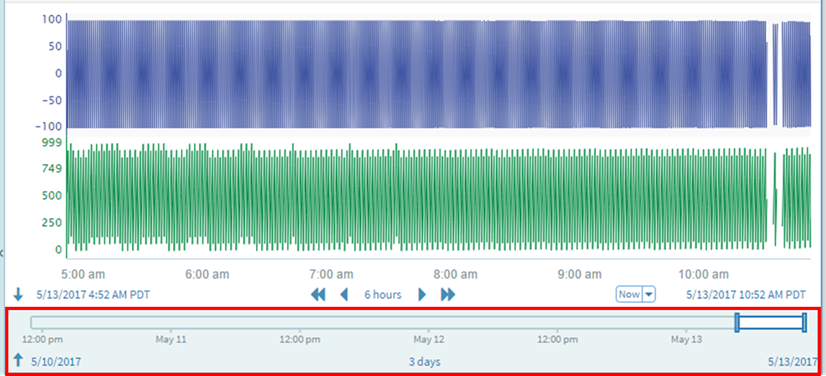 Typically, you will want to specify an offset from the current time using the asterisk (*) which means "now". For example, a start time of *-1w means "the past week (7 days)". |
Investigate End Time | The end time for the investigation range that will appear when Seeq Workbench comes up. Typically, you will want to specify the current time using just an asterisk (*). |
Embedding a Seeq Visualization in an Ignition Vision Window or Template
This capability is not available for Ignition Perspective, which is the new browser-based screen subsystem in Ignition 8.x.
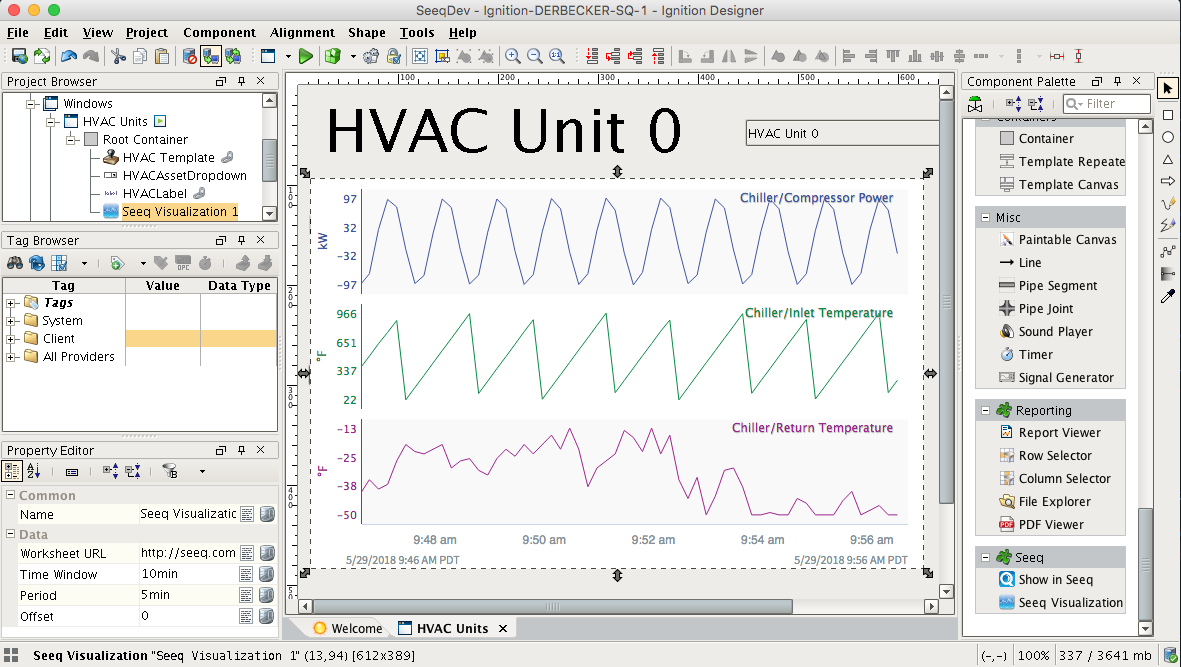
Any Seeq worksheet can be embedded in an Ignition Vision Window and set to refresh at a regular interval. This allows your Ignition Vision window to harness the power of Seeq's ability to display trends, treemaps, tables, and other visualizations in Ignition Vision.
There will be a "Seeq" section to your Ignition Designer component palette, with a "Seeq Visualization" button that can be added to any window or template.
Just drag & drop the component on to a window or template and then modify its properties as follows:
Worksheet URL | The URL of the Seeq worksheet to embed in Ignition Vision. Navigate to the worksheet and copy the URL from the browser's location bar and copy and paste it into Ignition Vision. 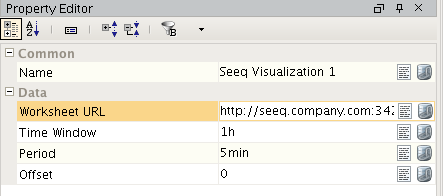 You must share the workbook (from within Seeq) with Everyone in order for Ignition Vision to be able to access it. Otherwise you will get an error indicating that "agent_api_key" does not have access to the workbook. |
Time Window | The time window to capture on the trend. Example: "24h" would display the last 24 hours. "5min" would display the last five minutes. |
Period | How often to update the visualization. Example: "30s" would generate a new image every 30 seconds. |
Offset | Offset the time window into the past or future from now. Zero means no offset; the time window for the trend is the current time minus the Time Window. Alternatively, "+5min" would offset the date range by 5 minutes in the future. "-1h" would offset the date range by an hour in the past. |
The visualization's size and aspect ratio can be adjusted by dragging the corners of the image.
The supported units for Time Window, Period, and Offset are y (year), mo (month), d (day), w (week), h (hour), min (minute), and s (second).
With each change to one of the settings you will see a loading icon while it generates a new image with the updated settings. After the settings are finalized, it will continue to generate a new image based on the Period.
Note that any changes made to the worksheet, such as adjustments in lane labels or signals on the trend, will be reflected the next time the image is generated.
