Export Data to Excel File
Overview
Seeq has the option to export data shown on Seeq Workbench to an excel file.
Seeq offers the ability to export data shown in the display range of a worksheet to Excel. This article details the different parameters that will affect the data exported and how they can be changed.
Export Options
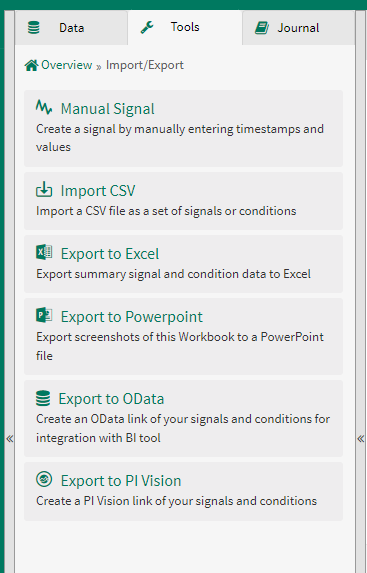
Import/Export tools are available in the Tools tab of the Data panel:

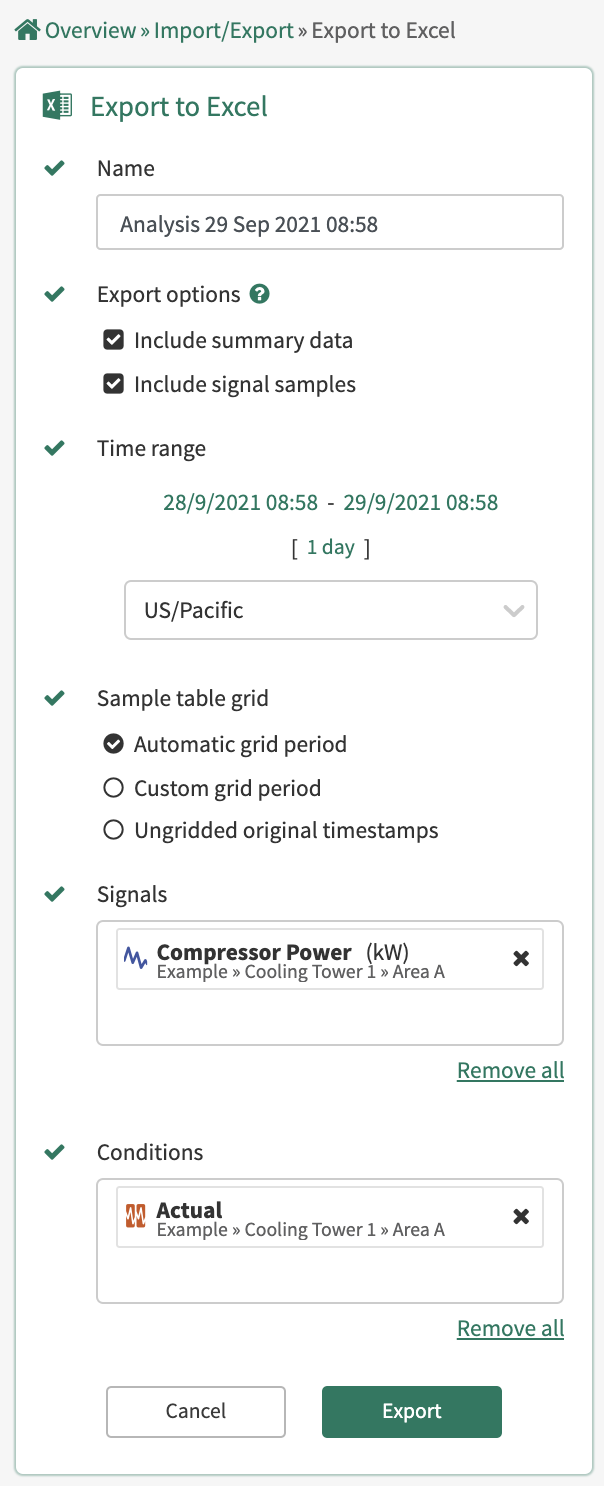
Configuring the Excel Export
Summary Data
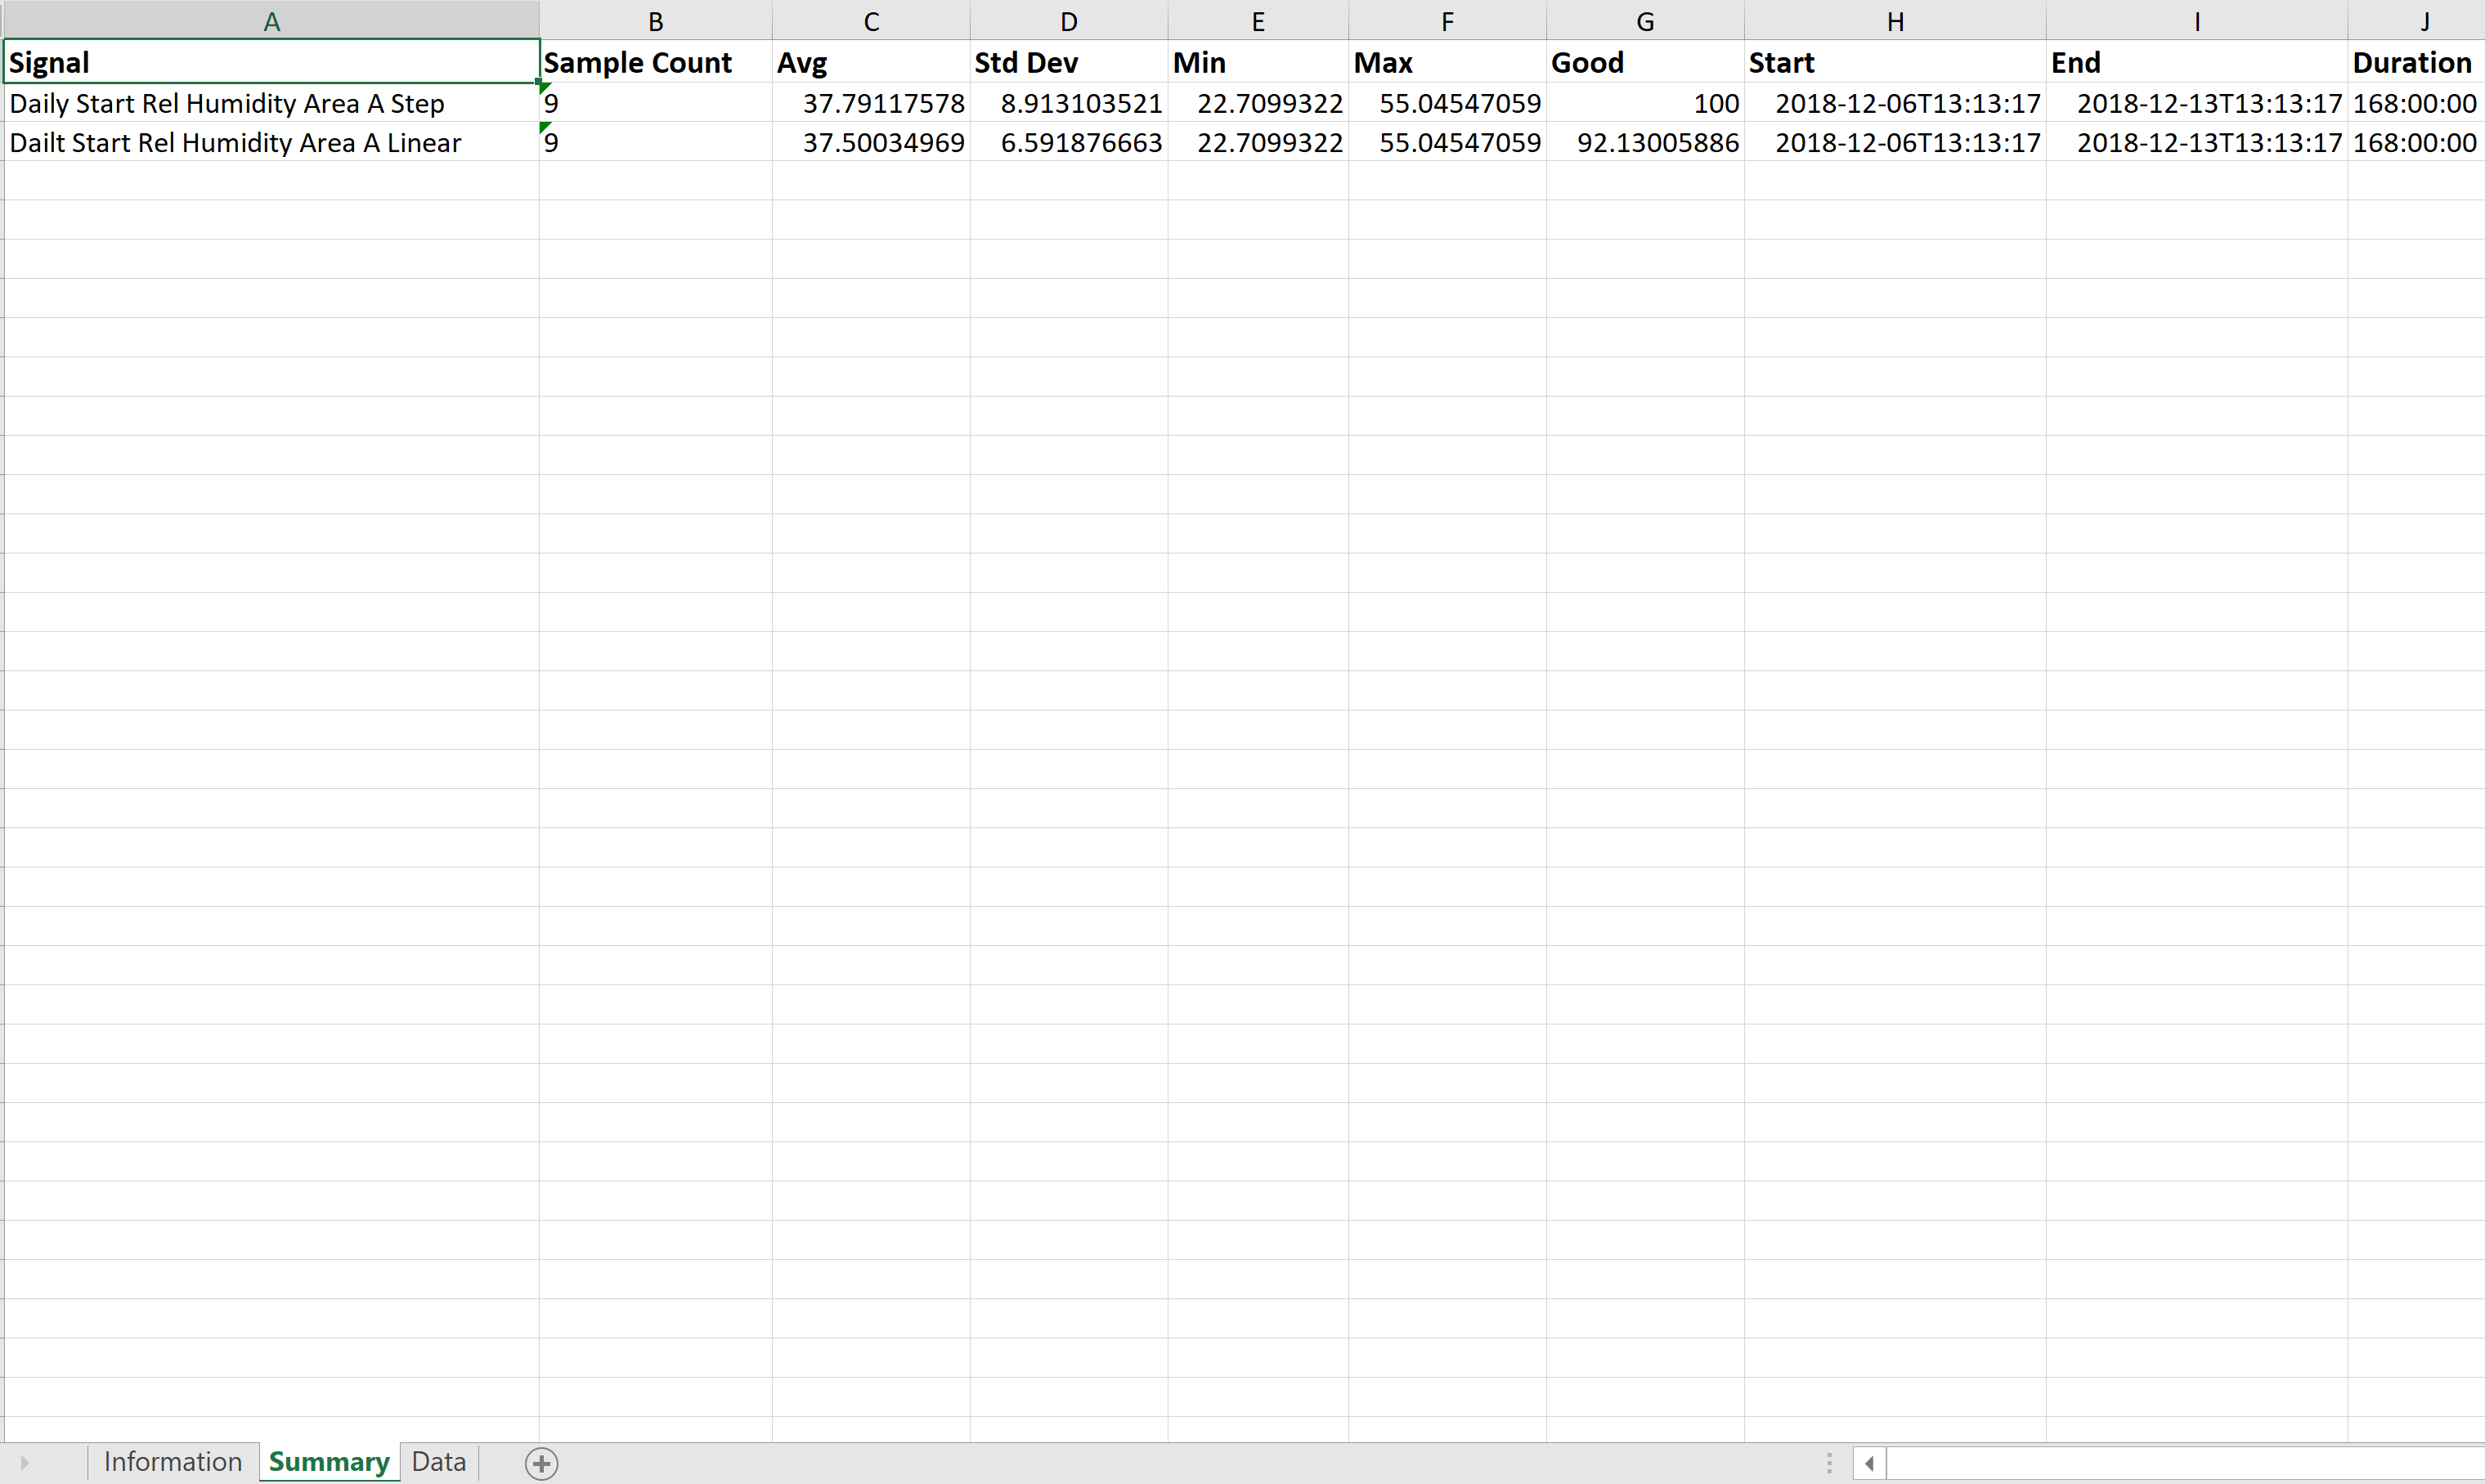
Summary data gives the general statistics of the signal during the display range. The stats shown are the signal's name, sample count, average, standard deviation, minimum, maximum, percent good, and the start, end and duration of the display range.

Signal Samples
The signal sample section allows users to report the value of a signal at different timestamps. The grid period options determine the timestamps that will be output.
Automatic Grid Period: Looks at the signal with the most frequent sampling rate and outputs samples for each signal with a timestamp interval based on it. For example, if your most frequent sampling rate is 5 minutes, the values exported will be separated by 5 minutes.
Custom Grid Period: Samples are segmented according to the grid period you set. For example, a grid period of 1 hour leads to values with timestamps separated by an hour.
Override Grid Origin: The specific date and time to orient the grid period. For example, this allows a weekly grid to be calculated every Monday at 9:00 AM rather than the default of Sunday at midnight.
Ungridded Original Timestamps: This option returns the timestamps and values of all of the samples recorded that are shown in your display range.
Time Zone
This is the time zone to be used for all times within the export. This setting defaults to that of the source worksheet. If the selected zone observes daylight savings time, ambiguities may occur at these events.
Input Signal Interpolation
Since samples do not always occur at a select timestamp, Seeq interpolates to determine what would be the value of the signal at this point if it had a sample. Please refer to Interpolation to learn more about the options Seeq has for editing interpolation.
When looking to export to Excel in Seeq, take note of how the data is being brought from your historian and made into a Seeq signal. The formula tool can be used to make changes to the format of the signal without changing the value of the samples. Once the interpolation and sampling rate are known, your grid period can be changed to export the data to Excel at the rate you want. Please note that the data shown in excel is in the default Excel time zone of the server. The time zone can be found in the Information tab of the Excel export in the line that contains "This file was created".

