Engineer Get Started
What is Seeq?
Seeq offers 3 browser-based apps:
Workbench (trending & data analytics)
Organizer (auto-updating reports & dashboards)
Data Lab (deploy Python scripts)
So you can work, collaborate, & share, anytime & anywhere. Analytics & visualizations can auto-update as new data are recorded.

Access All Data in One Place
Search for your data and click to add it to the trend.
Your IT/Admin sets up data connectors to historians, SQL data, & much more.
Seeq handles data with different sample spacing (gridding) using automatic cross-interpolation, eliminating hours of manual work.

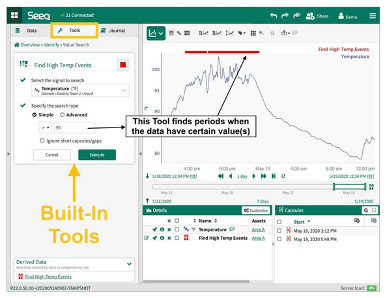
Analyze Data
with point-&-click tools in the Workbench app.
Seeq has built-in tools for:
Contextualization (identifying periods of interest)
Data cleansing
Calculations, including custom calculations
Modeling & prediction
Deploy Python scripts, use no-code ML Add-ons, and make your own Add-ons in Data Lab.
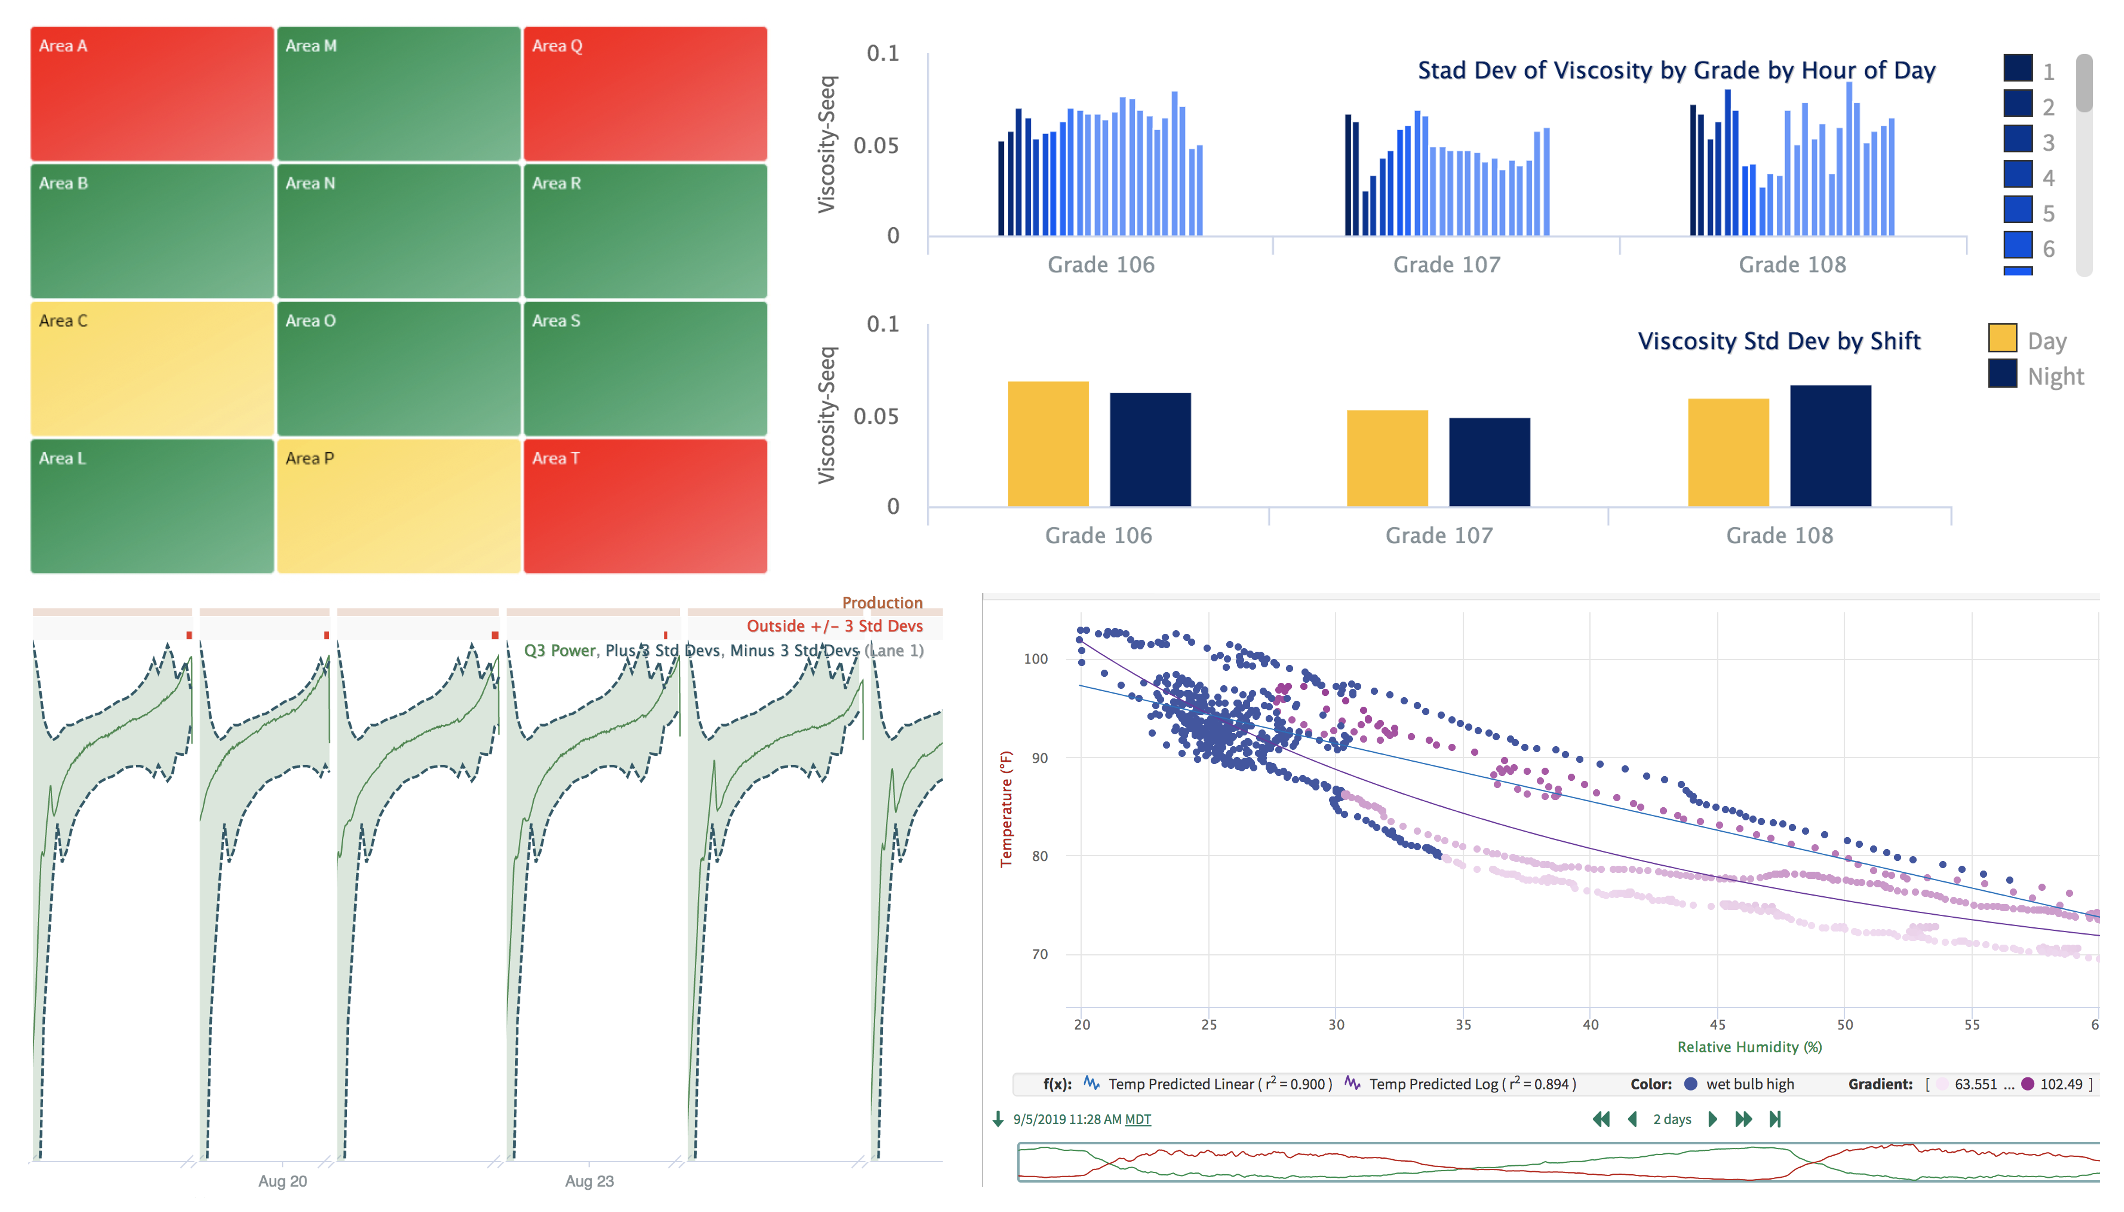
Visualize Data
Interactive trending enables you to find insights quickly.
Seeq also features XY plots, bar graphs, tables, a variety of built-in chart types, asset tree maps that show you alerts occurring across groups of similar units, various "event" views, & more.
Bookmark any step or view to quickly return to that moment in your analysis.
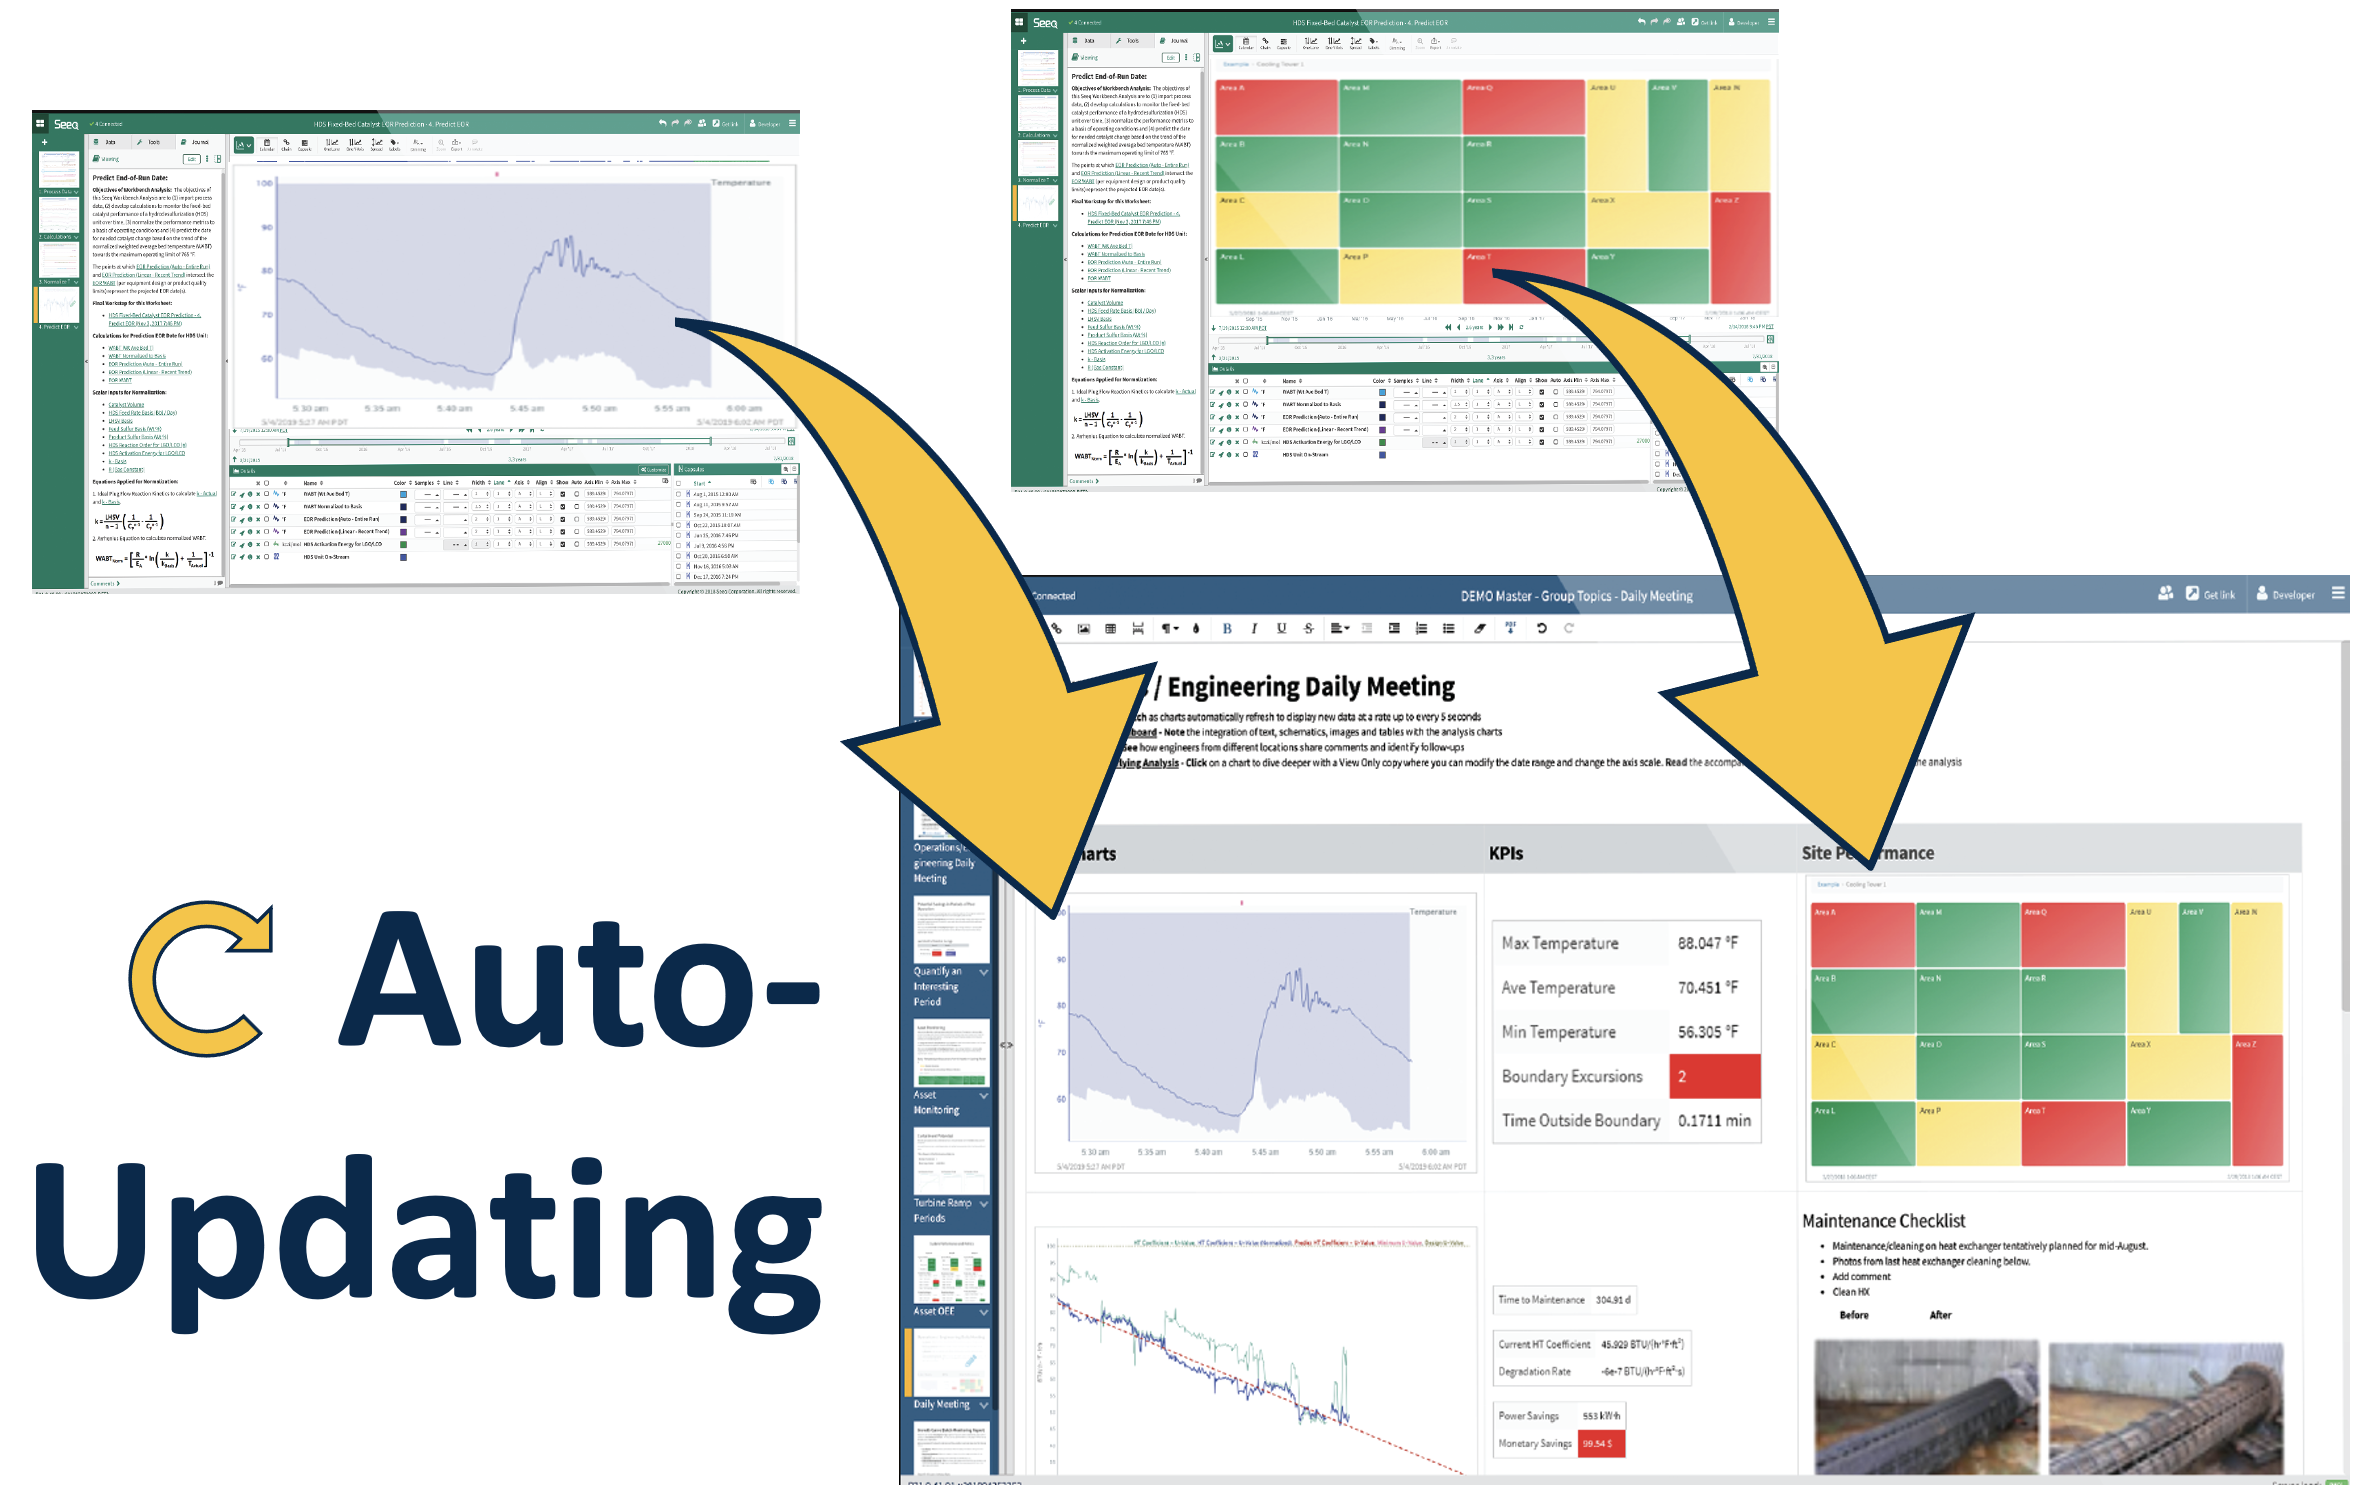
Auto-Updating Reports & Dashboards
in the Organizer app.
Compile analytics figures with other information into reports or dashboards. Then, set them to auto-update on-demand or on schedule as needed.
What’s Next?
Hands-on Training

Quickly learn skills useful for your role
Hands-on, industry-relevant exercises
Certifications
How to Access Training
Get Branch Code* (from Seeq home screen or your admin)
Click “Register” on training.seeq.com
Choose your role
Browse resources on support.seeq.com
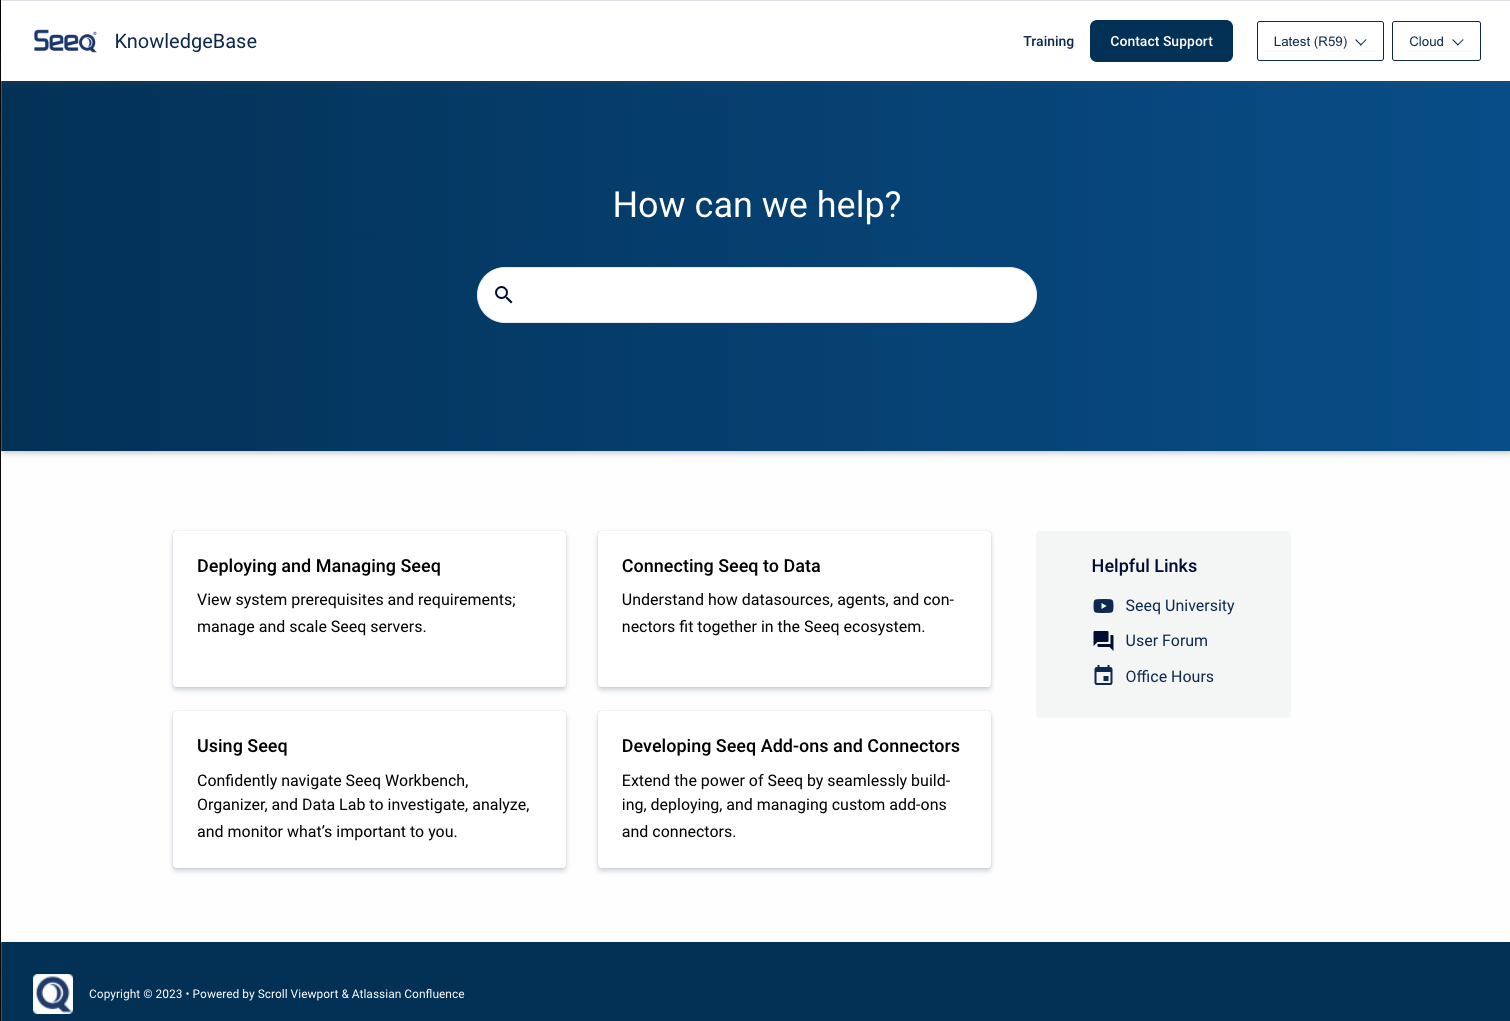
Knowledge Base, Videos, Forum, Office Hours, and more.
Also accessible through your Seeq Homescreen.