Boundaries
Boundaries enable users to visualize upper, lower and other signal limits. This is particularly useful in process monitoring, as it enables the user to easily identify if a signal is operating within its limits or deviating from the normal or expected behavior.
Boundaries Upgraded to Metrics
In R58, the Boundaries Tool will be retired. Please use Scorecard Metrics to create shaded regions on trends going forward.
No action is required for users of previous Boundaries, they automatically upgrade to Metrics in R58. This is what you can expect where boundaries were previously used.
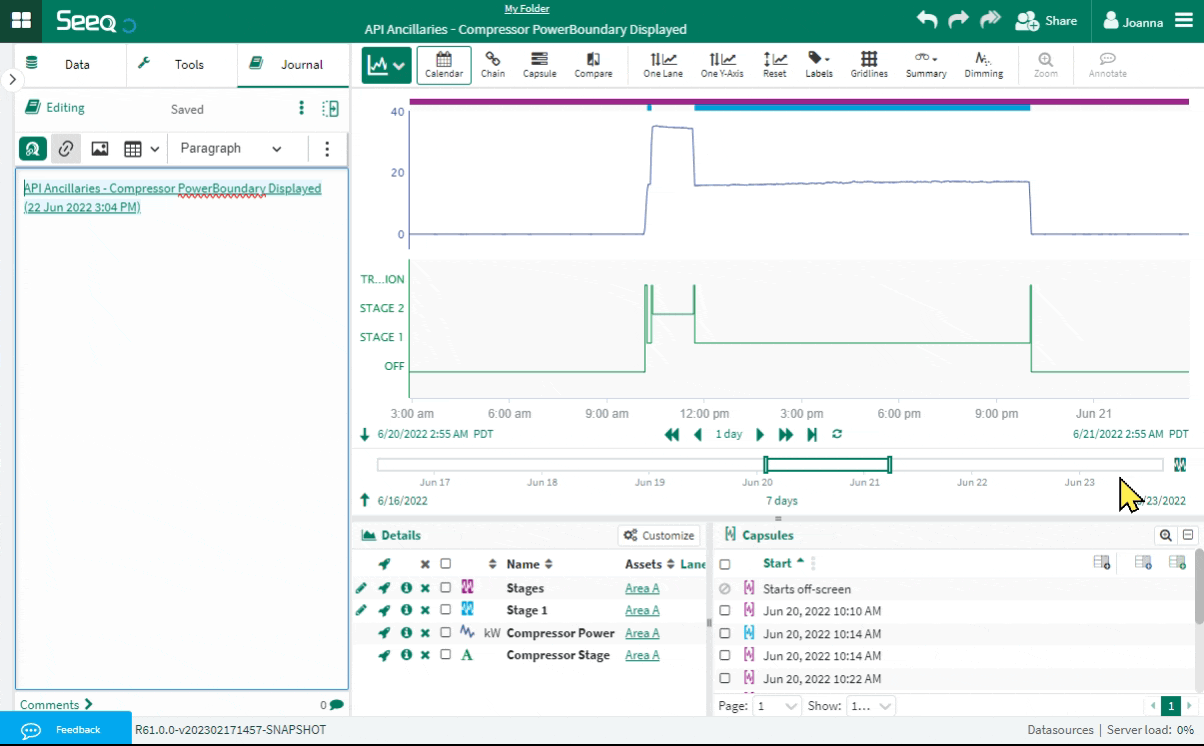
You will not see a difference on the trend where a boundary was previously displayed, even as you navigate through time. The shaded region will continue to display until the item it is associated with is removed from the display.
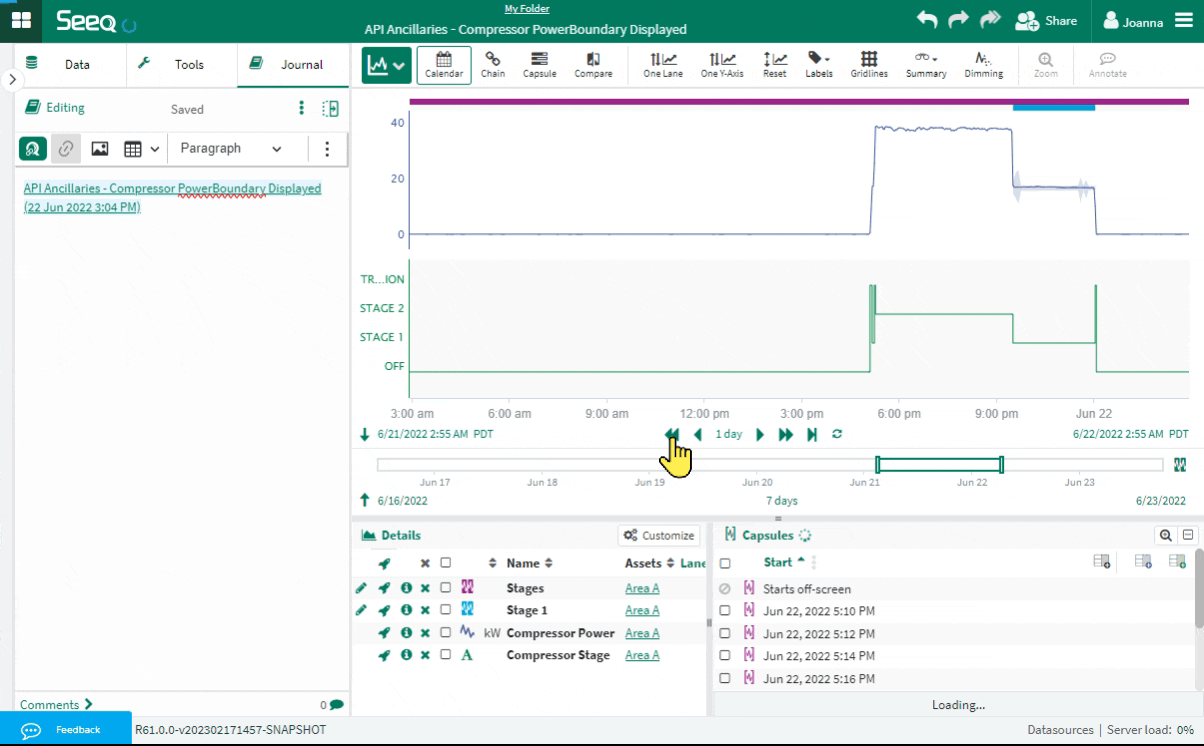
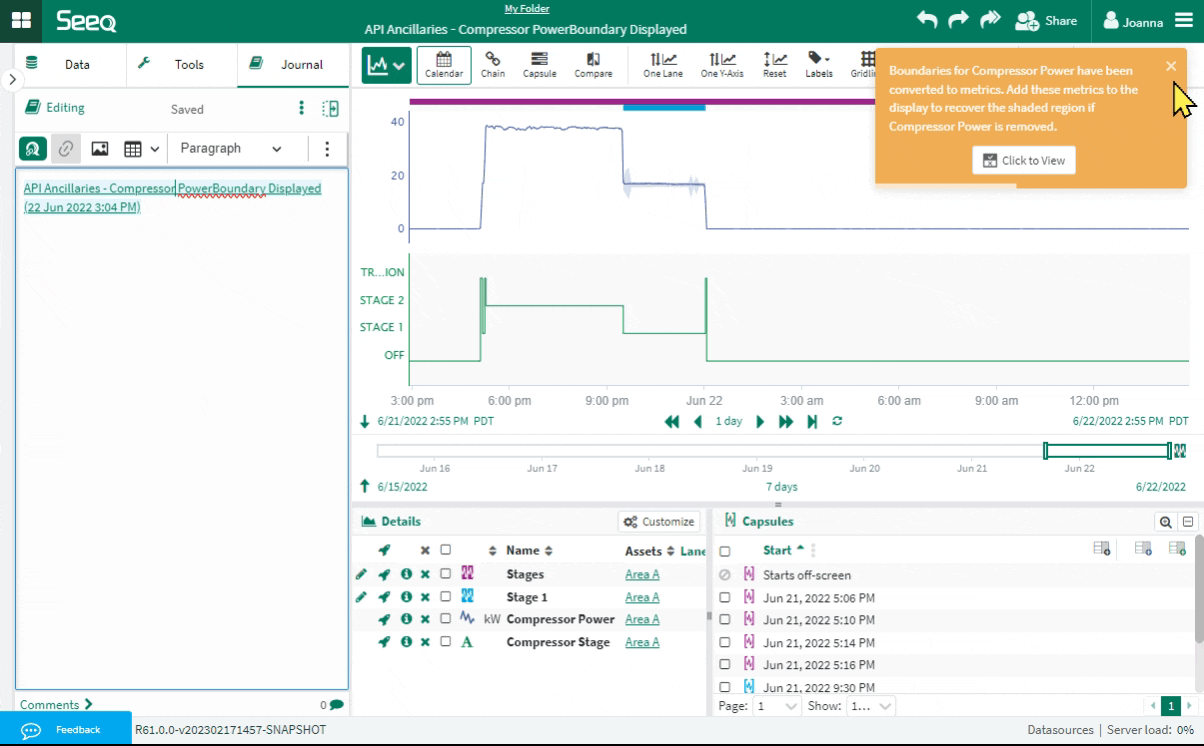
The boundaries button in the details pane no longer exists to discover boundaries, so the yellow pop up links you to Item Usages for the item with previously existing boundaries. All boundaries were updated to metrics automatically and contain “Boundary” in their name. You can also find this list of item usages for any item by clicking on the ![]() button in the Details pane for any item, then selecting Usages.
button in the Details pane for any item, then selecting Usages.
If you do not want to see the above yellow pop up every time you open your worksheet, remove the signal and add the Metric. You may need to reorder items in your display and may need to update Metric colors to have the same visualization as a previously existing boundary.
If you unintentionally remove the signal that had a shaded region that was previously a boundary, the only way to get a shaded region back is to add the Metric to the Details Pane.
If you used journal links where boundaries were displayed, they will still display as shaded regions without a Metric displayed.
Using the Boundaries Tool
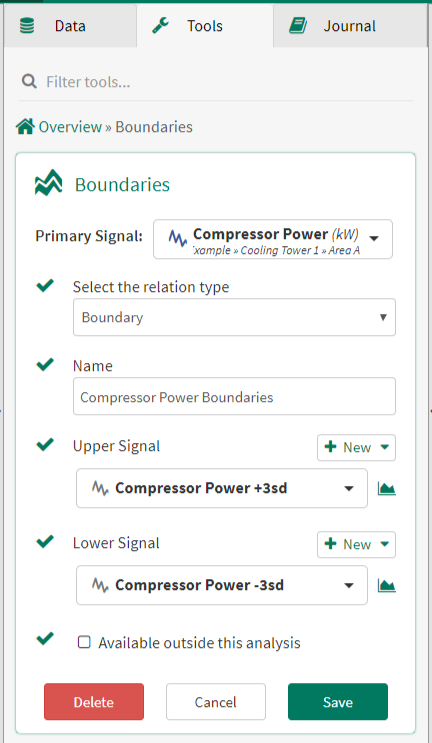
Primary Signal: From the dropdown menu, select the time series signal for which the boundaries will be applied from the details pane, pinned items or recently accessed sections.
Select the relation type: From the dropdown menu, select Boundary or Other. The Boundary option allows you to create a pair of upper and lower boundary limits for the Primary Signal. The Other option allows you to define a single boundary for the Primary Signal such as an upper, lower, average, reference or other. If Boundary is selected as the relation type, an upper and lower signal must be provided and the boundaries will be displayed as a shaded region between the upper and lower signals. If Other is selected as the relation type, a single signal must be provided, which will be displayed as a dashed line.
Name: Specify a name for the new boundary or pair of boundaries.
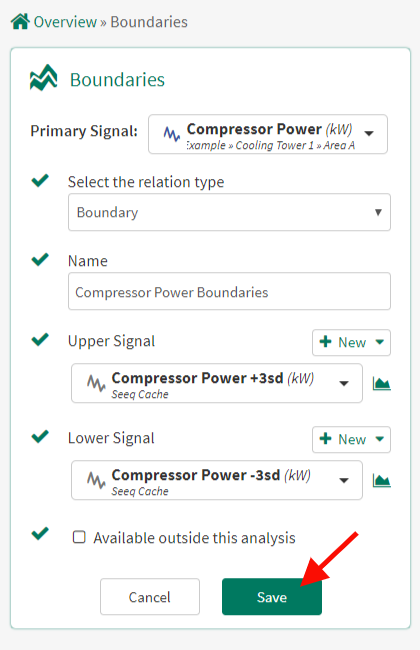
Upper Signal and Lower Signal: If you have already defined signals to represent the upper and lower limits, select the signals from the appropriate dropdown menus. If you have not yet defined signals for the boundaries, click 
![]()
Available outside of this analysis: Checking this box allows this condition to be used in other workbench analysis and topics. It will be available for all Seeq users and will display in their search results. Consider using a unique name as the boundary will be published to the global name space.
Create Boundaries
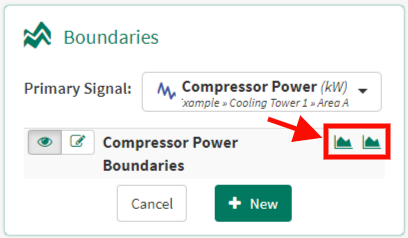
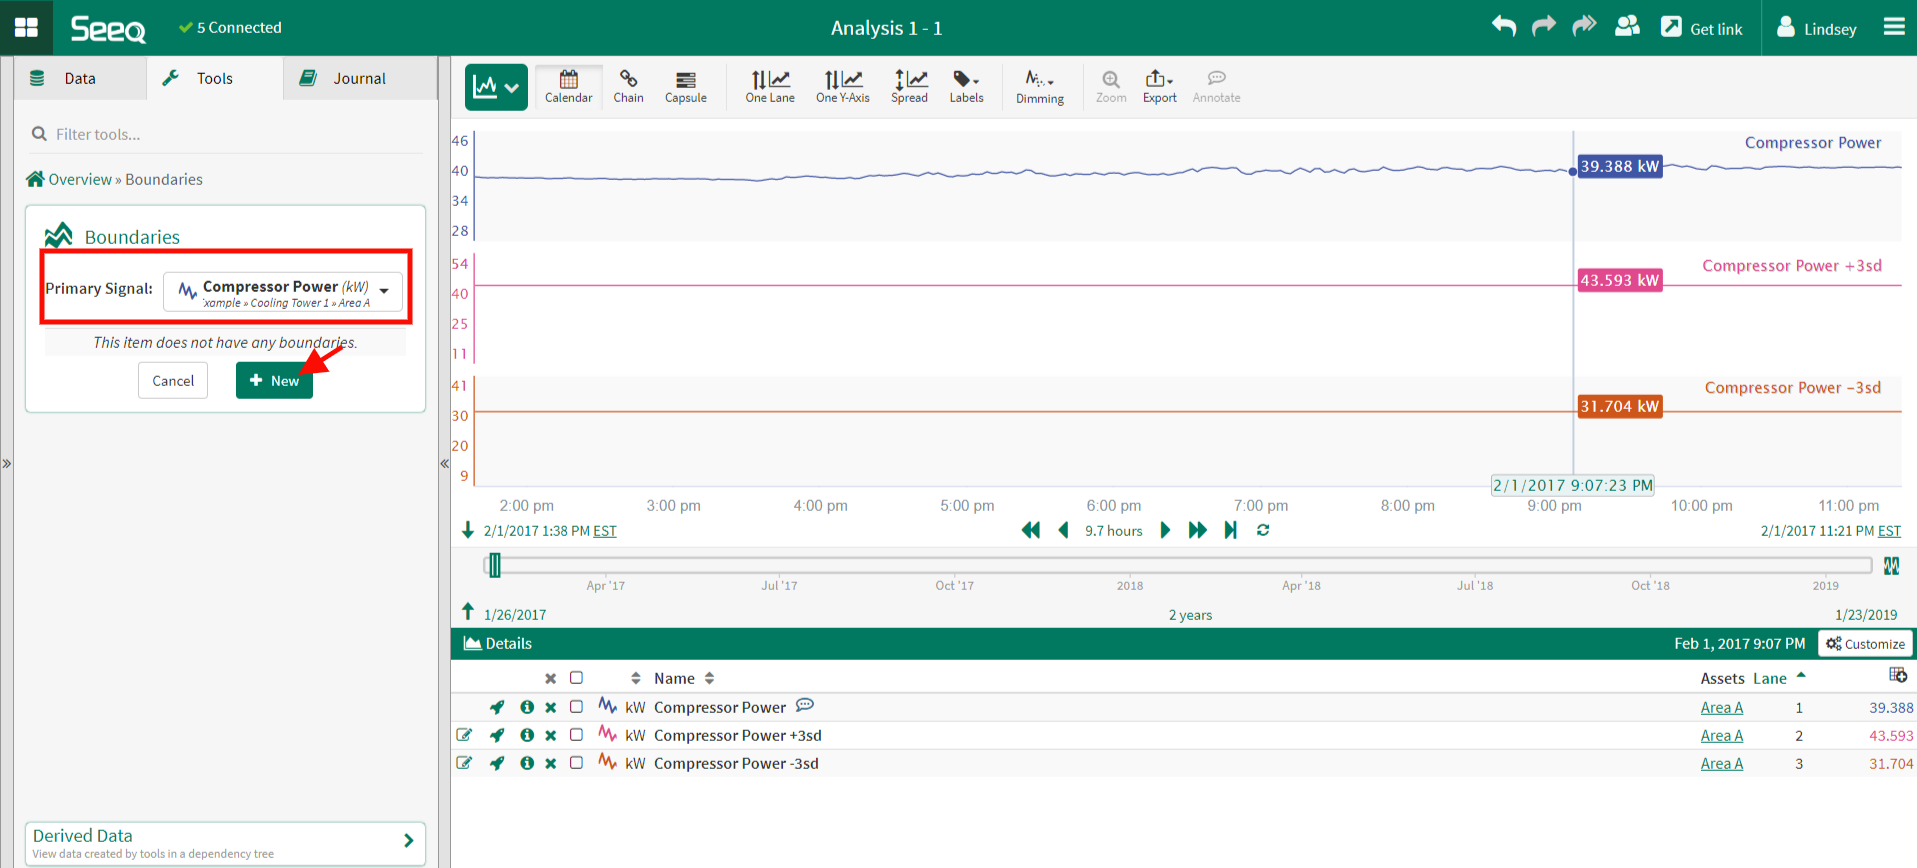
Once the Boundaries tool is selected from the Tools menu, specify the Primary Signal. If the Primary Signal already has boundaries configured, they will be listed. If no boundaries are configured, click New to add boundaries to the signal.
Once the inputs are provided, click save to apply the boundaries to the signal.
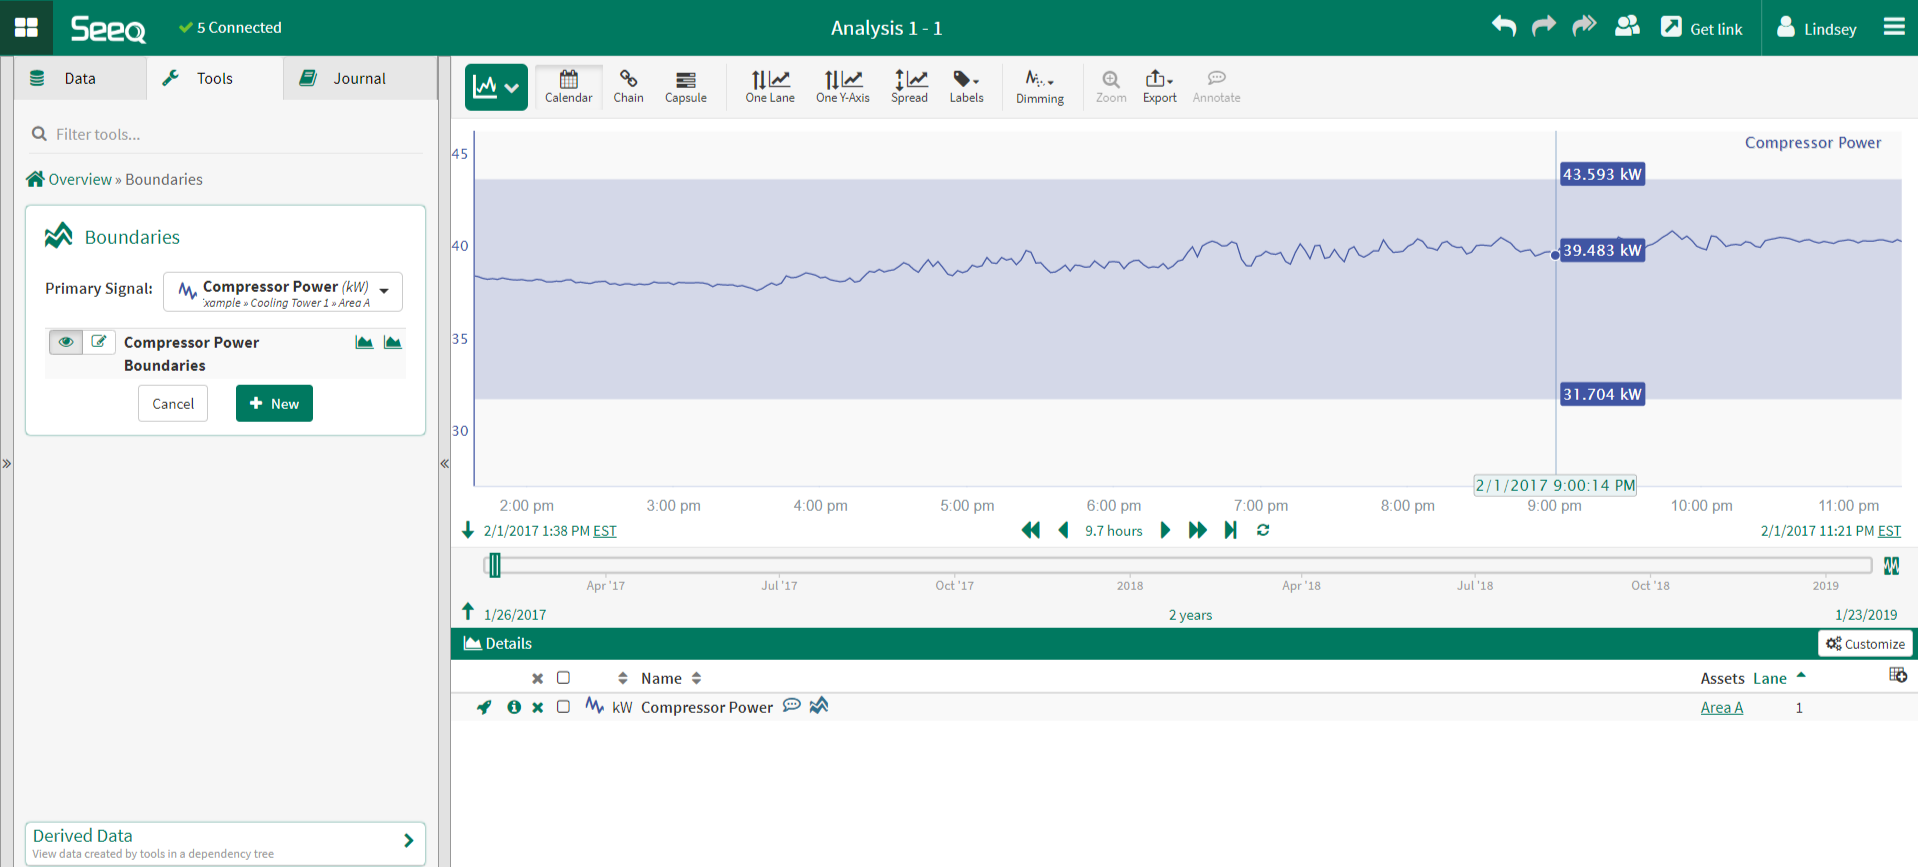
The configured boundaries are now listed under the Primary Signal in the Boundaries tool. Note that the Upper and Lower signals provided as inputs in the Boundary Tool are no longer trended as separate signals; they are now plotted as boundaries in the same lane as the Primary Signal.
Edit & Delete Boundaries
If a signal already has boundaries configured, an icon is displayed next to the signal in the Details Pane. To edit the boundaries, the user can click on this icon or navigate to the Boundaries tool for the signal.
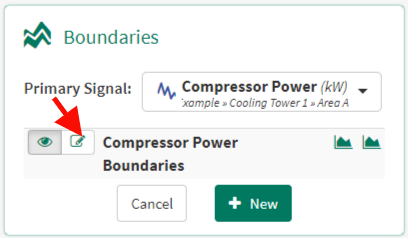
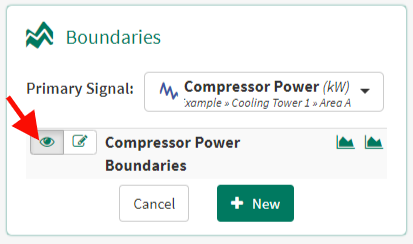
On this menu, the 'eye' icon can be selected to add or remove the boundaries from display. Note that removing the boundaries from display does not delete the boundaries.
Click the edit icon to edit the information or delete the boundaries.
Click the icons on the right to add the upper and lower signals to the Details Pane and trend the signals in a new lane.