What's New?
Workbench
Filtering in Capsules Pane
Users working with many capsules, especially those with properties like batch ID, product grade, or failure code have been using Seeq Formula to create new conditions to display results of a single property value. Now you can apply a filter from the Capsule Pane to reduce the number of capsules displayed to those that meet your criteria. This will update all Trend Views and Scatter Plot displays that have conditions present. This will make it much easier for you to compare operations when in certain operational modes, even if they were years apart.
Capsule View segment limit increase
We’ve increased the number of segments (number of capsules times number of signals) that can display in Capsule Time from 90 segments to 300 segments.
Multiple Y Signals in Scatter Plot
Workbench users wanting to explore how more than two signals may relate to each other can add more than one signal as a y axis in Scatter Plot. When a second y axis signal is added, the color scheme will automatically switch to color by signal, but other color schemes can be used under the color icon in the toolbar.
Multi-Select to add to Trend
Adding data to the trend is now quicker and easier with the addition of the multi-select option. The previous functionality where you add a single item to the screen by clicking it still works. Now there is a checkbox at the top which allows you to select all items in an asset tree or all results that match a search query.
Next you can choose whether you want the signals to be added to the same lane and axis or separate lanes and axes.
This functionality will save a lot of time when needing to add large numbers of items to the screen.
Multi-Select to add to Asset Group
Multi-select has also been added to Asset Groups so that users can create custom Asset Groups easier and quicker. The previous method of adding individual items to an Asset Group using the green icons still works. Now, a select all box appears at the top allowing users to add all assets from an existing asset tree or all items that match a search query with only a few clicks. Users can use the dropdown to choose whether they want all items under the assets to be added or only items that already exist in the Asset Group.
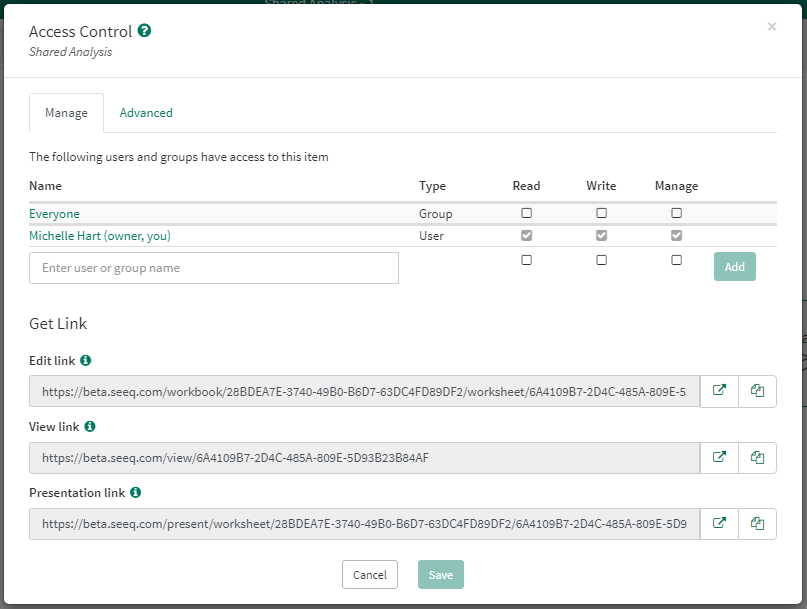
Share replaces Access Control and Get Link
The Access Control and Get Link buttons have been combined into one button called “Share.” Now users can grant access to others and copy the link all in one place. This will make the process of sharing Analyses and Topics with others easier.
The Everyone group now always appears at the top so that you can easily share an Analysis or Topic with everyone in your organization.

Formula
New functions: reduceUnits(), mergeProperties()
New Capabilities: capsule matching by property
External calculations renamed to Add-on calculations
See What's New in Formula? for more information
Organizer
Interactive XY Plots
XY Plots inserted in Organizer also have an interactive option so that you can hover over the XY Plot to see specific values and timestamps instead of clicking through to Workbench for that level of detail. Clicking to the underlying Workbench still works for further exploration and continuous improvement updates.
.gif?inst-v=d1622f71-7343-4c94-9620-c16c84aeb738)
Home Screen
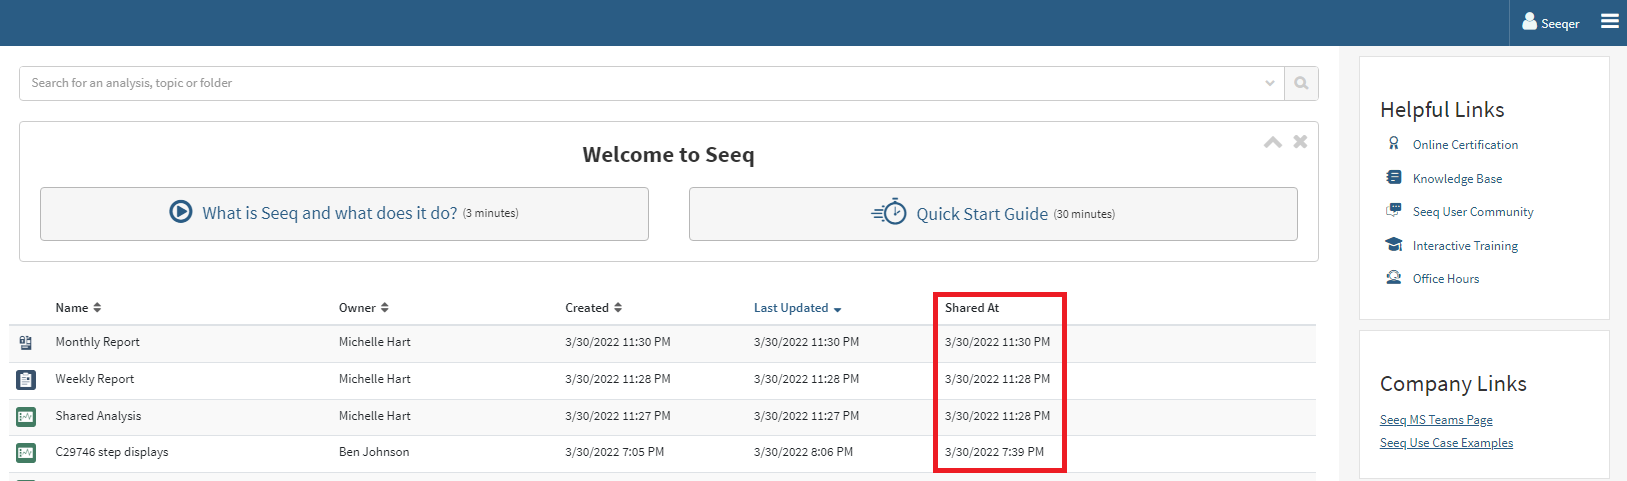
‘Date Shared’ added to Analyses and Topics
A ‘date shared’ property has been added to Analyses and Topics so that users can view the date these items were shared with them. This will help users more easily find Analyses and Topics they are interested in.
SPy/API Users
SPy Trees
SPy Trees is an approachable, low code solution to building and scaling out custom asset trees using SPy. More information on how to use SPy Trees can be found in the Asset Tree 1 - Introduction.ipynb notebook in the SPy Documentation of Data Lab Project.
See https://python-docs.seeq.com/changelog.html
Administrators
This release brings support for several more connections including Cygnet 9.5+, Google BigQuery, and Azure Synapse.
Connectors can also configure metadata for properties.
Preview features
Read more details in the release notes.
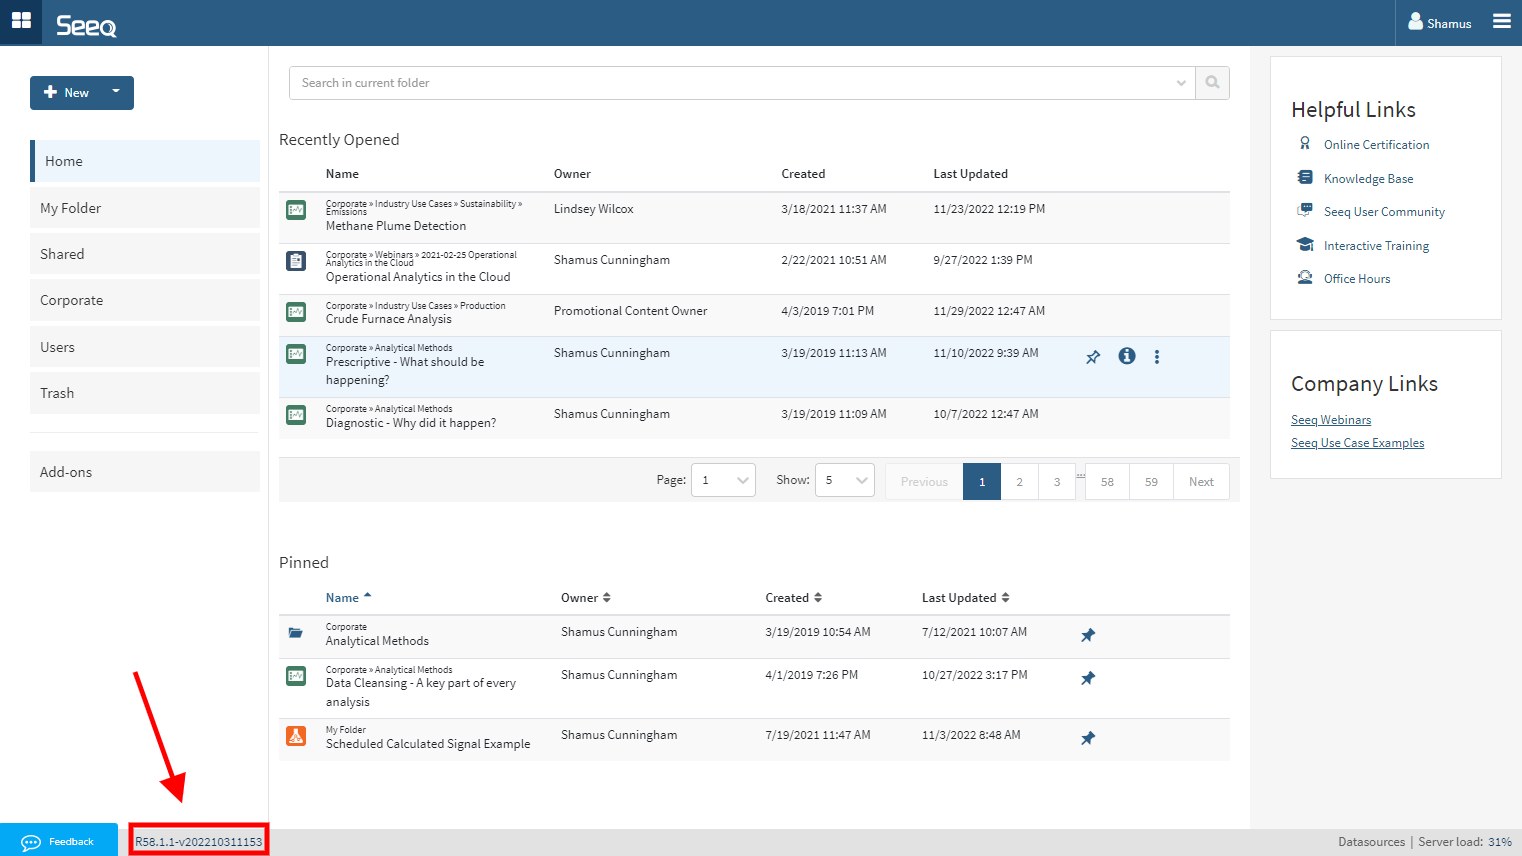
Check out the lower left corner of your Seeq browser window to see which version you have.